This chapter describes the existing transportation system and future conditions with implementation of the NEC FUTURE Tier 1 Draft Environmental Impact Statement (Tier 1 Draft EIS) No Action Alternative and Action Alternatives. This chapter is organized as follows:
This chapter focuses on the passenger rail network in the context of the comprehensive multimodal transportation system within the Study Area - how passenger rail serves travel between markets, how stations provide access to passenger rail, and the effect of changes in passenger rail travel on the overall transportation system.
As described in Chapter 4, Alternatives Considered, the FRA took a market-based approach to develop the Action Alternatives, first identifying current travel patterns, then analyzing how they have changed over the past three to four decades, and identifying potential new rail markets. The four primary geographic markets on the existing NEC - Washington, D.C., Philadelphia, New York City, and Boston - feature passenger rail stations within or immediately adjacent to their respective central business districts (CBD). Passenger rail stations in these markets, and in numerous other markets in the Study Area, provide the easiest and quickest access to each CBD (the centers of commerce and economic development activity) as well as to confluences of residential neighborhoods. Passenger rail stations also serve as hubs or connection points for other local and regional public transit services such as local buses, subways, and light rail. The importance of passenger rail stations is further emphasized by recent transportation network use trends showing that growth in the use of the Study Area's passenger rail and public transit services far exceeds growth in use of the Study Area's highway network.
This Tier 1 Draft EIS considers two passenger rail service types. Passenger rail travel between cities or metropolitan areas is defined as Intercity service, and today occurs exclusively on Amtrak. Rail travel within a metropolitan area is defined as Regional rail, and occurs exclusively on Regional rail operators. Chapter 4, Alternatives Considered, further describes both Intercity and Regional rail services, as referred to in this Tier 1 Draft EIS.
While the purpose of NEC FUTURE focuses on passenger rail service, the NEC FUTURE scoping process, along with input received from freight rail operators and state and regional stakeholders, identified the preservation of freight rail as an important objective. Recognizing the importance of freight rail operations along the NEC, the Action Alternatives preserve access to freight rail customers who use the NEC for goods movements and do not preclude future expansion of freight rail service in the corridor. In addition, the FRA is seeking opportunities to create benefits for both passenger rail and freight rail service where practicable.
Other transportation modes are considered in the context of how investments to passenger rail affect the overall transportation system. Specifically, highways refer to travel on the interstates and major state highways in the Study Area by auto and intercity bus. Public transit refers to the local and regional public transit network that includes local bus service, heavy rail (subway), hybrid rail, light rail, and trolley service. Public transit trips typically occur within one metropolitan area and normally consist of trips of shorter time and distance compared to trips on passenger rail. For the existing transportation system description (Section 5.3), data are presented as 2012, unless otherwise noted. The data measure for each mode, as well as the source, is as follows:
The No Action and Action Alternatives would result in both positive and negative effects to the multimodal transportation network within the Study Area. Specific transportation-related effects of the No Action and Action Alternatives considered in this chapter include the following:
The FRA analyzed transportation effects of the No Action and Action Alternatives at a "corridor-wide" level and a locally focused "stations" level. The corridor-wide analysis focuses on Intercity travel. The analysis compares forecasted travel conditions for metropolitan-area to metropolitan-area passenger travel by automobile, aviation, and rail. It also considered shifts in the mode of travel, and the shifts are summarized by states and metropolitan areas in the Study Area.
In the stations analysis, the FRA considered changes in travel modes within a metropolitan area with a focus on changes to local connectivity and passenger rail service, using the stations along the NEC as the locus of analysis. At the stations level, the FRA considered local effects of the No Action Alternative and the Action Alternatives both at individual stations and at station-pairs. The Affected Environment and area for which transportation effects of the No Action Alternative and Action Alternatives are described is the Study Area.
Representative service plans for each Action Alternative were developed for comparison purposes and are not intended to be prescriptive.
There are 181 Major Hub, Hub, and Local stations considered as part of the NEC. Of these 181 stations, the FRA identified 25 representative stations to highlight the type and magnitude of benefits and effects on travel in each of the Action Alternative, when compared to the No Action Alternative. (See Appendix C, Targeted Stations Analysis.) These 25 rail stations are highlighted to demonstrate the types of impacts that station would experience as part of the No Action and Action Alternatives. These representative stations include the four Major Hub stations, as well as 21 other stations, that demonstrate how the No Action and Action Alternatives affect local and market-to-market travel. The FRA used the representative stations to evaluate the connectivity of the passenger rail system via a discussion of service frequency, new or expanded service types, and opportunities for integrated passenger rail scheduling and user convenience.
In addition, the FRA selected 17 station-pairs assembled from the 25 representative stations to highlight how the No Action and Action Alternatives provide new Intercity travel linkages between markets or offer improved Intercity connections between existing markets. The FRA used the representative station-pairs to evaluate the performance of the passenger rail system via a discussion of frequency of service between stations, travel time, and changes to the types of services between station-pairs. (See Appendix C, Targeted Stations Analysis.)
For both representative stations and representative station-pairs, ridership was also used to predict how the traveling public would respond to changes in infrastructure and service that allow for improvements to Intercity and Regional rail. Ridership for Intercity is measured between representative station-pairs, and ridership for Regional rail is measured at selected metropolitan areas Ridership data represented throughout the Tier 1 Draft EIS are representative and were not optimized to capture the maximum potential ridership for each representative station and representative station-pair. The ridership estimates are based on the Service Plans2 created for the No Action and Action Alternatives. Therefore, estimated ridership is representational and consistent with a Tier 1 Draft EIS level of detail. (See Appendix B, Ridership Analysis Technical Memorandum.)
The No Action and Action Alternatives would result in both positive and negative effects to the multimodal transportation network within the Study Area. Each of the Action Alternatives create new connections and travel options within the Study Area. Alternatives 2 and 3 provide service to new off-corridor markets. By providing more travel options, the Action Alternatives generate significantly greater Intercity and Regional rail ridership compared to the No Action Alternative: the greater the improvement in frequency of service, types of services, travel times, and the number of metropolitan areas connected to the rail network the higher the projected ridership.
The Action Alternatives also improve connectivity at Intercity stations by increasing the daily duration of rail service at many stations, making rail service available for longer periods of the day and hence more convenient to travelers. Alternatives 1, 2, and 3 include service frequencies and daily durations of service that are more robust than the No Action Alternative, which expand mobility options for travelers and improve the attractiveness of passenger rail as a travel choice. The Action Alternatives result in more convenient passenger rail with increased service frequency at many Regional rail and Intercity stations. The greatest change in trip frequencies between stations is possible with the capacity and travel time improvements included in Alternative 3.
While NEC FUTURE focuses on passenger rail and the role of rail as part of the multimodal network, this Draft Tier 1 EIS describes existing multimodal system to better understand total travel in the Study Area, as well as how improvements to passenger rail would affect other travel modes. Table 5-1 identifies the number of trips made annually in the Study Area in 2012.
Alternatives 1, 2, and 3 include service frequencies that are more robust than the No Action Alternative, expanding mobility options for travelers and improving the attractiveness of passenger rail travel.
The Study Area transportation network is used for all types of travel - tourism, commerce, commuter, and goods movement. Of these, commuter travel represents 19 percent of all annual trips made within the Study Area. 3 As shown in Table 5-2, commuters in the Study Area travel predominantly using automobiles. The greatest percentage of commuters using public transit and Regional rail occurs in the largest metropolitan areas: New York-Northern New Jersey-Long Island; Washington-Arlington-Alexandria; Boston-Cambridge-Quincy; and Philadelphia-Camden-Wilmington.
| Mode | Annual Trips |
|---|---|
| Highway | 382,900* |
| Air | 16,600 |
| Intercity bus | 10,600 |
| Intercity rail | 14,700 |
Source: NEC FUTURE Travel Demand Model, 2015
* Includes only Intercity travel, does not include auto commuting.
| Metro Area | Commuters | Percentage of Commuters | |||
|---|---|---|---|---|---|
| Auto | Public Transit | Regional Rail | Bike/ Pedestrian | ||
| Washington-Arlington-Alexandria | 2,990,831 | 76 | 14 | 1 | 4 |
| Baltimore-Towson | 1,324,165 | 86 | 5 | 1 | 3 |
| Philadelphia-Camden-Wilmington | 2,727,992 | 82 | 7 | 2 | 4 |
| Trenton-Ewing | 170,273 | 81 | 4 | 4 | 5 |
| New York-Northern New Jersey-Long Island | 8,692,910 | 57 | 27 | 4 | 7 |
| Bridgeport-Stamford-Norwalk | 437,034 | 82 | 3 | 6 | 3 |
| New Haven-Milford | 406,377 | 88 | 3 | 1 | 4 |
| Norwich-New London | 135,886 | 88 | 2 | 0 | 4 |
| Hartford-West Hartford-East Hartford | 585,485 | 89 | 3 | 0 | 3 |
| Providence-New Bedford-Fall River | 751,300 | 89 | 2 | 1 | 4 |
| Worcester | 382,338 | 91 | 1 | 1 | 3 |
| Springfield | 318,703 | 88 | 2 | 0 | 4 |
| Boston-Cambridge-Quincy | 2,315,120 | 76 | 10 | 2 | 6 |
| TOTAL (commuters) | 21,238,414 | 15,143,177 | 3,360,653 | 494,153 | 1,105,148 |
| TOTAL (percentage) | 71 | 16 | 2 | 5 | |
Source: U.S. Census Bureau American Community Survey 2011 3-year estimates. Excludes "Worked at Home" and omits "Other;" will not add up to 100 percent.
Within the Study Area, commuting trends changed between 2006 and 2012 (Table 5-3). Total commuting increased, along with a shift in percentage of commutation by mode. The percentage of the workforce driving to work declined in 11 of the 13 metropolitan areas in the Study Area, public transit commutation increased in nine metropolitan areas, and Regional rail ridership rose in eight of the metropolitan areas. Automobile commutation fell from 73 to 71 percent between 2006 and 2012, while public transit grew from 15 to 16 percent during the same period. Regional rail commuting was steady at 2 percent, and cycling and walking experienced a small increase.
| Metro Area 2006-2012 | Change in Commuters, 2006-2012 | Change in Percentage Points by Mode | |||
|---|---|---|---|---|---|
| Auto | Public Transit | Regional Rail | Bike/ Pedestrian | ||
| Washington-Arlington-Alexandria | 218,612 | -1.3 | 0.0 | 0.1 | 0.5 |
| Baltimore-Towson | 13,947 | 0.7 | -0.2 | 0.0 | -0.6 |
| Philadelphia-Camden-Wilmington | 35,556 | -1.5 | 0.2 | 0.4 | 0.2 |
| Trenton-Ewing | -1,180 | -1.7 | 0.0 | 0.2 | -0.6 |
| New York-Northern New Jersey-Long Island | 95,066 | -1.3 | 1.1 | 0.0 | 0.1 |
| Bridgeport-Stamford-Norwalk | 7,688 | 1.1 | -0.3 | -0.1 | -0.7 |
| New Haven-Milford | -1,418 | -1.5 | 0.7 | 0.1 | 0.6 |
| Norwich-New London | 3,918 | -3.1 | 0.6 | 0.2 | 0.8 |
| Hartford-West Hartford-East Hartford | -3,345 | -1.3 | 1.1 | 0.0 | -0.3 |
| Providence-New Bedford-Fall River | -26,926 | -1.1 | 0.1 | 0.1 | 0.5 |
| Worcester | -589 | -0.4 | -0.2 | 0.0 | 0.0 |
| Springfield | -4,210 | -2.1 | 0.6 | 0.0 | 0.4 |
| Boston-Cambridge-Quincy | 77,104 | -2.4 | 0.3 | 0.3 | 1.0 |
| 2006 Percentage of Total Commuting | 72.6 | 15.3 | 2.3 | 5.0 | |
| 2012 Percentage of Total Commuting | 71.3 | 15.8 | 2.3 | 5.2 | |
Source: U.S. Census Bureau American Community Survey 2011 3-year estimates. Excludes "Worked at Home" and omits "Other"; will not add up to 100 percent.
Seven metropolitan areas experienced an increase in the size of the commuting workforce between 2006 and 2012: Boston, MA; Norwich and Bridgeport, CT; New York, NY; Philadelphia, PA; Baltimore, MD; and Washington, D.C. Of these, three metropolitan areas, Norwich, New York City, and Philadelphia also observed a net decrease in the number of commuters driving to work and a net increase in the number of commuters using public transit, Regional rail riders, cyclists, and walkers.
Commuter travel creates the peak travel demand for automotive travel and Regional rail and contributes to the chronic congestion seen in the Study Area. As noted in Chapter 3, Purpose and Need, the entire transportation system experiences circumstances and locations of constrained capacity, compromised system performance, aging infrastructure, and gaps in connectivity. Highway users throughout the Study Area experience numerous locations of recurring congestion, resulting in delays and lost productivity. According to the Texas Transportation Institute, approximately 40 percent of the most congested highway corridors in the United States are located in the Study Area.4 In addition, according to the INRIX Traffic Scorecard, 7 of the top 25 most congested metropolitan areas in North America are located within the Study Area. 5 Growing demand for freight combined with recurring highway congestion continues to degrade roadway system performance in the Study Area and creates delays in the flow of goods and people throughout the highway network.
Population and economic growth in the Study Area will place increasing pressure on the existing transportation infrastructure. The population of the Study Area is expected to grow by approximately 6.4 million, and employment in the Study Area is projected to grow by approximately 2.8 million from 2012 to 2040, representing a 12 percent growth in population and 11 percent growth in employment. 6 Projected growth in specific areas that already experience recurring roadway congestion and extensive transit use, such as the Washington, D.C., Philadelphia, New York City, and Boston markets, are expected to exceed the Study Area average.
In addition to population and employment growth, travel preferences have evolved. Table 5-4 highlights the growing importance of passenger rail travel as part of overall tripmaking by mode observed in the Study Area from 2006 to 2012. This trend is observed both for Intercity and Regional rail.
| Mode | Measure | 2006-2012 Percentage Growth |
|---|---|---|
| Regional rail3 | Passenger Trips | 4.0% |
| Intercity rail4,5 | Ridership | 23.7% |
| Highway1 | Vehicle-Miles Traveled | 0.1% |
| Public Transit2 | Passenger Trips | 17.8% |
| Air6 | Enplanements | 2.6% |
Sources:
1. U.S. Department of Transportation Federal Highway Administration Office of Highway Policy Information Highway Statistics Series, Excel tables, vehicle-miles for urban interstate and other freeways and expressways for the states within the Study Area.
2. National Transit Database, Agency Profiles (bus, commuter bus, heavy rail, light rail, trolley, hybrid rail modes)
3. National Transit Database, Agency Profiles (commuter rail mode)
4. Amtrak state fact sheets for stations on the Northeast Corridor regional routes.
5. Amtrak data FY12 October-September
6. Federal Aviation Administration, passenger boarding (enplanement), and all-cargo data for U.S. airports
Passenger rail, as a companion mode to aviation, is growing. In selected market pairs in the Study Area linked by commercial air service, Amtrak Intercity, and intercity bus, the share of travel occurring on Amtrak is growing. Based on an analysis of travel between New York City and Boston, and Washington, D.C., and Boston, users are increasingly selecting to travel by Intercity rail. For those choosing to either fly or take Intercity rail with a choice between the modes, users are increasingly selecting to travel by passenger rail based on data provided to the Airport Cooperative Research Program.7
Millennials, in particular, are attracted to communities with multiple travel choices. Millennials (ages 18-36) are highly multimodal; they increasingly use smartphones and web resources to make rational travel choices based on cost, convenience, and environmental sensitivity; and they rank public transit as the primary mode of choice. 8
Housing and lifestyle choices affect the use of the multimodal transportation network. According to a 2015 survey by the Urban Land Institute, just over half of all Americans (and 62 percent of Millennials) would choose to live in a place where daily travel does not require a car and half of all Americans define the need for a walkable neighborhood as a top or high priority for their community. 9 In addition to passenger rail and public transit, cycling is growing as a preferred travel mode. According to the U.S. Census Bureau and the U.S. Census American Community Survey, the four largest cities in the Study Area each experienced growth from 2000 to 2013 in the percentage of commuting by bicycle. Over the same time period, the percentage of commuting by car declined and the percentage of public transit increased in each market. The introduction of bicycle-sharing in markets throughout the Study Area creates more access to bicycles and supports the ongoing popularity of cycling as a viable mode for travel and commutation.
Similarly, the importance of walking to work grew from 2008 to 2012, with the greatest percentage nationally of the pedestrian commuting observed in the Northeast United States. 10 Table 5-5 identifies the rates of walking to work ranked by the highest percentage observed by the U.S. Census Bureau from 2008 to 2012.
| City | Percentage of Commutation by Walking |
|---|---|
| Boston* | 15.1% |
| Washington, D.C.* | 12.9% |
| New York City* | 10.3% |
| San Francisco | 9.9% |
| Seattle | 9.1% |
| Philadelphia* | 8.6% |
| Baltimore* | 6.5% |
| Chicago | 6.4% |
| Minneapolis | 6.4% |
| Portland, OR | 5.7% |
| Average for 50 Largest US Cities | 5.0% |
Source: U.S. Census Bureau, Mode Less Traveled: Walking to Work by Region and City Size, 2008-2012, https://www.census.gov/prod/2014pubs/acs-25.pdf
*Within the Study Area
Research compiled by the Federal Highway Administration (FHWA) indicates that for shorter, commuting-style trips, mode choice is predictable, based on habit, and that the primary factors for mode choice overall are travel time and distance.11 The FHWA also notes that travel studies show that while for local trips, travelers often follow the same route, as travel distance increases, consideration of mode and route choice expand. Travelers consider factors such as traffic congestion, tolling and fares, parking, fuel prices, and the availability of public transit in their modal choice. 12 This indicates that Intercity travel is influenced both by mode and by distance.
For this Tier 1 Draft EIS, existing travel between markets in the Study Area is described by metropolitan-area pairs. The FRA selected eight representative metropolitan-area pairs to identify how existing travel by mode occurs today and to demonstrate the relative size of the various Interregional travel markets. These metropolitan areas are based on the U.S. Office of Management and Budget (OMB) Metropolitan and Micropolitan Statistical Areas, and differ slightly from the geographic Metropolitan Statistical Area (MSA) delineations described by the U.S. Census Bureau and OMB 13 to more accurately reflect the nature of market-to-market Intercity and Regional rail travel that is the focus of this Tier 1 Draft EIS.
Figure 5-1 identifies travel between the representative metropolitan-area pairs to highlight how transportation system users today travel by mode. Auto trips are the dominant mode for all metropolitan-area pairs, ranging from 99 percent of all trips for Hartford-Providence to 57 percent of all trips for Washington, D.C.-New York/New Jersey. Washington, D.C.-Boston is the one exception. For this metropolitan pair, air is the dominant mode, at 76 percent of all trips. Rail trips comprise the second-highest mode of travel for many metropolitan pairs, ranging from 20 percent of all trips for Washington, D.C.-New York/New Jersey to 1 percent of all trips for Hartford-Providence, where there are no rail or air connections.
Figure 5-1 : Existing Trips by Mode between Representative Metropolitan-Area Pairs (2012)
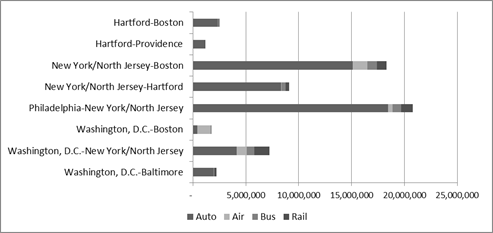
Source: NEC FUTURE Travel Demand Model, 2015 Transportation System Characteristics
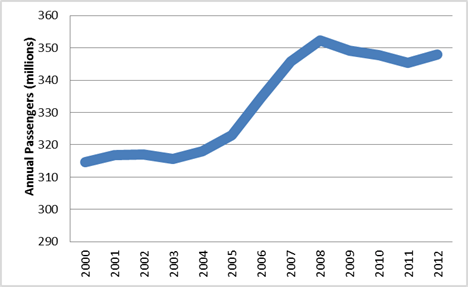
Total and per-capita VMT throughout the United States have declined in recent years, reversing a decades-long trend of increasing VMT. Similarly, total urban highway VMT among the Study Area states (Figure 5-2) has stabilized after showing steady growth, peaking in 2006 and declining through 2011. Overall, VMT has decreased 4.9 percent from the high of 489 million in 2006 to the current 465 million in 2012. Current VMT exhibited within the Study Area is shown below.14As population and economic growth increases overall use of the transportation network, there will be increased capacity demands on other modes of passenger travel.
Figure 5-2 : Highway Vehicle-Miles Traveled (2000-2012)
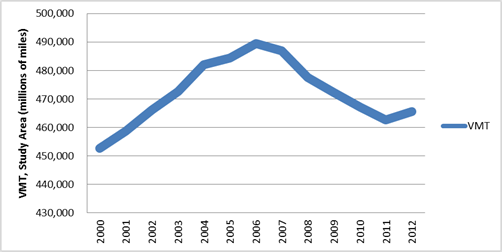
Source: U.S. Department of Transportation, Federal Highway Administration, Office of Highway Policy Information, Highway Statistics Series showing urban interstate, freeway and expressway VMT
Intercity bus services in the Study Area operate primarily to the major Intercity markets, often with pick-up/drop-off locations adjacent or near rail stations and CBDs. Locations with the Study Area served by intercity bus include Union Station in Washington, D.C.; 30th Street Station and Market East Station area in Philadelphia; the Port Authority Bus Terminal in New York City; and South Station in Boston, though travel is available to selected cities and municipalities throughout the Northeast. For example, population areas served by intercity bus include Cherry Hill, New Jersey; the WMATA Station in Greenbelt, Maryland; Storrs, CT, and Princeton, NJ; and Alexandria, VA. Service is often available curbside near the Javits Center in Manhattan; near Independence Mall in Philadelphia; and in various Chinatowns in the larger markets in the NEC.
Intercity bus providers in the Study Area that provide the major of intercity bus trips include Greyhound, Peter Pan, BoltBus, MegaBus, and the Yo Bus.15 Intercity bus travel is marketed in much of the Study Area as a lower-cost alternative to Intercity rail, with travelers willing to accept longer travel times for a lower fare compared to Amtrak service. The FRA estimates that approximately 2.5 percent of all intercity travel in the Study Area occurs on intercity bus.
Based on research conducted by the NEC Commission, the majority of intercity bus users surveyed identified that they selected intercity bus over Intercity rail, and would choose to travel by rail if intercity bus travel was not available. 16 Vehicle-miles traveled for intercity bus are included as part of the Total Highway VMT shown in Figure 5-2.
Air travelers in the Study Area are served by eight large-hub airports and one medium-hub airport. Table 5-6 identifies airport boardings (enplanements) at each of these airports from 2006 to 2012, and projected to 2040. Overall, enplanements increased 2.6 percent from 2006 to 2012, with major growth in enplanements at John F. Kennedy International Airport serving the New York City market and Baltimore/Washington International Thurgood Marshall Airport (BWI) serving the Baltimore-Washington metropolitan areas. Bradley International in Connecticut had a 22.4 percent reduction in passenger volume between 2006 and 2012. The Federal Aviation Administration estimates that by 2040, air travel at the large-hub airports in the Study Area will increase by 92 percent.17
| Airports | 2006 | 2012 | 2040 Projection | Percentage Growth 2006-2012 |
Percentage Growth 2012-2040* |
|---|---|---|---|---|---|
| Large-Hub Airports | |||||
| John F Kennedy International (JFK) | 21,041,501 | 24,520,981 | 61,253,000 | 16.4 | 150 |
| Newark Liberty International (EWR) | 17,804,107 | 17,055,993 | 32,229,000 | -4.2 | 89 |
| Philadelphia International (PHL) | 15,390,848 | 14,589,337 | 28,030,000 | -5.2 | 92 |
| Logan International (BOS) | 13,544,552 | 14,293,695 | 22,606,000 | 5.5 | 58 |
| LaGuardia (LGA) | 12,925,697 | 12,818,717 | 16,302,000 | -0.8 | 27 |
| Washington Dulles International (IAD) | 11,045,217 | 10,816,216 | 24,673,000 | -2.1 | 128 |
| Baltimore/Washington International Thurgood Marshall (BWI) | 10,297,607 | 11,186,444 | 22,027,000 | 8.6 | 97 |
| Ronald Reagan Washington National (DCA) | 8,973,410 | 9,462,231 | 12,733,000 | 5.4 | 35 |
| Medium-Hub Airport | |||||
| Bradley International (BDL) | 3,409,938 | 2,647,610 | n/a | -22.4 | n/a |
| Large-Hub Total | 111,052,939 | 114,743,614 | 219,853,000 | 3.3 | 92 |
| All Total | 114,462,877 | 117,391,224 | 2.6 | ||
Source: Federal Aviation Administration Passenger and All-Cargo Data, Terminal Area Forecast Summary, Fiscal Years 2012 to 2040, 2012
*Federal Aviation Administration estimate
There are 29 public commercial airports within the Study Area with active passenger service including 8 primary-hub airports, 1 medium-hub airport, 7 small-hub airports, and 13 other airports. The large-hub and medium-hub airports located within the Study Area along the NEC and the Connecticut Inland Route are outlined in Table 5-6. Other commercial airports within the Study Area include the following:
Air travel is not only an important connection from the NEC to the rest of the country and the world through long-distance flights but is also an important piece of the passenger network for travel within the Study Area. Table 5-7 shows the top 10 airport travel pairs within the Study Area in 2012. Seven of the top ten airport pairs by passenger travel were to and from Boston, including all three airports serving the New York metropolitan area, all three airports serving the Baltimore-Washington metropolitan areas, and Philadelphia International Airport. Travel to these seven airports in the Study Area accounted for 27 percent of all enplanements at Boston Logan Airport. Additionally, 24 percent of all passengers boarding at Bradley were bound for other Study Area airports. Between markets where highway and passenger rail travel have the greatest costs in money and time, air travel is most popular; connections from one end of the NEC, Boston, to the other, Baltimore-Washington, are the most popular air market pairs.
| Airport Pair | 2012 Passengers | |
|---|---|---|
| Boston Logan | Ronald Reagan National | 1,377,332 |
| Boston Logan | Baltimore-Washington | 1,048,796 |
| Boston Logan | JFK | 1,008,423 |
| Boston Logan | Philadelphia | 959,567 |
| Boston Logan | Newark Liberty | 910,775 |
| LaGuardia | Ronald Reagan National | 812,578 |
| Boston Logan | LaGuardia | 702,739 |
| Providence | Baltimore-Washington | 629,654 |
| Boston Logan | Washington Dulles | 583,525 |
| Bradley International | Baltimore-Washington | 499,381 |
Source: RITA TranStats 2012, http://www.transtats.bts.gov/
Public transit trips include those made by bus, heavy rail (subway), hybrid rail, light rail, and trolley operated by municipal and regional service providers. Public transit tripmaking relevant to this Tier 1 Draft EIS includes trips made on those systems that connect to Intercity stations on the NEC as these stations would be directly affected by the outcomes of the Action Alternatives. Figure 5-3 shows the growth in public transit ridership within the Study Area from 2006-2012. Total passenger trips on the public transit network increased 17.8 percent from 4.39 billion to 5.17 billion. Growth in public transit travel was led by heavy rail (subway), which grew 34 percent from 2.42 billion to 3.24 billion trips annually from 2006-2012.
Figure 5-3 : Public Transit Annual Passengers (2006-2012)
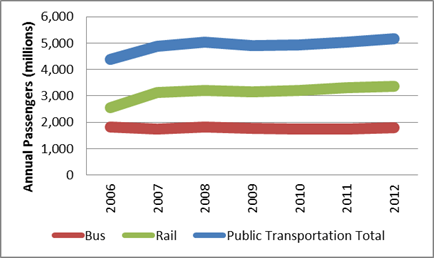
Source: Federal Transit Administration, National Transit Database 2006-2012, http://www.ntdprogram.gov/ntdprogram/
The NEC and its connecting corridors together comprise the busiest and most heavily used rail network in the United States. Passenger rail service within the corridor is provided by Amtrak Intercity service and Regional rail operators serving major metropolitan areas. Table 5-8 highlights the overall use of passenger rail service on the NEC by operator and, for Intercity, by type of Intercity service.
| Rail Carrier | Passenger Miles | Passenger Trips | Average Trip Length (miles) |
|---|---|---|---|
| VRE | 151,270,107 | 4,702,196 | 32.1 |
| MARC | 257,908,063 | 8,532,214 | 30.2 |
| SEPTA | 522,945,659 | 36,899,167 | 14.2 |
| NJ TRANSIT | 1,905,025,704 | 81,353,894 | 23.4 |
| MTA-Long Island Rail Road | 2,083,399,604 | 96,953,120 | 21.5 |
| MTA-Metro-North Railroad | 2,437,326,740 | 82,807,689 | 29.4 |
| Shoreline East | 13,570,719 | 624,172 | 21.7 |
| MBTA | 729,727,617 | 36,083,946 | 20.2 |
| TOTAL Regional rail | 8,101,174,213 | 347,956,398 | 23.28 |
| Amtrak (FY12) | |||
| Acela Express | 650,181,818 | 3,395,354 | 191 |
| Northeast Regionals | 1,330,952,381 | 8,822,946 | 151 |
| Northeast connecting corridors** | 300,938,508 | 2,950,027 | 102 |
| TOTAL Intercity | 2,282,072,707 | 15,168,327 | 150 |
Sources: Regional Rail Data: National Transit Database Transit Profiles: 2012 Full Reports; Amtrak Data: Amtrak Monthly Performance Report (September 2012)
** Includes Northeast Regional services on the NEC, in Connecticut, Massachusetts, and Virginia, Vermonter, New Haven-Hartford-Springfield, Keystone, and Empire Service routes
Existing Intercity service is operated by Amtrak, and within the Study Area, Amtrak serves the following:
Intercity ridership increased throughout the NEC by 23.7 percent between 2006 and 2012. Penn Station New York is the busiest Intercity station in the country. In 2012, Penn Station New York served over 9.4 million Intercity passengers annually. Washington Union Station is the second busiest station in the country, with 5.0 million riders in 2012, followed by Philadelphia 30th Street Station with over 4.1 million passengers.
This growth in ridership can be attributed to investments in rail infrastructure and service improvements, together which make rail a more attractive travel mode, and to the region's growth in population and employment. Changes in ridership have been observed following the recent service changes and investments in the NEC including:
Table 5-9 shows the ridership at stations with Intercity service in 2006 and 2012 and identifies the change in ridership over the six-year period. During that period, the greatest increase in ridership occurred at Newark, DE (117 percent) and Boston Back Bay, MA (77 percent). Ridership grew by more than 50 percent in the six-year time period at Mystic, Wallingford, and Windsor Locks, CT. In total, 28 of the 37 stations saw double-digit or higher ridership growth.
| Station | 2006 | 2012 | Percentage Change in Ridership |
|---|---|---|---|
| Washington Union Station | 3,859,117 | 5,013,991 | 30% |
| New Carrollton | 206,830 | 174,054 | -16% |
| BWI | 561,505 | 703,604 | 25% |
| Baltimore | 910,523 | 1,028,909 | 13% |
| Aberdeen | 37,414 | 43,987 | 18% |
| Newark, DE | 6,776 | 14,682 | 117% |
| Wilmington | 712,219 | 737,846 | 4% |
| Philadelphia 30th Street | 3,555,646 | 4,068,540 | 14% |
| North Philadelphia | 605 | 294 | -51% |
| Cornwells Heights | 12,558 | 3,580 | -71% |
| Trenton | 436,058 | 419,446 | -4% |
| Princeton Junction | 65,679 | 40,947 | -38% |
| New Brunswick | 7,882 | 8,470 | 7% |
| Metropark | 362,355 | 393,713 | 9% |
| Newark Liberty | 96,382 | 126,705 | 31% |
| Newark Penn Station | 609,184 | 680,803 | 12% |
| Penn Station New York | 7,546,208 | 9,493,414 | 26% |
| New Rochelle | 75,439 | 84,777 | 12% |
| Stamford | 300,680 | 393,703 | 31% |
| Bridgeport | 62,374 | 84,446 | 35% |
| New Haven | 631,596 | 755,669 | 20% |
| Wallingford | 11,342 | 18,148 | 60% |
| Meriden | 30,202 | 34,483 | 14% |
| Old Saybrook | 57,325 | 65,315 | 14% |
| New London | 150,455 | 173,003 | 15% |
| Mystic | 15,422 | 25,983 | 68% |
| Berlin | 23,348 | 24,108 | 3% |
| Hartford | 150,272 | 179,536 | 19% |
| Windsor | 9,627 | 11,713 | 22% |
| Windsor Locks | 11,973 | 18,491 | 54% |
| Springfield | 112,465 | 143,605 | 28% |
| Westerly | 32,178 | 42,023 | 31% |
| Kingston | 135,796 | 162,837 | 20% |
| Providence | 512,974 | 669,576 | 31% |
| Route 128 | 312,113 | 444,058 | 42% |
| Back Bay | 298,340 | 528,040 | 77% |
| Boston South Station | 988,842 | 1,447,501 | 46% |
| TOTAL | 22,909,704 | 28,260,000 | 24% |
Source: Amtrak State Fact Sheets, 2006 and 2012
Regional rail service is provided by eight rail commuter rail authorities in the Study Area. Table 5-10 identifies the Regional rail operators within the Study Area, defines their geographic areas of service, and highlights trends in ridership from 2006 to 2012. Table 5-10 also illustrates the change in ridership for each Regional rail system from 2006 and 2012.
| Regional Rail Service Provider | Regional Rail System | Initials | Primary Market(s) Served | 2006 Ridership | 2012 Ridership | 2006-2012 Percentage Growth |
|---|---|---|---|---|---|---|
| Virginia Railway Express | Virginia Railway Express | VRE | Washington, D.C. | 3,569,664 | 4,702,196 | 31.7 |
| Maryland Transit Administration | Maryland Area Regional Commuter | MARC | Baltimore, Washington, D.C. | 7,274,762 | 8,532,214 | 17 |
| Southeastern Pennsylvania Transportation Authority | SEPTA Regional rail | SEPTA | Greater Philadelphia, Wilmington, Trenton | 34,150,997 | 36,899,167 | 8 |
| NJ TRANSIT Corporation | NJ TRANSIT Rail | NJT | New York City, Mid-Hudson Valley, Newark, Northwestern New Jersey, Trenton | 75,394,695 | 81,353,894 | 8 |
| Metropolitan Transportation Authority | MTA-Metro-North Railroad | MNR | New York City, Lower- and Mid-Hudson Valley, Stamford, Bridgeport, New Haven | 76,527,572 | 82,807,689 | 8 |
| MTA-Long Island Rail Road | LIRR | New York City, Long Island | 99,520,000 | 96,986,120 | -3 | |
| Connecticut Department of Transportation | Shore Line East | SLE | New London, Old Saybrook, New Haven | 445,564 | 624,172 | 40 |
| Massachusetts Bay Transportation Authority | MBTA Commuter Rail | MBTA | Greater Boston Area | 37,797,601 | 36,083,946 | -4.5 |
| TOTALS | 334,680,855 | 347,956,398 | 4.0 | |||
Source: Federal Transit Administration, National Transit Database, Transit Agency Information, Agency Profiles
These Regional rail operators provide service to most of the Amtrak stations on the NEC. There currently is no Regional rail service on the Hartford Line route, but new service between New Haven, Hartford, and Springfield is scheduled to open in 2016, and will serve all current Amtrak stations between New Haven and Springfield. MTA-Metro-North Railroad serves several stations on the Empire Corridor, and SEPTA serves Ardmore and Paoli, PA, on the Keystone Corridor. VRE serves Amtrak stations between Manassas, VA, and Washington, D.C., and between Fredericksburg, VA, and Washington, D.C. Ridership figures for the Regional rail systems in Table 5-10 include all passenger rail operations, including services that do not operate on the NEC or on other shared Intercity passenger routes.
Figure 5-4 identifies the Regional rail market in the Study Area to highlight the market share for the Regional rail service providers and the change in use from 2006 to 2012.
Figure 5-4 : Regional Rail Ridership (2006 - 2012)
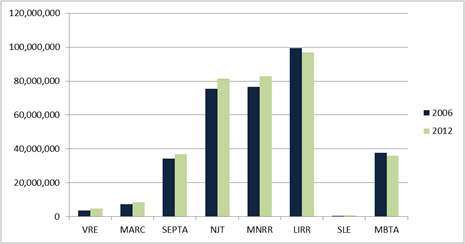
Source: Federal Transit Administration, National Transit Database, Transit Agency Information, Agency Profiles
In addition to providing metropolitan-area and state-based rail services, Amtrak, SEPTA, and MBTA provide specific services under contract within the Study Area. The Delaware Department of Transportation provides funding to Amtrak and to SEPTA to operate a portion of the passenger rail services within the state. The Rhode Island Department of Transportation provides funding to MBTA to operate service to Providence and south to Wickford Junction. Amtrak operates Shore Line East service in southeastern Connecticut under contract with the Connecticut Department of Transportation.
Figure 5-5: Regional Rail Annual Passengers (2000-2012)
Source: Federal Transit Administration, National Transit Database, data years 2000-2012, http://www.ntdprogram.gov/ntdprogram/
In addition to passengers, the rail network is essential to the goods movement system in the Northeast, especially in the Washington, D.C., Baltimore, Delaware, and Philadelphia markets. Presently, much of the NEC and connecting corridors18 in the Study Area has both freight and passenger rail operations. The only portions of the NEC not shared with freight carriers are between the Philadelphia Interlocking and North Philadelphia on the southern and northern sides of the Philadelphia 30th Street Station area in Pennsylvania; in the area west of Penn Station New York, including the Hudson River Tunnels through Penn Station New York to Queens County, NY; and between Readville Station and Boston South Station.
Shared rail corridors can represent operating challenges to the passenger rail network, with potential disruptions if freight trains derail or need to transport wide loads. Both freight and passenger rail can be challenged by limited hours of availability, trackage rights agreements, and other restrictions required in order to accommodate both freight and passenger service on shared rail corridors.
Table 5-11 shows how freight is moved in the FHWA's Freight Analysis Framework (FAF3) Zones of the Study Area. While most freight movement occurs by truck in the Study Area, 5.2 percent of all freight movements occur on rail. Freight movement is measured by the kiloton; a kiloton is defined as a unit of weight equal to 1,000 tons. Major commodities moved by rail in the Study Area zones in 2012 include coal (56 percent of total tonnage), chemicals (9.7 percent of total tonnage), and food and agricultural products (7.9 percent of tonnage).
| Movement by Kilotons | Percentage of Total by Metropolitan Area | |||||
|---|---|---|---|---|---|---|
| Truck | Rail | Other | Truck | Rail | Other | |
| Washington CSA | 231,013 | 10,172 | 22,050 | 87.8 | 3.86 | 8.38 |
| Baltimore MSA | 186,576 | 19,621 | 12,908 | 85.2 | 8.96 | 5.89 |
| Delaware | 65,586 | 5,374 | 29,421 | 65.3 | 5.35 | 29.31 |
| Philadelphia CSA | 367,673 | 25,031 | 114,420 | 72.5 | 4.94 | 22.56 |
| New York City CSA | 936,625 | 26,506 | 174,419 | 82.3 | 2.33 | 15.33 |
| Connecticut | 12,887 | 338 | 1,305 | 88.7 | 2.33 | 8.98 |
| Hartford CSA | 67,230 | 516 | 3,077 | 94.9 | 0.73 | 4.34 |
| Rhode Island | 45,189 | 334 | 3,830 | 91.6 | 0.68 | 7.76 |
| Massachusetts | 64,644 | 1,762 | 2,157 | 94.3 | 2.57 | 3.15 |
| Boston | 292,637 | 4,412 | 31,493 | 89.1 | 1.34 | 9.59 |
| NEC-NEC movement | 922,438 | 4,307 | 118,061 | |||
| TOTAL | 1,347,622 | 89,760 | 277,017 | |||
| Percentage of Total | 78.6 | 5.2 | 16.2 | |||
Source: Federal Highway Administration, Freight Analysis Framework 3 data, http://www.ops.fhwa.dot.gov/freight/freight_analysis/faf/faf3/netwkdbflow/
The FHWA estimates that within the zones that comprise the Study Area, goods movement are expected to grow by 128 percent by 2040.19 Table 5-12 shows the modal split for these goods by tonnage in 2011 and 2040. The FHWA estimates that by 2040, rail freight will experience a 66 percent increase in tonnage. As demand for freight movement by truck grows, the opportunity to shift to rail could increase should highway congestion worsen. Increased demand for rail freight movements could result in increased rail freight traveling along the NEC, creating additional pressure on operators to provide timely, reliable service and further stressing the capacity-constrained rail infrastructure.
| Mode | Kilotons 2011 |
Kilotons 2040 Estimate |
2011-2040 Percentage Growth | 2011 Percentage Mode Share |
2040 Percentage Mode Share |
|---|---|---|---|---|---|
| Air (include truck-air) | 1,167 | 3,570 | 206% | 0.1% | 0.1% |
| Multiple modes & mail | 59,869 | 148,201 | 148% | 3.5% | 3.8% |
| Other and Unknown | 25,263 | 60,592 | 140% | 1.5% | 1.5% |
| Pipeline | 137,089 | 186,039 | 36% | 8.0% | 4.8% |
| Rail | 89,760 | 149,235 | 66% | 5.2% | 3.8% |
| Truck | 1,347,622 | 3,257,680 | 142% | 78.6% | 83.3% |
| Water | 53,629 | 105,383 | 97% | 3.1% | 2.7% |
| TOTAL | 1,714,400 | 3,910,701 | 128% | 100.0 | 100.0 |
Source: Federal Highway Administration, Freight Analysis Framework 3 data, http://www.ops.fhwa.dot.gov/freight/freight_analysis/faf/faf3/netwkdbflow/
This section describes the transportation effects - both the positive and negative impacts on the multimodal transportation network within the Study Area - related to the No Action and Action Alternatives. The analysis considers how the introduction of new and improved passenger rail services results in impacts to mode choice. By changing the speed, frequency, and availability of passenger rail service, the Action Alternatives drive an important shift in travel to passenger rail. Under all Action Alternatives, passengers in 2040 would travel differently since travel choices would include quicker, more convenient passenger rail options compared to both today and the No Action Alternative. The transportation effects of the Action Alternatives compared to the No Action Alternative result from a railroad that operates more frequently, more reliably, provides new and improved passenger connections, and improves the user experience.
Quicker, more-convenient passenger rail options in the Action Alternatives would change how passengers travel.
The transportation effects of the No Action and Action Alternatives are described for the Study Area as a whole (in the corridor-wide analysis) and for the passenger rail stations and representative station-pairs (in the stations analysis).
The corridor-wide analysis, as described in Section 5.1, Methodology, focuses on transportation between metropolitan areas. It compares travel conditions that would occur for passenger travel by highway and roadways, aviation, and passenger rail, and considers the shifting of travel between modes for states and metropolitan areas in the Study Area. The corridor-wide analysis also considers how the Action Alternatives preserve the operation of freight service.
The station analysis focuses on how the Action Alternatives create new and expanded travel choices as train frequency and travel time improve by 2040 and how new travel connections are created at both new and existing stations with expanded expand duration of daily train service at most stations. Depending on the alternative, a range of potential impacts occur at stations, from slightly improved service to significant change in the frequency and anticipated demand for service.
As noted in Section 5.1, Methodology, the stations analysis consists of the following:
The NEC FUTURE Travel Demand Model predicts that the Action Alternatives would change how travelers select their mode of travel in 2040. Table 5-13 and Table 5-14 present annual trips by mode for the No Action and Action Alternatives within the Study Area for 2040. As improvements are made to passenger rail service, tripmaking on both Intercity and Regional rail grow as the share of highway, intercity bus, and aviation travel declines.
| Mode | No Action Alternative | Alternative 1 | Change vs. No Action (%) | Alternative 2 | Change vs. No Action (%) | Alternative 3 (average) | Change vs. No Action (%) |
|---|---|---|---|---|---|---|---|
| Intercity rail | 19,300 | 33,700 | 75% | 37,100 | 92% | 39,000 | 102% |
| Regional rail | 419,800 | 474,500 | 13% | 495,400 | 18% | 545,500 | 30% |
| Highway | 516,700 | 509,300 | -1% | 507,400 | -2% | 506,500 | -2% |
| Air | 23,000 | 21,900 | -5% | 21,600 | -6% | 21,200 | -8% |
| Bus | 20,500 | 19,400 | -6% | 19,100 | -7% | 18,900 | -8% |
Source: NEC FUTURE Travel Demand Model, 2015
| Mode | via Central CT/ Providence (3.1) |
via Long Island/ Providence (3.2) |
via Long Island/ Worcester (3.3) |
via Central CT/ Worcester (3.4) |
|---|---|---|---|---|
| Intercity rail | 38,900 | 38,700 | 39,800 | 38,600 |
| Regional rail | 545,500 | 545,500 | 545,500 | 545,500 |
| Highway | 506,600 | 506,700 | 506,300 | 506,900 |
| Air | 21,200 | 21,200 | 21,200 | 21,300 |
| Bus | 19,000 | 19,040 | 18,900 | 19,000 |
| TOTAL | 1,131,200 | 1,131,100 | 1,131,700 | 1,131,300 |
Source: NEC FUTURE Travel Demand Model, 2015
The Action Alternatives would affect the mix of travel by mode as Intercity and Regional rail shares grow for each Action Alternative. As the frequency, speed, and geographic reach of the Action Alternatives increase, forecasting models predict tripmaking would occur by rail at a greater rate compared to the No Action Alternative. Intercity bus travel, which often functions as a lower-cost alternative to Intercity rail in the Study Area, loses its market share to Intercity rail for all of the Action Alternatives compared to the No Action Alternative. Table 5-13 and Table 5-14 identify annual tripmaking by mode for the Action Alternatives compared to the No Action Alternative, highlighting how passenger rail travel increases as service becomes more convenient and passengers shift to rail from other modes.
As presented in Table 5-13 and Table 5-14, Intercity ridership increases in Alternatives 1, 2, and 3, compared to the No Action Alternative.
Regional rail ridership also shows steady gains in all Action Alternatives compared to the No Action Alternative, as capacity grows to support more robust peak-hour and off-peak service. This growth reflects both the dominance of the total Regional travel market and the importance of capacity for future growth. The new track and new segments associated with Alternatives 1 and 2 would add capacity along the existing NEC. With the addition of a second spine, Alternative 3 would create significant additional capacity for Regional rail trips in the more constrained areas of the NEC, particularly in New Jersey, New York, and Connecticut.
The Action Alternatives would change the share of travel by mode between metropolitan areas in the Study Area, compared to the No Action Alternative. The Action Alternatives introduce passenger rail service types that improve travel time and expand the frequency of rail service between markets, improving the competitiveness of rail compared to other modes.
Table 5-15 presents the passenger rail trips in 2040 for the No Action and the Action Alternatives. Passenger rail trips for the No Action Alternative are presented as the total number, while passenger rail trips for the Action Alternatives are presented as the difference from the No Action Alternative. The data indicate that passenger rail trips would increase for all of the Metropolitan Area pairs. Similarly, the total number of trips for auto, air, and bus would decrease, indicating that the Action Alternatives would result in a mode shift from all three of these modes to rail.
The New York/North Jersey-Boston metropolitan pair would have the largest increase in rail trips, with most of the increase attributed to Intercity-Corridor tripmaking. The Washington, D.C.-New York/North Jersey and New York/North Jersey-Hartford, and Philadelphia-New York/North Jersey metropolitan pairs would be the next highest. For all three of these pairs, Intercity-Corridor trips would account for much of this increase as the use of the Metropolitan service concept expands as part of the Action Alternatives. Particularly, for New York/North Jersey-Hartford and Philadelphia-New York/North Jersey, Intercity-Corridor trips would account for approximately 80 to 90 percent of this increase. For the Washington, D.C.-New York/North Jersey metropolitan area pair, Intercity-Corridor trips would account for approximately 70 percent of all rail trips. (See Appendix B, Ridership Technical Memorandum.)
| Metropolitan Area Pairs | No Action Alternative | Action Alternatives | |||||
|---|---|---|---|---|---|---|---|
| Alt. 1 | % Change vs. No Action | Alt. 2 | % Change vs. No Action | Alt. 3 (Range) |
% Change vs. No Action | ||
| Washington, D.C.-Baltimore | 246,100 | 364,200 | 48 | 378,400 | 54 | 371,600-374,400 | 51-52 |
| Washington, D.C.-New York/North Jersey | 1,989,200 | 2,884,000 | 45 | 3,066,100 | 54 | 3,143,200-3,381,000 | 58-70 |
| Washington, D.C.-Boston | 42,100 | 133,600 | 217 | 169,600 | 303 | 206,700-237,200 | 391-463 |
| Philadelphia-New York/North Jersey | 1,641,600 | 2,404,100 | 46 | 2,596,400 | 58 | 2,594,200-2,783,500 | 58-70 |
| New York/North Jersey-Hartford | 390,800 | 1,229,300 | 215 | 1,285,000 | 229 | 1,384,200-1,435,000 | 254-267 |
| New York/North Jersey-Boston | 1,227,000 | 2,341,700 | 91 | 2,706,300 | 121 | 3,026,000-3,216,600 | 147-162 |
| Hartford-Providence | 14,600 | 28,600 | 96 | 51,600 | 253 | 33,900-50,400 | 132-245 |
| Hartford-Boston | 42,500 | 85,700 | 102 | 143,700 | 238 | 142,200-151,500 | 234-256 |
Source: NEC FUTURE Travel Demand Model, 2015
In addition to preserving current service levels for freight railroads, the FRA considered opportunities to accommodate the future growth and improvement of freight rail service within the NEC FUTURE Study Area as part of the investments made to enhance passenger capacity. Representative freight opportunities considered in the development and analysis of the NEC FUTURE Action Alternatives included:
The FRA evaluated each Action Alternative to assess its ability to preserve today's freight service levels, protect future freight service opportunities, and not preclude future investment initiatives aimed at growing freight rail service.
Each of the Action Alternatives would preserve the future opportunity to create a dedicated north-south high-clearance, high-density freight line, which remains a long-term goal of Northeast transportation planners. Alternative 3 would do the most in terms of providing new rail infrastructure that can be used by freight trains in portions of the corridor in Maryland, and freeing up the existing NEC for increased freight service in southeastern Connecticut and Rhode Island. Also, the Action Alternatives would remove Intercity-Express trains from local tracks in many areas, creating potential opportunities for increased sharing of these tracks by Regional rail and freight trains during non-peak periods. Freight rail operations would generally be incompatible with high-speed (160 to 220 mph) passenger rail operations, and therefore would not operate on the new second spine.
In 2040, connectivity at the representative stations would depend on a variety of factors, including future Intercity service, future Regional rail service, and the future of public transit and intercity bus travel at each station as part of the overall transportation network connectivity. Cities without rail-based public transit may have new systems by 2040; stations without public transit service or intercity bus service may be connected to such networks by 2040.
Many of the stations served today by Intercity and Regional rail face capacity constraints during peak hours, when platforms, waiting areas and parking areas may be overcrowded and inadequate for existing and future growth. As service levels and ridership increase under the No Action Alternative, most stations would see a degradation in station operations and functionality in the absence of improvements to expand capacity and access.
The changes in connectivity that result from of the Action Alternatives are measured in three categories:
Frequency
With increased frequency, more daily trains would be available at existing stations, along with connections to new stations. This would provide passengers with increased convenience and extend the reach of the rail system. Some stations would experience transformational gains in frequency of service, elevating the role of rail. In these transformational markets, travelers would rely more on rail as a frequent, predictable mode. For other markets, the Action Alternatives would cause some shifts from nearby stations or shifts to new or upgraded stations.
Figure 5-6 identifies the number of Intercity trains that would be available per day at the representative stations for the No Action and Action Alternatives. For Alternative 3, the number of trains per day is based upon the maximum potential service of the four route options.
Figure 5-6 : Intercity Trains Per Day by Representative Station for the No Action and Action Alternatives (2040)
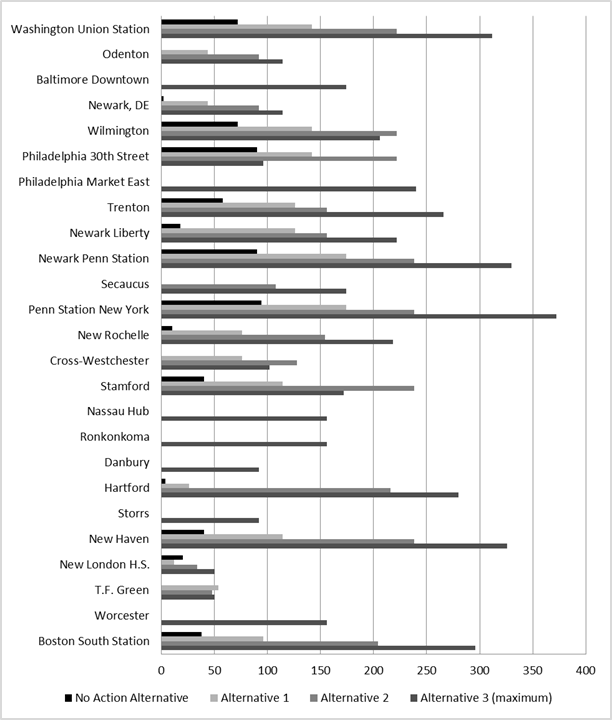
Source: NEC FUTURE team, 2015
Some representative stations that are not served in the No Action Alternative would experience a jump to larger amounts of daily Intercity service in Alternative 1, such as Odenton, Cross-Westchester, and T. F. Green. At Secaucus there would be no Intercity trains in the No Action Alternative and Alternative 1, but trains would be available as part of Alternatives 2 and 3, as the investments in infrastructure make service feasible there. For other stations, including the new Intercity stations proposed for Baltimore (Baltimore Downtown) and Philadelphia (Philadelphia Market East), Nassau Hub, Ronkonkoma, Danbury, Storrs, and Worcester, there would be no service for one or both service types in the No Action Alternative, and these services would be available in some or all of the Alternative 3 route options.
For other representative stations, including Washington Union Station, Newark, DE, Philadelphia 30th Street Station, Newark Penn Station, Hartford, and Boston South Station, the number of daily trains of each service type would increase from the No Action Alternative for all Action Alternatives, with the highest number of daily trains in Alternative 3 . However, some Alternative 3 route options would include volumes that are lower than other Action Alternatives. For example, Ronkonkoma is an existing station that would experience significantly changed use with the introduction of Intercity service in Alternative 3, which would provide 34 daily Intercity-Express trains. Similarly, markets that add a second station, such as Baltimore and Philadelphia, existing stations would have reduced service in Alternative 3 as new services are introduced at new downtown stations.
Access to new markets is important for passengers and is provided in both Alternatives 2 and 3. Alternative 2 includes new segments from New Haven to Hartford and then to Providence, connecting through new stations in Meriden, CT, and at Willimantic/Storrs/Tolland, CT (the University of Connecticut). A new segment would also be created farther south directly linking the NEC to a new station at Philadelphia International Airport.
Alternative 3 adds more new stations through the introduction of a second spine. South of Penn Station New York, Alternative 3 adds new stations at Downtown Baltimore, Philadelphia International Airport, and at Philadelphia Market East, an existing Regional rail station. North of Penn Station New York, Alternative 3 offers four route options. The route options serving Central Connecticut would have new stations at White Plains, NY, and Danbury and Waterbury, CT, with a new station at Storrs, CT, for the route option via Providence, RI. The Long Island route options would serve new stations at Jamaica, Nassau Hub, Suffolk, and Ronkonkoma, NY, with a new station at Worcester, MA, for the route option via Worcester.
Table 5-16 identifies the Action Alternative under which each representative station has the highest frequency of daily Intercity trains.
| Representative Station | Alternative with Highest Intercity Frequency | Representative Station | Alternative with Highest Intercity Frequency |
|---|---|---|---|
| Washington Union Station | 3 | Cross-Westchester | 2 |
| Odenton | 3 | Stamford | 2 |
| Baltimore Downtown | 3 | Nassau Hub | 3 |
| Newark, DE | 3 | Ronkonkoma | 3 |
| Wilmington | 2 | Danbury | 3 |
| Philadelphia 30th Street | 2 | Hartford | 3 |
| Philadelphia Market East | 3 | Storrs | 3 |
| Trenton | 3 | New Haven | 3 |
| Newark Liberty | 3 | New London | 3 |
| Newark Penn Station | 3 | T.F. Green | 1 |
| Secaucus | 3 | Worcester | 3 |
| Penn Station New York | 3 | Boston South Station | 3 |
| New Rochelle | 3 |
Source: NEC FUTURE Service Model Output, 2015
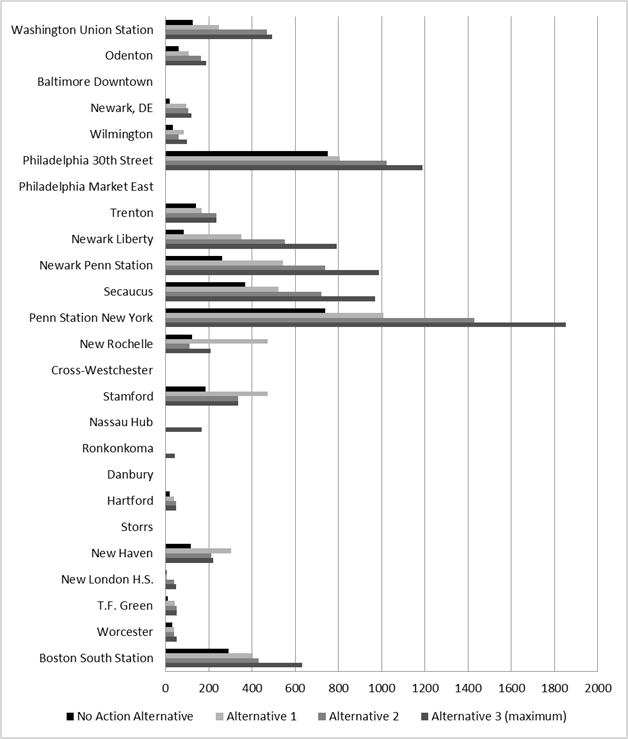
In addition to changes in the frequency of Intercity service at the representative stations, the No Action and Action Alternatives would also result in additional Regional rail service. Figure 5-7 highlights the changes in the frequency of Regional rail service at the representative stations. Appendix C includes a complete list of Regional rail trains per day for the representative stations.
Service Type Changes
The Action Alternatives would introduce Intercity service at some stations that do not currently have Intercity service, and would allow for expanded service at many stations with Intercity service. Most stations would also see an increase in the amount of Regional rail service as the expanded infrastructure and service changes provide greater capacity for both rail services. Other stations would not see service changes in some alternatives.
Many stations would see their service expanded in all of the Action Alternatives compared to the No Action Alternative for both Intercity and Regional rail, including Washington, D.C., Wilmington, Philadelphia 30th Street Station, Trenton, Penn Station New York, Stamford, Hartford, New Haven, and Boston. These stations have existing Intercity and Regional rail services that will improve in each of the Action Alternatives providing better service for more passengers.
Table 5-17 identifies the changes in service types at the representative stations. The tables highlight how the Action Alternatives expand (↑), reduce (↓), or result in no change. New services and locations where service would not be provided are also indicated.
Figure 5-7 : Regional Rail Frequency by Representative Station for the No Action and Action Alternatives (2040)
Source: NEC FUTURE team, 2015
| Station and Service Type | Alternative 1 | Alternative 2 | Alternative 3 | |||
|---|---|---|---|---|---|---|
| via Central CT/ Providence (3.1) | via Long Island/ Providence (3.2) | via Long Island/ Worcester (3.3) | via Central CT/ Worcester (3.4) | |||
| Washington Union Station | ||||||
| Intercity | ↑ | ↑ | ↑ | ↑ | ↑ | ↑ |
| Regional rail | ↑ | ↑ | ↑ | ↑ | ↑ | ↑ |
| Odenton | ||||||
| Intercity | New | New | New | New | New | New |
| Regional rail | ↑ | ↑ | ↑ | ↑ | ↑ | ↑ |
| Baltimore | ||||||
| Intercity | ↑ | ↑ | ↑ | ↑ | ↑ | ↑ |
| Regional rail | ↑ | ↑ | ↑ | ↑ | ↑ | ↑ |
| Newark, DE | ||||||
| Intercity | ↑ | ↑ | ↑ | ↑ | ↑ | ↑ |
| Regional rail | ↑ | ↑ | ↑ | ↑ | ↑ | ↑ |
| Wilmington | ||||||
| Intercity | ↑ | ↑ | ↑ | ↑ | ↑ | ↑ |
| Regional rail | ↑ | ↑ | ↑ | ↑ | ↑ | ↑ |
| Philadelphia | ||||||
| Intercity | ↑ | ↑ | ↑ | ↑ | ↑ | ↑ |
| Regional rail | ↑ | ↑ | ↑ | ↑ | ↑ | ↑ |
| Trenton | ||||||
| Intercity | ↑ | ↑ | ↑ | ↑ | ↑ | ↑ |
| Regional rail | ↑ | ↑ | ↑ | ↑ | ↑ | ↑ |
| Newark Liberty | ||||||
| Intercity | ↑ | ↑ | ↑ | ↑ | ↑ | ↑ |
| Regional rail | ↑ | ↑ | ↑ | ↑ | ↑ | ↑ |
| Newark Penn Station | ||||||
| Intercity | ↑ | ↑ | ↑ | ↑ | ↑ | ↑ |
| Regional rail | ↑ | ↑ | ↑ | ↑ | ↑ | ↑ |
| Secaucus | ||||||
| Intercity | None | New | New | New | New | New |
| Regional rail | ↑ | ↑ | ↑ | ↑ | ↑ | ↑ |
| Penn Station New York | ||||||
| Intercity | ↑ | ↑ | ↑ | ↑ | ↑ | ↑ |
| Regional rail | ↑ | ↑ | ↑ | ↑ | ↑ | ↑ |
| New Rochelle | ||||||
| Intercity | ↑ | ↑ | ↑ | ↑ | ↑ | ↑ |
| Regional rail | ↑ | ↑ | ↑ | ↓ | ↓ | ↑ |
| Cross-Westchester | ||||||
| Intercity | New | New | New | New | New | New |
| Regional rail | None | None | None | None | None | None |
| Stamford | ||||||
| Intercity | ↑ | ↑ | ↑ | ↑ | ↑ | ↑ |
| Regional rail | ↑ | ↑ | ↑ | ↑ | ↑ | ↑ |
| Nassau Hub | ||||||
| Intercity | None | None | None | New | New | None |
| Regional rail | None | None | None | New | New | None |
| Ronkonkoma | ||||||
| Intercity | None | None | None | New | New | None |
| Regional rail | ↑ | ↑ | ↑ | ↑ | ↑ | ↑ |
| Danbury | ||||||
| Intercity | None | None | New | None | None | New |
| Regional rail | ◯ | ◯ | ◯ | ◯ | ◯ | ◯ |
| New Haven | ||||||
| Intercity | ↑ | ↑ | ↑ | ↑ | ↑ | ↑ |
| Regional rail | ↑ | ↑ | ↑ | ↑ | ↑ | ↑ |
| Hartford | ||||||
| Intercity | ↑ | ↑ | ↑ | ↑ | ↑ | ↑ |
| Regional rail | ↑ | ↑ | ↑ | ↑ | ↑ | ↑ |
| Tolland/Storrs | ||||||
| Intercity | None | None | None | None | New | New |
| Regional rail | None | None | None | None | None | None |
| New London | ||||||
| Intercity | ↑ | ↑ | ↑ | ↑ | ↑ | ↑ |
| Regional rail | ↑ | ↑ | ↑ | ↑ | ↑ | ↑ |
| T.F. Green | ||||||
| Intercity | New | New | New | New | New | New |
| Regional rail | ↑ | ↑ | ↑ | ↑ | ↑ | ↑ |
| Worcester | ||||||
| Intercity | ◯ | ◯ | ◯ | ◯ | New | New |
| Regional rail | ↑ | ↑ | ↑ | ↑ | ↑ | ↑ |
| Boston South Station | ||||||
| Intercity | ↑ | ↑ | ↑ | ↑ | ↑ | ↑ |
| Regional rail | ↑ | ↑ | ↑ | ↑ | ↑ | ↑ |
Source: NEC FUTURE Service Model Output, 2015
Notes:
Philadelphia includes Philadelphia 30th Street Station and Philadelphia Market East.
Baltimore includes Baltimore Penn Station and Baltimore Downtown.
Expands = (↑); Reduces = (↓ ); Eliminates = (X); No Change = (◯); New = new service; None = No service
Integrated Passenger Rail Operations Opportunities
Several different owners and operators share responsibility for passenger rail services along the NEC. As described in Chapter 3, Purpose and Need, these operators adhere to different service requirements, leading to decreased connectivity and reliability for services requiring more than one passenger rail operator. The Action Alternatives represent an opportunity to increase the integration of rail services by expanding the frequency of service and availability of regional connections. Integrated passenger rail operations would also result in opportunities to match services and schedules of one service type with another. The Action Alternatives assume more frequent service, reducing the need for travelers to consult a schedule, which would result in a more seamless passenger travel experience.
While the changes in connectivity related to public transit and intercity bus networks are not estimated within the No Action and Action Alternatives, the presence of services today and the estimated changes in Intercity and Regional rail within the Action Alternatives can be used to estimate the ease of integrating passenger rail services with other existing transportation services at each station.
Chapter 4, Alternatives Considered, contains a listing of chokepoint relief projects, new track, and new segments for each of the Action Alternatives. The reduction of infrastructure constraints and significant improvement in system reliability create opportunities for better integrated passenger operations.
The Action Alternatives would result in opportunities to:
In 2040, future performance of rail services at the representative stations would depend on a variety of factors, including travel speeds and trip times, the frequency of Intercity service, and the changes in service types for trips between stations. The Action Alternatives expand the linkages between markets across the Study Area by increasing Intercity train service frequency, connecting to new markets not served in the No Action Alternative, and by making travel more convenient by reducing travel times with increased travel speed. The new infrastructure that allows for expanded Intercity services also provides opportunities to expand the frequency of Regional rail services at many stations and provide new connections between stations and markets. In many instances the Action Alternatives result in direct (one-seat ride) service for trips that require transfers today. Finally, the Action Alternatives also introduce new rail markets to the passenger rail network, resulting in expanded access.
The FRA has selected 17 representative station-pairs to evaluate how the Action Alternatives affect travel between stations. The 17 representative station-pairs were selected from the representative stations to reflect the diversity of new and expanded tripmaking created by the Action Alternatives. Station-pairs represent combinations of geographies, anticipated levels of rail service, and existing level of passenger rail integration, including new stations considered only under Alternative 3.
The evaluation of the No Action and Action Alternatives on the 17 representative station-pairs focuses on three measures of performance: travel time, frequency, and changes in service types (see Appendix C, Targeted Stations Analysis):
Travel Time
The Action Alternatives would result in savings of travel time for users of both the Intercity and the Regional rail networks. Table 5-18 shows the average travel time (hours:minutes) between representative station-pairs for the No Action and Action Alternatives. Alternative 3 offers the fastest travel between most of the representative station-pairs.
Alternative 1 would improve travel times for several representative station-pairs, although in many cases the fastest Intercity-Express travel times would remain the same as the No Action Alternative, for example between Washington Union Station and Philadelphia and between Penn Station New York and Baltimore. Alternative 1 would offer Intercity-Corridor service between Odenton, MD, and Philadelphia in just under 1 hour 40 minutes, but more importantly represents a direct Intercity rail trip that is not possible in the No Action Alternative.
Alternative 2 would improve travel times between all of the representative station-pairs for both Intercity-Express and Intercity-Corridor travel compared to the No Action Alternative. The Intercity-Express travel times between Washington Union Station and Boston, MA is nearly 1 hour 30 minutes better than the No Action Alternative and travel between Philadelphia and New York would take less than one hour. Beyond improvements between these representative station-pairs. Alternative 2 would provide Intercity-Corridor service to Secaucus, NJ; service that is not available with the No Action Alternative.
| Station 1 | Station 2 | No Action | Alternative 1 | Alternative 2 | Alternative 3* | ||||
|---|---|---|---|---|---|---|---|---|---|
| Express | Corridor | Express | Corridor | Express | Corridor | Express | Corridor | ||
| Washington Union Station | Philadelphia | 1:37 | 1:55 | 1:37 | 1:49 | 1:29 | 1:46 | 1:04 | 1:39 |
| Washington Union Station | Penn Station New York | 2:47 | 3:23 | 2:43 | 3:08 | 2:26 | 3:01 | 1:48 | 2:51 |
| Washington Union Station | Boston | 6:33 | 8:02 | 5:45 | 6:57 | 5:07 | 6:22 | 3:57 | 5:47 |
| Washington Union Station | Newark, DE | 1:24 | 1:25 | 1:19 | 1:11 | ||||
| Philadelphia | Odenton | 1:39 | 1:32 | 1:22 | |||||
| Penn Station New York | Baltimore | 2:11 | 2:39 | 2:11 | 2:30 | 1:56 | 2:24 | 1:29 | 2:16 |
| Penn Station New York | Wilmington | 1:28 | 1:49 | 1:28 | 1:41 | 1:15 | 1:37 | 1:08 | 1:31 |
| Ronkonkoma | Baltimore | 1:58 | 2:56 | ||||||
| Penn Station New York | Philadelphia | 1:07 | 1:23 | 1:04 | 1:18 | 0:55 | 1:11 | 0:43 | 1:10 |
| Boston | Philadelphia | 4:53 | 6:00 | 4:06 | 4:59 | 3:36 | 4:24 | 2:52 | 4:14 |
| Nassau Hub | Trenton | 1:11 | |||||||
| Danbury | Newark Penn Station | 1:01 | |||||||
| New Haven Station | Newark Penn Station | 1:59 | 2:16 | 1:36 | 1:43 | 1:24 | 1:34 | 1:14 | 1:31 |
| Stamford | Secaucus | 0:51 | 0:53 | ||||||
| Boston | Penn Station New York | 3:31 | 4:13 | 2:54 | 3:34 | 2:33 | 3:15 | 2:01 | 2:45 |
| Hartford | Ronkonkoma | 0:39 | 0:42 | ||||||
| Boston | Storrs | 0:49 | |||||||
Source: NEC FUTURE team, 2015
Notes:
Philadelphia includes Philadelphia 30th Street Station and Philadelphia Market East.
Baltimore includes Baltimore Penn Station and Baltimore Downtown.
Boston includes Boston Back Bay and South Station.
* Average for Alternative 3 route options with service between station-pairs
Blank cell = No service
Compared to the No Action Alternative, Alternative 3 would improve travel times between all of the representative station-pairs. Intercity-Express travel times between Boston and Philadelphia would be just under 3 hours and nearly 2 hours faster than the No Action Alternative. Intercity-Express travel between Washington Union Station and Boston would decrease by 40 percent via Intercity-Express and 28 percent via Intercity-Corridor compared to the No Action Alternative. These improved travel times would make Intercity roundtrip travel for some representative station-pairs possible within a day. Travel times between markets not served by the No Action Alternative such as Danbury and Ronkonkoma would have service at competitive travel times. The best Intercity-Express travel times Ronkonkoma and Baltimore would be just under two hours; opening up new travel opportunities that are not served by Intercity rail in the No Action Alternative. Similarly, Intercity-Express service between Newark Penn Station and Danbury, another station-pair that is not served in the No Action Alternative, would take just over an hour.
For the Regional rail network, the Action Alternatives would result in travel time savings for Regional rail users who would benefit from the improvements envisioned as part of NEC FUTURE. Upgrades to the passenger rail network that create travel time savings include the elimination of chokepoints, upgraded tracks, improve reliability, increased capacity, and other benefits resulting from achieving a state of good repair. The FRA estimated the overall Study Area travel time savings for users of the Regional rail network would range from 6 minutes per Regional rail trip under Alternative 1 to up to 11 minutes per Regional rail trip under Alternative 3 for each user. (See Appendix B, Ridership Technical Memorandum.)
Frequency
Table 5-19 shows the number of trains per day in one direction between representative station-pairs for the No Action and Action Alternatives. The number of trains per day between stations pairs represents the number of options that passenger rail travelers have for these specific city-pair journeys. The more trips that are offered during the day, the more options a passenger has to make that journey and the more convenient rail becomes. All of the Action Alternatives increase the number of trips per day offered between the representative station-pairs compared to the No Action Alternative.
As an example of the changes offered by the Action Alternatives, the Washington Union Station-Boston South Station station-pair has 10 Intercity-Express and 8 Intercity-Corridor trips as part of the No Action Alternative. The frequency of trains would increase to 16 and 24 trains in Alternative 1, 27 and 30 in Alternative 2, and 60 and 45 trips for Alternative 3 based on the route option. Alternative 3 represents a nearly five-fold increase in service between Washington Union Station and Boston South Station. This pattern is matched for many of the representative station-pairs under Alternative 3 resulting in expanded service and more convenient travel options.
Service Type Changes
The Action Alternatives introduce Intercity service for some representative stations pairs that would not have Intercity service in the No Action Alternative. Most station-pairs would see an increase in the amount of service as the expanded infrastructure and service changes provide greater capacity for Intercity service. Some of these benefits result from the introduction of the Metropolitan service, a new service concept that offers improved service to new and intermediate markets and key transfer locations, and stops at more stations than the current Amtrak Northeast Regional service (including some stations that are served today by only Regional rail trains). The introduction of Metropolitan service, as part of the Intercity-Corridor service type, would result in improved service to new and intermediate markets. Other station-pairs would not see service changes in some Action Alternatives or may see a reduction in one type of Intercity service in exchange for a gain in the total amount of Intercity service. Table 5-20 shows how Intercity service would change for each of the representative station-pairs in each of the Action Alternatives compared to the No Action Alternative.
| Average Trains Per Day by Intercity Service Type | No Action | Alternative 1 | Alternative 2 | Alternative 3* | |||||
|---|---|---|---|---|---|---|---|---|---|
| Station 1 | Station 2 | Express | Corridor | Express | Corridor | Express | Corridor | Express | Corridor |
| Washington Union Station | Philadelphia | 16 | 22 | 24 | 46 | 41 | 69 | 74 | 80 |
| Washington Union Station | Penn Station New York | 16 | 22 | 24 | 45 | 41 | 54 | 74 | 76 |
| Washington Union Station | Boston | 10 | 8 | 16 | 24 | 27 | 30 | 60 | 45 |
| Washington Union Station | Newark, DE | — | 1 | — | 22 | — | 46 | — | 57 |
| Philadelphia | Odenton | — | — | — | 22 | — | 46 | — | 57 |
| Penn Station New York | Baltimore | 16 | 22 | 24 | 45 | 41 | 54 | 53 | 76 |
| Penn Station New York | Wilmington | 16 | 22 | 24 | 45 | 41 | 54 | 21 | 76 |
| Ronkonkoma | Baltimore | — | — | — | — | — | — | 28 | 29 |
| Penn Station New York | Philadelphia | 16 | 32 | 24 | 62 | 41 | 77 | 74 | 110 |
| Boston | Philadelphia | 10 | 8 | 16 | 26 | 27 | 45 | 60 | 50 |
| Nassau Hub | Trenton | — | — | — | — | — | — | — | 33 |
| Danbury | Newark Penn Station | — | — | — | — | — | — | — | 34 |
| New Haven Station | Newark Penn Station | 9 | 10 | 16 | 35 | 27 | 58 | 31 | 62 |
| Stamford | Secaucus | — | — | — | — | — | 47 | — | 35 |
| Boston | Penn Station New York | 10 | 9 | 19 | 28 | 42 | 50 | 75 | 72 |
| Hartford | Ronkonkoma | — | — | — | — | — | — | 32 | 44 |
| Boston | Storrs | — | — | — | — | — | — | — | 46 |
Source: NEC FUTURE team, 2015
Notes:
Philadelphia includes Philadelphia 30th Street Station and Philadelphia Market East.
Baltimore includes Baltimore Penn Station and Baltimore Downtown.
Boston includes Boston Back Bay and South Station.
* Average of Alternative 3 Route Options with service between these station-pairs.
| Station 1 | Station 2 | Alternative 1 | Alternative 2 | Alternative 3 | |||
|---|---|---|---|---|---|---|---|
| via Central CT/ Providence (3.1) |
via Long Island/ Providence (3.2) |
via Long Island/ Worcester (3.3) |
via Central CT/ Worcester (3.4) |
||||
| Washington Union Station | Philadelphia | ↑ | ↑ | ↑ | ↑ | ↑ | ↑ |
| Washington Union Station | Penn Station New York | ↑ | ↑ | ↑ | ↑ | ↑ | ↑ |
| Washington Union Station | Boston South Station | ↑ | ↑ | ↑ | ↑ | ↑ | ↑ |
| Washington Union Station | Newark, DE | ↑ | ↑ | ↑ | ↑ | ↑ | ↑ |
| Philadelphia | Odenton | New | New | New | New | New | New |
| Penn Station New York | Baltimore | ↑ | ↑ | ↑ | ↑ | ↑ | ↑ |
| Penn Station New York | Wilmington | ↑ | ↑ | ↑ | ↑ | ↑ | ↑ |
| Ronkonkoma | Baltimore | None | None | None | New | New | None |
| Penn Station New York | Philadelphia | ↑ | ↑ | ↑ | ↑ | ↑ | ↑ |
| Boston South Station | Philadelphia | ↑ | ↑ | ↑ | ↑ | ↑ | ↑ |
| Nassau Hub | Trenton | None | None | None | New | New | None |
| Danbury | Newark Penn Station | None | None | New | None | None | New |
| New Haven Station | Newark Penn Station | ↑ | ↑ | ↑ | ↑ | ↑ | ↑ |
| Stamford | Secaucus | None | New | New | New | New | New |
| Boston | Penn Station New York | ↑ | ↑ | ↑ | ↑ | ↑ | ↑ |
| Hartford | Ronkonkoma | None | None | None | New | New | None |
| Boston | Storrs | None | None | None | None | New | New |
Source: NEC FUTURE team, 2015
Notes:
Philadelphia includes Philadelphia 30th Street Station and Philadelphia Market East.
Baltimore includes Baltimore Penn Station and Baltimore Downtown.
Boston includes Boston Back Bay and South Station.
Expands = (↑ ); Reduces = (↓ ); Eliminates = (X) ; No Change = (◯); New = new service; None = no service
For both Alternatives 1 and 2, all of the representative station-pairs with service in the No Action Alternative would have an increase in the quantity of Intercity service available compared to the No Action Alternative. Alternative 1 introduces new service to one station-pair, Philadelphia 30th Street to Odenton, which is not available with the No Action Alternative. In Alternative 3, all but one of the representative station-pairs would see an increase in daily Intercity service compared to the No Action Alternative, and four city-pairs would see service that is not available in the No Action Alternative: Ronkonkoma-Baltimore, Nassau Hub-Trenton, Danbury-Newark Penn Station, and Hartford-Ronkonkoma.
Table 5-20 identifies the impact of the changes to the types of service that would be available between the representative station-pairs. The table highlights how the Action Alternatives would expand (↑), reduce (↓), eliminate (X), or result in no change (0) to the types of passenger rail service anticipated for the representative station-pairs. New services are also indicated. "None" indicates that no Intercity service would be provided at this station.
Ridership is a measure of the number of trips taken. Ridership is estimated using population demographics, employment, and the service characteristics including the travel time, frequency, and service types offered between stations. Improvements to Intercity and Regional rail such as better network connectivity, connections to new travel markets, increased trip frequency, and decreased trip times make new and expanded services more appealing and more convenient, resulting in increased estimated demand.
This section discusses the predicted ridership of Intercity service under the No Action and Action Alternatives separately from the ridership of Regional rail services. However, the mobility benefits created by NEC FUTURE are rooted both in the degree to which travel between metropolitan areas is improved and the degree to which the additional connectivity offered through Intercity connections works hand-in-hand with improved Regional rail services. As noted previously, ridership estimates are representational of the proposed Service Plans created for the No Action and Action Alternatives and are consistent with a Tier 1 Draft EIS level of detail.
Intercity
Table 5-21 shows the forecasted number of annual one-way trips between the representative station-pairs for Intercity-Express and Intercity-Corridor services for the No Action and Action Alternatives. The FRA estimates that:
Representative service plans informed the FRA's analysis of overall Regional rail market potential within selected metropolitan area.
Regional Rail
Representative service plans informed the FRA's analysis of overall Regional rail market potential. Forecast annual Regional rail travel (total linked trips) for the Action Alternatives are presented by metropolitan area. Regional rail networks include multiple branch lines and more closely spaced stations than those served by intercity rail. Forecast station-specific boardings are more appropriate for project-level assessments, which allow for more station-to-station balancing of service plans by the rail operators. Therefore, for NEC FUTURE, Regional rail ridership is presented by metropolitan area and for select screenlines to show the relative change in overall Regional rail attractiveness when compared to the No Action Alternative.
Metropolitan areas where Regional rail service is offered today were selected as representative of the changes in ridership throughout the Study Area. As presented in Table 5-22, overall Regional rail trips increase for each Action Alternative when compared to the No Action Alternative. These increases demonstrate the forecast growth in Regional travel and the attractiveness of Regional rail in meeting that demand.
For three of the Major Hub stations - Washington Union Station, Penn Station New York, and Boston South Station - relief of capacity constraints in the No Action Alternative would create opportunities for ridership growth as shown Table 5-22 and Table 5-23. Ridership estimates include all Regional trains approaching each of the Major Hub stations - from Virginia and Maryland into Washington Union Station; from New Jersey, New York, and Connecticut into Penn Station New York; and from Rhode Island and Massachusetts into Boston South Station. As noted, ridership would increase as the service frequencies increase (see Figure 5-7) and travel times decrease in each of the Action Alternatives when compared to the No Action Alternative.
| Annual One-Way Trips by Service Type by Station-Pairs | No Action | Alternative 1 | Alternative 2 | Alternative 3 (average) | |
|---|---|---|---|---|---|
| Station 1 | Station 2 | ||||
| Washington Union Station | Philadelphia | 320,500 | 358,000 | 341,600 | 379,600 |
| Washington Union Station | Penn Station New York | 1,191,700 | 1,263,300 | 1,357,300 | 1,485,700 |
| Washington Union Station | Boston | 23,200 | 65,200 | 65,700 | 88,000 |
| Washington Union Station | Newark, DE | 0 | 21,900 | 23,300 | 48,000 |
| Philadelphia | Odenton | 0 | 14,800 | 29,300 | 29,800 |
| Penn Station New York | Baltimore | 214,200 | 219,800 | 232,500 | 267,600 |
| Penn Station New York | Wilmington | 188,200 | 204,800 | 222,600 | 187,900 |
| Ronkonkoma | Baltimore | 0 | 0 | 0 | 15,028 |
| Penn Station New York | Philadelphia | 1,201,600 | 1,465,600 | 1,525,900 | 1,558,900 |
| Boston | Philadelphia | 53,600 | 121,600 | 129,000 | 164,500 |
| Nassau Hub | Trenton | 0 | 0 | 0 | 1,900 |
| Danbury | Newark Penn Station | 0 | 0 | 0 | 1,200 |
| New Haven Station | Newark Penn Station | 1,700 | 4,200 | 1,200 | 1,200 |
| Stamford | Secaucus | 0 | 0 | 200 | 200 |
| Boston | Penn Station New York | 492,200 | 1,224,500 | 1,355,000 | 1,294,300 |
| Hartford | Ronkonkoma | 0 | 0 | 0 | 10,000 |
| Boston | Storrs | 0 | 0 | 0 | 25,700 |
Source: NEC FUTURE team, 2015
Philadelphia includes Philadelphia 30th Street Station and Philadelphia Market East.
Baltimore includes Baltimore Penn Station and Baltimore Downtown.
Boston includes Boston Back Bay and South Station.
| Metropolitan Area | Annual Regional Trips | |||
|---|---|---|---|---|
| No Action Alternative | Alternative 1 | Alternative 2 | Alternative 3 | |
| Greater Washington, D.C., Area | 17,999,000 | 29,326,000 | 36,773,000 | 44,645,000 |
| Greater Baltimore Area | 4,574,000 | 6,313,000 | 7,172,000 | 7,964,000 |
| Greater Philadelphia Area | 32,794,000 | 36,318,000 | 37,726,000 | 39,529,000 |
| New York-North Jersey Area | 318,876,000 | 344,265,000 | 353,883,000 | 379,624,000 |
| Greater Providence Area | 3,091,000 | 8,044,000 | 7,766,000 | 8,884,000 |
| Greater Boston Area | 39,022,000 | 46,560,000 | 48,488,000 | 60,974,000 |
| TOTAL | 416,356,000 | 470,826,000 | 491,808,000 | 541,620,000 |
Source: NEC FUTURE team, 2015
* Shore Line East and New Haven-Hartford-Springfield service not included
| Select Station Screenlines | Daily two-way trips (2040) | |||
|---|---|---|---|---|
| No Action Alternative | Alternative 1 | Alternative 2 | Alternative 3 | |
| Washington Union Station | 48,000 | 75,000 | 86,000 | 104,000 |
| Penn Station New York | 368,000 | 494,000 | 616,000 | 685,000 |
| Boston South Station | 59,000 | 87,000 | 91,000 | 128,000 |
Source: NEC FUTURE team, 2015
The assessment of transportation effects for this Tier 1 Draft EIS is consistent with the level of detail necessary to consider how the No Action Alternative and Action Alternatives would create overall impacts in the way transportation system users would travel based only on changes in the speed, frequency, and availability of service. The goal of the transportation effects assessment is to highlight how travel could occur based on the service assumptions that frame the No Action and Action Alternatives.
Subsequent Tier 2 analysis would provide greater detail on how the transportation improvements to be described in the Tier 2 assessment would result in more localized impacts and changes to connecting services that are only briefly discussed in this Tier 1 Draft EIS. The Tier 2 assessment would provide greater details on how the transportation improvements could affect travel conditions in and around stations; how station-specific boardings for Regional rail service would be assessed; how connecting intercity and other public transportation services could also modify their frequency and type of services to better synchronize with increases in intercity travel envisioned as part of NEC FUTURE; and how changes to land use and development could affect demand and mode choice.
1 Appendix B, Ridership Technical Memorandum
2 The FRA developed Service Plans for the No Action and Action Alternatives to describe the types and levels of passenger train service operating on the NEC in 2040. These Service Plans depict a representative train operations pattern for a typical future weekday, and include the train stops by station for both peak and non-peak periods. The Service Plans provide a basis for estimating future ridership and capital investment needs and costs, as well as to assess the environmental impacts associated with planned construction and future operations.
3 American Association of State Highway and Transportation Officials (AASHTO), Commuting in America 2013, May 2013, http://traveltrends.transportation.org/Documents/B1_CIA_Overview_web_2.pdf
4 2011 Congested Corridors Report, Texas Transportation Institute, November 2011, http://d2dtl5nnlpfr0r.cloudfront.net/tti.tamu.edu/documents/corridors-report-2011.pdf
5 INRIX Traffic Scorecard, July 2014 data year, accessed August 1, 2015, http://inrix.com/scorecard/
6 United States Department of Commerce, Bureau of Economic Analysis, (2015). Regional Economic Accounts. Retrieved February 2015, from United States Department of Commerce, Bureau of Economic Analysis: http://www.bea.gov/regional/index.htm
7 Airport Cooperative Research Program, Integrating Aviation and Passenger Rail Planning, Report 118, April 2015, http://www.trb.org/Publications/Blurbs/172409.aspx
8 Airport Cooperative Research Program, Integrating Aviation and Passenger Rail Planning, Report 118, April 2015, http://www.trb.org/Publications/Blurbs/172409.aspx
9 American Public Transportation Association, Millennials and Mobility: Understanding the Millennial Mindset, October 2013, http://www.apta.com/resources/reportsandpublications/Documents/APTA-Millennials-and-Mobility.pdf
10 U.S. Census Bureau, Mode Less Traveled: Walking to Work by Region and City Size, 2008-2012, https://www.census.gov/prod/2014pubs/acs-25.pdf
11 Federal Highway Administration, Synthesis of Traveler Choice Research: Improving Modeling Accuracy for Better Transportation Decisionmaking, FHWA-HRT-13-022, August 2013
12 Ibid.
13 Existing Office of Management and Budget and U.S. Census Bureau MSA Definitions, Metropolitan and Micropolitan Statistical Areas and Definitions, http://www.census.gov/population/metro/data/metrodef.html, Accessed 8/8/2016
14 Based on NEC FUTURE model output.
15 Northeast Corridor Infrastructure and Operations Advisory Commission, Northeast Corridor Bus Ridership Study, 2014
16 Northeast Corridor Infrastructure and Operations Advisory Commission, Northeast Corridor Bus Ridership Study, 2014
17 Federal Aviation Administration Passenger and All-Cargo Data, Terminal Area Forecast Summary, Fiscal Years 2012 to 2040, 2012
18 Passenger rail corridor that connects directly to another rail corridor (in this instance, the NEC) via a station transfer or through-train service.
19 Federal Highway Administration, Freight Analysis Framework 3 data, http://www.ops.fhwa.dot.gov/freight/freight_analysis/faf/faf3/netwkdbflow/
The information posted on this website includes hypertext links or pointers to information created and maintained by other public and/or private organizations. The FRA provides these links and pointers solely for information and convenience. When users select a link to an outside website, they are leaving the NEC FUTURE website and are subject to the privacy and security policies of the owners/sponsors of the outside website. The FRA does not control or guarantee the accuracy, relevance, timeliness or completeness of information contained on a linked website, or endorse the organizations sponsoring linked websites, the views they express, or the products/services they offer. The FRA cannot authorize the use of copyrighted materials contained in linked websites and is not responsible for transmissions users receive from linked websites.