This chapter describes the representative economic effects that would occur with implementation of the NEC FUTURE Tier 1 Final Environmental Impact Statement (Tier 1 Final EIS) No Action Alternative and Preferred Alternative. Economic effects include the following:
In addition, the chapter describes the potential indirect effects on resource topics presented in this Tier 1 Final EIS that could occur in metropolitan areas served by the Preferred Alternative based on the potential for program-related induced growth.
This chapter is organized as follows:
The No Action Alternative does not have sufficient capacity to accommodate projected demand. Because of this constraint, potential rail travelers make other choices, imposing a cost on the economy. The Preferred Alternative removes this capacity constraint from the region's economy by providing sufficient capacity to meet projected demand for rail travel. The Preferred Alternative also increases service frequency and connectivity among the economies of the Northeast Corridor (NEC) relative to the No Action Alternative. The Preferred Alternative therefore removes the economic penalty under the No Action Alternative by making more rail service available and allowing travelers to make their first or best choice.
As a result, projected Intercity ridership would more than double and projected Regional rail ridership would increase by about 20 percent by 2040, in comparison to the No Action Alternative. Travelers would choose to make over 20 million additional Intercity rail trips and more than 75 million additional Regional rail trips annually relative to the No Action Alternative, demonstrating the value of the Preferred Alternative. This is similar to how Alternative 2 performed in the Tier 1 Draft EIS.
The construction and operation of the rail improvements and services under the Preferred Alternative would result in changes to economic activity throughout the Study Area. Some changes would be immediate, while others would take place over a longer period. These economic effects are compared to those that would occur under the No Action Alternative and include Economic Development Response, Travel-Market Effects, Construction and Rail Sector Employment Effects, and Indirect Effects associated with potential economic growth, as summarized below.
The Preferred Alternative at least doubles, and in some instances, more than quadruples, the number of daily trains serving metropolitan areas along the corridor and would allow travelers in these areas to access between 10 and 21 additional destinations via direct rail connection. The increase in Regional rail would provide greater accessibility for workers and employers. Business productivity would benefit from employers' access to a broader and more diverse labor market. The increase in access to people would be greatest in Philadelphia, PA, Trenton and Newark, NJ, and New York City where the net change in people accessible within a 45-minute train travel time of each economy's Hub station in 2040 would exceed 3,000,000 relative to the No Action Alternative. This would provide strong support for agglomeration effects.
The incorporation of the Hartford/Springfield Line into the Preferred Alternative would expand the area of mobility and benefits provided by Intercity rail service. For example, the Preferred Alternative would allow travelers in Springfield to access 17 additional destinations via a direct rail connection. This increase in connectivity to other destinations along the NEC would intensity the potential for station-area development.
The expanded range of service and price options available in the Preferred Alternative would provide rail travelers with greater flexibility to select a service meeting their trip needs. These expanded choices would improve the ability of NEC travelers to select trips matching their preferred trip time and cost characteristics, while also enjoying the safety and air quality benefits of the rail travel mode. For example, when both the value of travel time and travel cost are considered jointly, the net benefit for travelers diverting from other modes (air, auto, and bus) to rail is estimated to be over $300 million annually under the Preferred Alternative. These travel-cost savings represent real gains in disposable income that would be available for other types of expenditures or saving.
Furthermore, whether expanded rail service would require an ongoing operating subsidy would have a fiscal impact on the public sector. However, under the Preferred Alternative, Intercity services would be able to generate an operating surplus, since operating revenues would exceed operating costs.
Potential construction effects would occur primarily within the Affected Environment and would represent a large, one-time stimulus to the economy. Construction jobs (measured as job-years) range from approximately 300,000 under the No Action Alternative to more than 1.4 million under the Preferred Alternative. Additional hiring would be required to operate and maintain the expanded rail service; the Preferred Alternative would support approximately 36,600 jobs related to operation and maintenance (measured as job-years), in comparison to 2,300 jobs under the No Action Alternative.
Induced growth can result in both positive and negative indirect effects. The potential for induced-growth effects would be higher under the Preferred Alternative relative to the No Action Alternative. The region north of New York would have the highest potential for indirect effects. In addition, many metropolitan areas along the Preferred Alternative, particularly in and south of New York City, would gain one or more Hub stations, which are focal points for development in the surrounding area. Hubs and Major Hubs support greater development intensity than local stations. These stations have potential for indirect effects to occur as a result of induced growth.
While transportation investment alone does not generate economic activity, it can influence the pace and location of economic growth when other factors such as available skilled labor, competitive business costs, and other regional competitive advantages are favorable. A transportation system supports a region's economic activity to the degree that it 1) has sufficient capacity to meet demand; 2) offers connections to markets where travelers want to visit; 3) provides a range of prices and travel times that serve a variety of markets; and 4) offers reliable and safe options. Conversely, congestion, unreliable travel times, comparatively high travel costs (in time or fares), and the inability to readily connect and access destinations within the region hinder economic activity and impose a penalty on an area's economic potential.
The Northeast Regional Economy in the Context of the National Economy
The economic health of the region is critical for the nation's economic health.
Beyond the transportation system's potential impact on the operation of an urban economy, the frequency, reliability, pattern, and accessibility of transportation influences how urban economies compete or cooperate in the larger national and global economy. Urban economies such as those that regularly dot the NEC are part of a larger interdependent cluster of cities, towns, and developed areas. Changes in the connections and interdependencies within the urban system-viewed regionally, nationally, or even globally-influence economic prospects and growth. Changes in transportation cost, connectivity, and mobility directly influence the connections among urban economies and can alter these relationships-allowing a place to become a hub or focal point for commerce, or conversely, making a place more peripheral to the region's commercial center. Changes in these interdependencies influence urban growth along the corridor thereby increasing the potential for indirect effects to occur within the region.
To estimate these economic effects attributed to the Preferred Alternative, the Federal Railroad Administration (FRA) followed each stage of project implementation. First, the Preferred Alternative is built, generating construction effects discussed in Section 6.3.2. Once constructed, the Preferred Alternative begins service, supporting employment through its operation and travel user benefits through its use. For example, travel user benefits include travel-time, travel-cost, and safety benefits. Sections 6.3.3 and 6.3.4 discuss these effects. Finally, once the Preferred Alternative is in use, the market responds to the availability of this new service. Section 6.3.5 describes the market response. Section 6.3.6 describes potential indirect effects that could result from induced growth.
The construction of the Preferred Alternative would influence economic activity along the NEC Rail Network,1 since building the requisite rail infrastructure would expand payrolls for the duration of the construction cycle. This analysis focuses on the net effects generated by new investment in the regional economy resulting from the Preferred Alternative. The construction hiring associated with the Preferred Alternative represents the direct effects of investment in the NEC. The earnings of these newly hired construction workers would translate into a proportional increase in consumer demand since these workers purchase goods and services in the region. As employers hire to meet this increase in local consumer demand and to provide materials and supplies for the Preferred Alternative, a further increase of new employment across a variety of industrial sectors and occupational categories is expected. This latter hiring represents some of the Preferred Alternative's potential indirect and induced impacts.
Calculation of potential construction employment impacts relies on capital cost estimates developed for the Preferred Alternative. The capital expenditures for construction of the Preferred Alternative are estimated to cost between $123 billion and $128 billion (in 2014 dollars), as discussed in Chapter 4, Alternatives Considered. There are four main categories of capital expenditures:
The potential economic impact of these capital expenditures would vary significantly by activity and depend on the amount of regionally produced goods and services embodied in the purchase.
Construction of the Preferred Alternative represents significant capital investment in the local economies within the Affected Environment. This spending would increase employment for the duration of the construction process. This section describes the potential direct and total employment impacts.2
To isolate the potential economic effects of the alternatives within the Affected Environment, an economic impact analysis typically distinguishes between resources that are new to the economy and that would not be invested as a result of the Preferred Alternative from those that would be spent in the region regardless of the Preferred Alternative. The analysis makes this distinction because only potential impacts from new funding sources would support employment in the Affected Environment that would not otherwise occur. At the Tier 1 level of planning, the specific funding or financing sources needed to implement the entirety of the Preferred Alternative are not yet identified with various funding scenarios are possible. Therefore, the FRA applied a simplifying assumption that the full cost of the Preferred Alternative would represent net new funding for the Affected Environment. The FRA also assumed that construction of the rolling stock cost component would be constructed in the United States but not necessarily in the Affected Environment.
Potential construction employment effects (Table 6-1) would occur primarily within the Affected Environment and represent a large, one-time stimulus to the economy. Construction jobs (measured as job-years) range from nearly 300,000 under the No Action Alternative to more than 1.4 million for the Preferred Alternative. Of the 1.4 million job-years, more than half would be direct job-years, assuming that the rolling stock is manufactured in the United States, but outside of the Affected Environment.3 Direct construction employment impacts describe the number of workers hired to build the No Action Alternative and Preferred Alternative. Indirect jobs would be created since these workers purchase supplies, such as steel and aggregate, for construction activity. As the construction workers spend their wages in the economy, their spending would circulate through the economy and create induced jobs. Total employment impacts are the sum of direct, indirect and induced jobs.
| No Action Alternative Total |
Preferred Alternative | ||
|---|---|---|---|
| Affected Environment (Range) |
U.S.-Outside Affected Environment | ||
| Direct Employment (in Job-Years) | 146,180 | 658,200-692,620 | 18,320 |
| Indirect and Induced Employment | 149,470 | 691,860-728,000 | 71,220 |
| Total Employment (in Job-Years) | 295,650 | 1,350,060-1,420,620 | 89,540 |
Source: NEC FUTURE team, 2016
Construction would result in an average of nearly 57,600 total jobs per year.4 Compared to the typical Walmart with 250 employees, construction of the Preferred Alternative would be similar to hiring employees for 230 new Walmart locations within the Affected Environment every year. 5
Construction of the Preferred Alternative represents significant capital investment in the local economies of the NEC region. This spending would increase earnings for the duration of the construction process. This section describes the potential total earnings impacts.
The effect of capital spending for the Preferred Alternative would result in total earnings of between $70.2 billion and $73.64 billion (in 2014 dollars),6 in comparison to $14.11 billion under the No Action Alternative.7 Of these earnings, the Preferred Alternative would generate $4.25 billion in earnings outside the Affected Environment. The total earnings would result in average earnings of about $48,800 per job-year, assuming the rolling stock is manufactured outside of the Affected Environment but inside the United States.8
To put these results into context, the No Action Alternative will result in average earnings of about $47,700 per job-year,9 reflecting an average wage across the direct construction jobs and jobs supported across a variety of industries as construction workers spend their wages for goods and services and materials and supplies are purchased.
The building activity needed to construct the No Action Alternative and the Preferred Alternative represents the most-immediate economic outcome associated with implementation. These are large economic effects that last for the duration of the construction cycle only. The estimates of construction effects are expenditure driven-the larger the investment, the larger the construction effect. Thus, the differences between the No Action Alternative and Preferred Alternative in terms of relative jobs and earnings follow the differences in costs.
Unlike the construction effects that represent a one-time stimulus to the economy, employment and earnings effects associated with an alternative's operation and maintenance (O&M) are recurring impacts that would last for the duration of the system's operation. Additional hiring would be required to operate and maintain the expanded rail service. Operating and maintaining the rail service proposed for the Preferred Alternative would expand payrolls in each year of operation. The O&M hiring associated with the Preferred Alternative represents the direct effect within the Affected Environment. The earnings of these newly hired rail sector employees would translate into a proportional increase in consumer demand since these workers purchase goods and services in the region. Purchases of materials and supplies to support operations would further support jobs and earnings. A further increase of new employment across a variety of industrial sectors and occupational categories would occur as employers hire to meet this increase in demand. This latter hiring represents some of the Preferred Alternative's potential indirect and induced impact.
Although implementation of the Preferred Alternative would be incremental and phased over time, this assessment assumes additional employment and earnings in the rail sector (in 2014 dollars) for the fully implemented Preferred Alternative in the horizon year of 2040. The Preferred Alternative comprises three service types: Intercity-Express, Intercity-Corridor, and Regional rail. This chapter presents the rail-sector employment and earnings estimates for the three service types for the Affected Environment as a whole.
The results shown focus only on the potential additional incremental economic impacts attributable to the Preferred Alternative (i.e., the marginal difference between future conditions assuming existing rail service levels and the future conditions under implementation of the Preferred Alternative) in 2040.
Jobs supported through expenditures for rail O&M are recurring jobs; they are anticipated to remain as long as the service is operated. This section describes the potential direct and total employment impacts from operation and maintenance of the No Action Alternative and Preferred Alternative.
As Table 6-2 shows, the amount of employment supported rises from the No Action Alternative (2,300 job-years) to Preferred Alternative (23,500 job-years). The employment effects are expressed in job-years, or one job for one person for one year. If one person held the same job for three years, this would be equivalent to three job-years.
| Service Type | No Action Alternative | Preferred Alternative | ||
|---|---|---|---|---|
| Direct Employment (Job-Years) | Total Employment (Job-Years) | Direct Employment (Job-Years) | Total Employment (Job-Years) | |
| Intercity-Express | 600 | 800 | 5,300 | 7,500 |
| Intercity-Corridor | 1,100 | 1,500 | 11,600 | 16,000 |
| TOTAL | 1,700 | 2,300 | 16,900 | 23,500 |
Source: NEC FUTURE team, 2016
Note:
Values shown are net of existing service. Intercity-Corridor service
includes Metropolitan service.
For this analysis, the FRA assumed that funding for O&M would be procured from federal and local government funds as well as project-generated funds such as ticket revenues and food and beverage purchases. Although some of these expenses would originate from local sources, this represents spending that would not take place but for the implementation of the Preferred Alternative service. The expansion of rail passenger service associated with the Preferred Alternatives represents an expansion of economic activity within the Affected Environment and thus generates potential recurring net economic impacts (long-term).
The O&M costs for the Preferred Alternative assumes existing Intercity fares similar to today, as adjusted to normalize the premium placed on travel through New York City and to balance ridership, revenue, and cost. (Refer to Appendix B.9, Operations and Maintenance (O&M) Costs Technical Memorandum for more information.)
The earnings for the Preferred Alternative follow that for O&M employment and the general framework under which the estimates are made are also the same. Briefly, the annual O&M of the Preferred Alternative would increase employee earnings in the region as long as the service is operated. These potential impacts are long-term annual impacts that would continue for the life of the service. This section describes the potential anticipated earnings impacts from the No Action Alternative and Preferred Alternative.
As shown in Table 6-3, the effect of O&M spending for the Preferred Alternative would result in a total of $782 million in earnings in 2040, expressed in millions of 2014 dollars. To estimate the potential earnings impacts that result from employment for the full build-out, the analysis converted O&M expenses from 2013 dollars to 2014 dollars, using Gross Domestic Product (GDP) Chained Price Index deflators.10
| Service Type | Net of existing service, in millions of $2014 | |
|---|---|---|
| No Action Alternative | Preferred Alternative | |
| Intercity-Express | $24 | $251 |
| Intercity-Corridor | $47 | $531 |
| TOTAL | $72 | $782 |
Source: NEC FUTURE team, 2016
Note:
Intercity-Corridor service includes Metropolitan service
Even with its large existing rail transportation network, the NEC is capacity-constrained under the No Action Alternative and this tempers potential economic growth. One of the most important findings of the NEC analysis is that there is currently unmet demand for rail travel in the corridor. The demand for transportation is derived demand because the large majority of travel is not for the purposes of the transportation itself, but as a means to reach a destination. When travelers are unable to make trips in their preferred manner and must select the second-best option, this imposes a cost on the consumers' or businesses' economic choice. When large numbers of travelers must repeatedly select their second-best option or when there are capacity constraints on urban economies' abilities to reliably move large numbers of workers in and around the economy, the growth potential of this already high-cost corridor is tempered.
Travel-Market Changes
Monetized value of changes in travel times, safety and travel-related air quality caused by changes in transportation services (e.g., faster, more-frequent rail service) and travelers' resultant shifts among travel modes (auto and air).
The Preferred Alternative removes a capacity constraint from the region's economy by providing sufficient capacity to meet projected demand for rail travel. By contrast, the No Action Alternative does not have sufficient capacity to accommodate projected demand. Because of this constraint, potential rail travelers make their second-best choice, imposing a cost on the economy. The Preferred Alternative removes this economic penalty and would allow travelers to make their first-best choice. As a result, travelers would choose to make more than 20 million additional Intercity rail trips and 75 million additional Regional rail trips annually relative to the No Action Alternative.
In concert with the reduction or complete removal of the rail service capacity constraint, the Preferred Alternative offers faster travel times for many existing rail-served markets, expands service to markets not currently served, and offers a greater range of pricing. Collectively, as highlighted in the section below, these changes would allow travelers to make different travel choices than under the No Action Alternative. This change in travel behavior is important because transportation investment influences economic outcomes when and only it first solves a transportation challenge or fills a gap in the market.
Travel-time savings and cost savings are described in greater detail later in this section; however, Table 6-4 displays the net change, relative to the No Action Alternative, in the value of travel-time and travel-cost savings for diverted users by mode. Table 6-4 also shows the trade-off that some travelers would make for travel costs and time. For example, air travelers who shift to rail would pay a penalty (or loss) in travel time-$79 million for the Preferred Alternative. However, travelers would make up this loss in travel-cost savings. When both the value of travel time and travel cost are considered jointly, the Preferred Alternative would provide an estimated $39 million net benefit for air travelers. Similarly, because rail travelers would have a greater range of service types with different prices, including Intercity-Express, Intercity-Corridor (including Metropolitan) and Regional rail, they would be able to select the type of rail service that best fits the time and cost needs of their trip. For example, a business traveler could take the Intercity-Express to a business meeting and a slower but lower cost train coming back from the meeting when schedule pressures may be less severe. Table 6-4 also presents these rail-to-rail diversions. Table 6-4 illustrates similar travel-time and travel-cost tradeoffs for each mode for the Preferred Alternative. These travel-cost savings represent real gains in disposable income that is available for other types of expenditures or saving.
| Preferred Alternative (in millions of $2014) | ||
|---|---|---|
| Travelers Shifting from Air to Rail | Change in value of travel time | -$79 |
| Change in travel cost | $119 | |
| Net change | $39 | |
| Travelers Shifting from Auto to Rail | Change in value of travel time | $452 |
| Change in travel cost | -$234 | |
| Net change | $217 | |
| Travelers Shifting from Bus to Rail | Change in value of travel time | $129 |
| Change in travel cost | -$84 | |
| Net change | $45 | |
| Travelers Shifting from Rail to Rail | Change in value of travel time | $441 |
| Change in travel cost | $624 | |
| Net change | $1,065 |
Source: NEC FUTURE team, 2016
Note:
Positive values indicate a benefit to users while negative values indicate
a cost relative to the No Action Alternative. Rail includes travel-time
savings for base and diverted riders.
This section describes the travel-time benefits associated with the No Action Alternative and Preferred Alternative for Intercity and Regional rail services.
Intercity Rail Travel-Time Savings
Improvements to Intercity rail capacity and service would result in travel-time savings for Intercity rail users, which can be broken down into three components:
The FRA calculated changes in travel times for Intercity rail service within the Affected Environment summed by metropolitan area. To derive the travel-time savings, the FRA compared Travel Demand Model outputs associated with the Preferred Alternative with the No Action Alternative model outputs, for year 2040, for the 14 metropolitan areas. The FRA measured travel times, including in-vehicle and out-of-vehicle time in minutes. For base Intercity rail trips, the FRA calculated the total time savings associated with the Preferred Alternative by multiplying the number of base trips with the change in travel times between the No Action Alternative and Preferred Alternative, and then summed at the metropolitan area level. For trips diverted from other modes of transport and between the Intercity rail services, the FRA calculated the total time savings by multiplying the number of trips diverted from each mode/service by the change in travel times between the two modes/service for each zone pair, and then summed at the metropolitan area level. The FRA converted annual minutes to hours and multiplied by the value of time for business and personal travel. Comparing the No Action Alternative to the annual travel-time savings for auto, air, bus, and rail users diverting to Intercity passenger rail results in the net change in travel times for the Preferred Alternative. Positive values for change in travel times indicate travel-time savings, while negative values indicate that travelers would not save time by using Intercity passenger rail.
The FRA derived the Intercity value of travel-time benefits for the year 2040 by applying the values of time for personal and business trips to the 2040 travel-time savings by mode and metropolitan area for diversions to Intercity passenger rail. Table 6-5 shows the 2040 value of travel-time savings associated with the Preferred Alternative as compared to the No Action Alternative.
| Preferred Alternative (in millions of $2014) | |
|---|---|
| Air | ($79) |
| Auto | $452 |
| Bus | $129 |
| Rail | $441 |
| TOTAL | $942 |
Source: NEC FUTURE team, 2016
Note:
Rail includes travel-time savings for base and diverted riders.
The mix of diversions to and from modes may result in positive time savings for users who divert from slower modes to faster modes, or negative time savings (with cost savings) for users diverting from faster modes to slower modes. As shown, the travel-time savings for air are negative, indicating it would take longer to use Intercity-Corridor service than air. Rail users would divert between Intercity-Express and Intercity-Corridor modes; though passengers who divert from Intercity-Express to Intercity-Corridor services would lose time, the overall time savings would be positive for the Preferred Alternative because of the time savings experienced by base passengers using Intercity rail and passengers diverting from autos.
There may be a number of reasons why riders choose to divert from Intercity-Express and air to Intercity-Corridor services that result in the negative travel-time savings. The Intercity-Corridor fare would be lower than the other two modes, and although the travel time would be longer, there are other factors contributing to the decisions to divert. Passengers may find Intercity-Corridor service to be more convenient due to the increased frequencies, time-of-day travel needs, more spacious seats than on an airplane, the availability of wireless internet and power plugs may make travel time more productive than air, and easier access from rail stations to downtowns than airports. The more-frequent and affordable Intercity-Corridor service would result in diversions from Intercity-Express rail and air.
Regional Rail User Benefits
Transit riders who share the corridor would also benefit from investments made under the Preferred Alternative. The FRA estimated User Benefits of Regional rail according to Federal Transit Administration guidance, which measure both travel-time and travel-cost savings. The User Benefits metric estimates travel utility as the difference in user costs between alternatives. It includes prices in terms of out-of-pocket costs and the cost of time. As a result, User Benefits are valued approximately as travel-time savings in total annual hours. The FRA measured User Benefits for base Regional rail riders as well as Regional rail diversions from transit and autos. The FRA applied the value of time for local travel, all purposes of $13.20 per hour11 for all geographies in the Preferred Alternative relative to the No Action Alternative. Subsequent Tier 2 project studies will allow for a more geographically focused and detailed analysis with regard to regional service.
Table 6-6 shows the millions of hours of User Benefits in the metropolitan areas that would result from diversions to Regional rail service. The millions of annual auto diversions are shown for the Preferred Alternative compared to the No Action Alternative.
| Net of No Action Alternative, in millions | |
|---|---|
| Preferred Alternative | |
| Annual Hours of User Benefits (Travel-Time Savings) | 70 |
| Annual Auto Diversions | 48 |
Source: NEC FUTURE team, 2016
As shown in Table 6-6, the auto diversions would contribute a relatively low percentage of User Benefits. As a result, Regional rail customers would realize most of the User Benefits, estimated to be $924 million. Because User Benefits include travel-cost metrics, the FRA did not estimate travel-cost savings separately for Regional rail. This equates to an average of $1.83 in User Benefits per Regional rail trip (across the five regional markets of Washington, D.C./Baltimore, Philadelphia, New Jersey, New York/Connecticut, and Boston) under the Preferred Alternative.
Across all nine Economic Development Workshops conducted within the Study Area as part of the Economic Effect analysis, participants uniformly valued reliability of service as the most important quality of service. Reliable service was viewed as a necessary condition for rail to be adopted by travelers and to spark economic development, without which travel-time savings, additional frequencies and connectivity were not useful to the traveler-a faster unreliable train is not valued more than a slower unreliable train because travelers cannot plan and incur an opportunity cost. Although investments will be made to the corridor under the No Action Alternative, these investments will not be sufficient to return the corridor to a state of good repair. Thus, rail travel is projected to, at best, retain a similar level of reliability as is present in today's service. By contrast, the Preferred Alternative offers reliable travel by design. While the increase in reliability for the Preferred Alternative would benefit users and operators, the metric is difficult to calculate with the level of available information at this stage of the planning process; thus, the FRA did not undertake further estimation of this outcome as part of the economic effects analysis.
The quantitative analysis focuses on the travel-cost savings associated with Intercity rail only. Travel-cost savings for Intercity rail include two components: 1) savings incurred by base Intercity-Corridor and Intercity-Express passengers who use the service in the No Action Alternative and Preferred Alternative and experience lower fares in the Preferred Alternative; and 2) savings incurred by passengers diverted from other modes of transport to Intercity passenger rail service. This includes savings incurred by passengers diverted from Intercity-Express rail service to Intercity-Corridor rail services in the Preferred Alternative because of lower fares and increased frequency for the Intercity-Corridor service. The travel-cost savings of diversions to Regional rail from other modes (primarily auto or bus for Regional services) accommodated by additional capacity utilized by regional providers is included in the User Benefits estimation described in the Travel-Time Savings section. The utility function used to estimate User Benefits considers travel times and costs; as a result, travel costs are not shown separately for Regional rail.
The FRA developed annual travel-cost savings corresponding to the No Action Alternative as part of the Intercity travel demand modeling for 14 metropolitan areas. The travel-cost savings take into account the net change in access/egress costs, fares or vehicle operating costs, and parking costs for trips diverted to Intercity rail from all other modes. Total potential cost impacts are calculated by multiplying the number of trips diverted (by each mode) with the difference in costs between the two modes for each zone pair, and then summed up to at the metropolitan statistical areas metropolitan area level. This analysis estimated costs in 2013 dollars and escalated to 2014 dollars using GDP Chained Price Index Deflators.
Table 6-7 shows the 2040 Intercity travel-cost savings associated with the Preferred Alternative relative to the No Action Alternative in millions of 2014 dollars. The table summarizes the Intercity effects for the Preferred Alternative for all four modes. The negative totals for auto and bus indicate that the diversions to passenger rail from auto and bus would cost more to users than the No Action Alternative. However, the Preferred Alternative results in travel-cost savings overall. To put these values into context, the Preferred Alternative would save users enough travel costs to buy 2.8 million train trips between Washington, D.C., and New York Penn Station at an average cost of $150 per trip.
| Trips | Net of No Action Alternative, in millions of $2014 |
|---|---|
| Preferred Alternative | |
| Air | $119 |
| Auto | ($234) |
| Bus | ($84) |
| Rail | $624 |
| TOTAL All Modes | $424 |
Source: NEC FUTURE team, 2016
As described in Chapter 7.18, Safety, relocating trips anticipated for highways onto increased rail capacity would result in safer tripmaking. As a result, additional passenger rail capacity provides an opportunity for commuters to divert from other transportation modes, including auto. This diversion has the potential to reduce the likelihood of being in a crash for those substituting their current mode of transportation for rail transportation, since highway fatalities are responsible for the largest share (93 percent) of transportation-related fatalities. The avoidance of crashes prevents loss of life, protects quality of life and human capital, as well as property damage.
The analysis does not estimate the effects on safety for diversions from bus, rail, and air transportation because those modes of transportation will continue to provide service. Even if some travelers divert to Intercity and Regional rail from bus, or to Intercity-Express from all other Intercity rail modes, the analysis assumes those services will continue to operate and contribute to crashes at the same rate. The travel-market analysis conducted for this assessment is unable to predict if there would be a reduction in the number of routes or the frequency for these other modes if load factors were to fall below a certain criteria. As a result, changes to safety are estimated only for passengers who divert from auto to Intercity and Regional rail.
Passenger rail provides an alternative to using congested highway corridors and improves safety for travelers who divert from auto travel while increasing the accessibility for the region's populations to jobs, education, and recreational opportunities. Better access to rail would result in vehicle-miles traveled (VMT) saved with passenger rail users no longer using autos. This reduces the likelihood of crashes and associated deaths, injuries, and property damage as travelers use the new and expanded passenger rail services.
Table 6-8 shows the safety benefits for the Preferred Alternative for Intercity and Regional rail based on diverted auto VMT and the associated crash rates and value of crashes avoided.
| Net of No Action Alternative, in millions of $2014 | |
|---|---|
| Preferred Alternative | |
| Auto Safety Costs Avoided: Intercity | $963 |
| Auto Safety Costs Avoided: Regional | $319 |
| Auto Safety Costs Avoided: TOTAL | $1,283 |
Source: NEC FUTURE team, 2016
Note:
Figures shown for Preferred Alternative includes Intercity and Regional
service. Totals may not add due to rounding.
The FRA developed annual changes in criteria pollutants corresponding to the 2040 Preferred Alternative as part of the air quality analysis, described in more detail in Chapter 7.13, Air Quality. The air quality analysis estimated the potential annual impacts of the Preferred Alternative in comparison to the No Action Alternative, with respect to changes in tons of criteria pollutants associated with roadways (diverted VMT), diesel trains, and electric trains. The emissions consider Intercity, Regional, and freight rail services for an existing energy profile and a future energy profile.
Table 6-9 shows the dollar value for total emissions effects in the region for the Preferred Alternative. In this table, positive values of monetized emissions impacts indicate the Preferred Alternative would reduce emissions costs in the region; negative values of monetized emissions costs would indicate that the Preferred Alternative generates additional emissions costs in the region. As shown, the Preferred Alternative would result in emissions savings to the region compared to the No Action Alternative for both energy profiles (described in Chapter 7.13, Air Quality).
| Net of No Action Alternative, in millions of $2014 | |
|---|---|
| Preferred Alternative | |
| Existing Energy Profile | $54 |
| Future Energy Profile | $61 |
Source: NEC FUTURE team, 2016
Although the NEC economies are concentrated in services, they retain a small-goods production base, host some of the nation's largest marine ports requiring efficient landside access, and account for a large share of the U.S. consumer market. These are all factors that underscore the need for continued and efficient goods movement in the corridor for continued economic health.
Freight services flows nearly the entire length of the corridor. Freight traffic is market-driven and seasonal; between 26 and 30 freight trains travel some portion of the NEC daily depending on the time of year. The mix of commodities is diverse, with nearly every major rail commodity represented. Containers, chemicals, motor vehicles and equipment, food and kindred product, and paper pulp account for the largest share of the freight traffic.12 The freight traffic is generated by the multiple ports along the Atlantic Coast, utility companies, and retailers serving the energy and consumer needs of the corridor's large population centers and small businesses. The Northeast and Mid-Atlantic ports are gateways for the nation not just the NEC region itself; a portion of the goods that flow through these ports is destined for the interior of the United States. Ports in New York City, Newark, and Philadelphia are among the busiest on the East Coast in terms of total tonnage. As a consequence, the efficient flow of freight in this corridor benefits not just Study Area economies, but those in the Midwest and South whose business base utilizes a North or Mid-Atlantic port to access the global economy. The manufacturers of cargo exported from the Port of Baltimore are located across the Midwest in places such as Detroit, Michigan (Ford Motor Company and GM), Waterloo, Iowa (John Deere) and Hesston, Kansas (Agco).13 While there is some freight activity along most of the corridor, the areas of greatest freight traffic density are near Baltimore MD, and Springfield, MA.
The Preferred Alternative would help ease select chokepoints in the corridor, offering benefits for freight movements as well as the passenger service. The Preferred Alternative assumes that current service levels for freight rail will be preserved. This means that the volume of freight moved through the corridor would not differ under the No Action or Preferred Alternatives.
In addition to preserving current service levels for freight railroads, the FRA considered opportunities to accommodate the future growth and improvement of freight rail service within the Affected Environment. As noted in Chapter 5, Transportation, representative freight opportunities considered in the development and analysis of the Preferred Alternative include the following:
The preservation of existing freight service levels combined with opportunities to add capacity at key locations along corridor is important for the health of freight-dependent industries in the corridor. For example, the Delmarva Peninsula hosts small manufacturers and a large agricultural industry that relies on regular shipments of grain. Moreover, many of the nation's Atlantic seaports are east of the corridor but serve markets along and west of the corridor. Maritime freight volumes are anticipated to grow between now and 2040. This is a result of growth in the U.S. population as well as changes in trade patterns driven by the expansion of the Panama Canal, the industry's shift to greater use of larger ships that require efficient loading/unloading and distribution capabilities, and economic growth among world trading partners. Ports' competitiveness and the region's ability to retain and attract freight-dependent industries are supported by the preservation of existing service levels and opportunities to add capacity at key locations.
This section assesses whether expanded rail service on the corridor would require an ongoing operating subsidy since this would have a fiscal impact on the public sector. The FRA estimated O&M costs for the No Action Alternative and Preferred Alternative based on existing Intercity and Regional railroad operating costs for typical cost categories such as labor (e.g., train and maintenance crews), power and fuel, and management and administrative costs. The FRA developed O&M cost estimates through an iterative process, balancing operating costs with ridership and revenue estimates for the Preferred Alternative. For Intercity services, the FRA assessed service plans to determine if operating revenues were likely to exceed operating costs. Table 4-18 in Chapter 4, Preferred Alternative, presents the O&M cost estimates for Intercity services only. (Volume 2, Appendix B.9, Operations & Maintenance Cost Technical Memorandum, details the O&M cost methodology.) The analysis demonstrated that the Preferred Alternative is able to generate an operating surplus with a representative and generalized fare structure used for all market pairs. The FRA did not attempt to optimize operator revenue in its analysis as most choices about how to optimize revenues are dependent on future detailed service and operating choices made by railroad operators (e.g., types and number of classes of service, yield management practices). The analysis also demonstrated that the No Action Alternative is able to generate an operating surplus. However, costs and revenues associated with the No Action Alternative were not adjusted to reflect the likely decrease in reliability and insufficient future capacity present in the No Action Alternative. Also, the No Action Alternative assumes the continuation of current Intercity fare structures, which are more tailored to specific markets than the Preferred Alternative. The financial performance of the No Action Alternative would likely be sensitive to these limitations; however, the extent and type of impacts are highly uncertain and thus the FRA did not attempt to model them at a Tier 1 level.
The evolution of the travel market described in Section 6.3.4 removes a burden on the region's economy, and allows travelers to make different travel choices-trading off time for cost in many cases. This section focuses on the qualitative attributes of the service that could influence the nature of the economic development opportunities that could occur as the market adapts to the change in travel patterns. Businesses would adapt to capitalize on access to new and expanded labor markets. Travelers would be able to use rail more often and for a greater variety of trips than possible under the No Action Alternative. The economic development response may have a variety of dimensions that range from station area development (which is the most local) to labor market effects (which are typically regional) to agglomeration effects (which can vary in scale from a single metropolitan economy to an economically integrated urban megaregion).
In this analysis, changes in the travel market are applied to understand the potential nature of possible economic development outcomes. In order to understand this dynamic, the FRA conducted a series of Economic Development Workshops (described in Volume 2, Chapter 6, Section 6.3.5).
As noted earlier in this chapter, transportation investment influences
economic outcomes only if and when it first solves a transportation
challenge. In comparison to the No Action Alternative, the operation
of the Preferred Alternative would provide travelers with reliable and
more-frequent rail service, and would offer options for faster trips
and a greater variety of pricing options. As a result, the market share
for rail would grow. The Preferred Alternative demonstrated an overall
increase of 24 percent in total rail trips over the No Action Alternative.
Effects on Connecting Corridors
Connecting corridors to the NEC, including the following, may experience economic effects:
Once a connecting train reaches the NEC, it benefits
from investments made under the Preferred Alternative,
even though no additional capital or operating investments are made
to these corridors.
For example, since a portion of the rail
trip between Harrisburg, PA, and New York City is taken on the NEC,
the Preferred Alternative would reduce trip time by about half an
hour relative to the No Action Alternative. Ridership between the
two stations would increase by 69 percent.
What this means is that the potential for labor market effects and the ability to move even larger numbers of workers efficiently in and out of the commercial centers within the Study Area is large. However, the potential for agglomeration and economic "collaboration" among the metropolitan economies is enhanced by the increase in intercity travel-through the enhanced ability to share specialized labor, partner for research, or coordinate with multiple business units or contractors to compete in the larger market. The remainder of this section focuses on this potential.
Development around station access points is among the most visible market change. It is also the most local in terms of geographic scale. The scale and character of the development are influenced by the nature of the rail service provided, as well as the ability of the surrounding area to plan for and provide the other necessary factors to support development around stations. Connecting infrastructure, available parcels of sufficient size to accommodate the new developments, and appropriate policies and zoning are all examples of these necessary and complementary elements of station area development.
Furthermore, in considering economic effects of the Preferred Alternative, one of the largest questions is whether the cumulative changes in travel times and patterns of connectivity may change the way the individual metropolitan economies relate to one another as well. For example, would the changes in market access reinforce the dominance of the New York City market, or by contrast, would the smaller cities realize greater benefit and close some of the gap with New York City? The FRA considered the potential for agglomeration in this analysis.
Station Area Connectivity
Labor Productivity and Agglomeration Effects
These factors and others provide so-called agglomeration economies that diminish transaction costs and make the urban area's firms more productive.
Figure 6-1 summarizes the differences in the number of Local, Hub, and Major Hub stations by location for the No Action Alternative and Preferred Alternative. As stations move along the spectrum from Local station to Major Hub, they increase the number of modal options and rail services clustered at their locations: The greater the number of connections, the greater the potential for station area development. Under the Preferred Alternative, the Greater New York-North Jersey, Greater Philadelphia, and Greater Baltimore markets would have the greatest gains in stations, with Greater Hartford experiencing modest gains in stations. Moreover, each would gain one or more Hub stations, which are focal points for development in the surrounding area. In several workshops, participants noted the economic development value of clustering modes in one place; Hubs support greater development intensity than stations with just rail service. By contrast, no major changes would be observed in number and type of stations in Greater Washington, D.C., Greater Providence, and Greater Boston.
Figure 6 1: Number of Stations of Each Category in the NEC FUTURE Station Typology
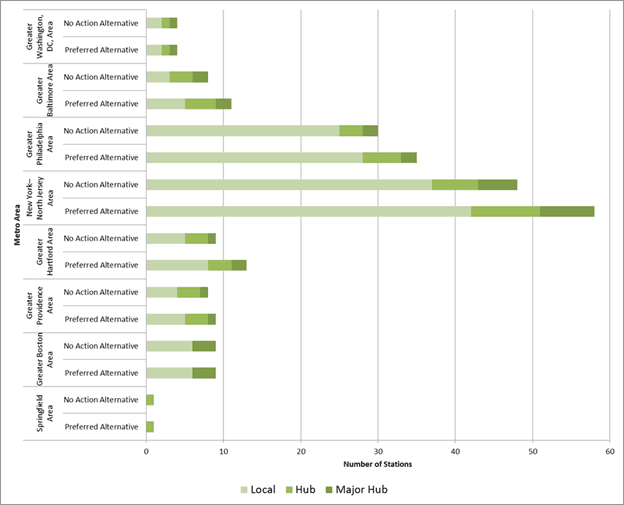
Source: NEC FUTURE team, 2016
Wilmington, DE, has the most-affordable business costs of any major metropolitan economy directly located on the NEC. Strategically located between higher-cost Philadelphia and Baltimore and with a large industrial concentration of services that can be delivered to distant consumers (research and finance for example), frequent, moderately priced and reliable passenger transportation provides Wilmington firms and residents with greater flexibility in their location choices.

Adding flexibility in living and commuting patterns. Passenger rail coupled with greater teleworking allows experienced and educated entrepreneurs and consultants to live and work in lower-cost Wilmington while cultivating clients and business relationships throughout the Northeast megaregion.
Large corporations needing satellite offices. Existing Wilmington employers report difficulty filling positions from the existing labor pool. New offices will not locate here and risk facing strong competition for labor, tempering future growth in these industries. The provision of moderately priced frequent rail service would ease this labor constraint by allowing employers to draw from Baltimore and Philadelphia to a greater extent than currently possible.
Households seeking urban areas without the pressure of large cities. Living in a large urban area offers a wide range of housing, entertainment and retail options, but is not without the cost of living in a large, dense and often congested area. With frequent rail connections, Wilmington becomes an attractive urban alternative with ready access to the region's larger metropolitan destinations when needed.
Wilmington rail passengers would see an increase in the number of jobs accessible within a 45-minute travel time; in 2040 over 500,000 additional jobs would be accessible to residents of this market, about 30 percent more than expected under the No Action Alternative.
Station Area Planning
There is evidence of planning for rail and/or transit-oriented development (TOD) across the corridor. The greatest concentration is in the New York market, the area of the corridor that has had the greatest experience and success to date with such initiatives. Table 6-10 summarizes the percentage of counties covered by some type of planning activity.
Greater Baltimore and Greater Providence also stand out as markets that are proactively preparing to utilize rail investment as part of a larger economic development strategy. While there is ample time for a market to plan for rail or TOD between now and 2040, this is a current indicator of the market's focus and preparation. The working assumption is that those markets actively thinking about how to use rail as part of their development plan are the places most likely to develop around rail stations by 2040. Economic Development Workshop participants uniformly agreed that while rail service was an important contributor to economic development, many other factors need to be in place to have a full "development package." The most commonly noted economic development factors included the presence of good schools, low crime rates, availability of land, ability to assemble parcels, willing institutional and local government partners, the presence of transit services (preferably a variety of modes), appropriate zoning that permits sufficient density for developers to build, utilities, and supporting infrastructure such as sidewalks and parking.
Range of Pricing
The range of rail services available in a market is a proxy for the range of rail service prices - factor that developers consider when determining what type of construction to build for the market. Table 6-11 summarizes the range of services available in the markets under the No Action Alternative and the Preferred Alternative. The working assumption is that Intercity-Express would have the highest fares and Regional rail would have the lowest fares. Intercity-Corridor, which includes two classes of service (Metropolitan with a higher fare and Intercity with a lower one) would provide service for a medium fare, a cost that falls somewhere between Intercity-Express and Regional rail.
The Preferred Alternative has a greater number of Intercity-Express and Intercity-Corridor options overall when compared to the No Action Alternative. Thus, the Preferred Alternative serves the high-end market and offers more options in the mid-range of the market. These differences drive the type of development constructed near the stations (e.g., luxury residential and office or mid-range residential with mixed-use retail. For example, two of the markets that do not have Intercity-Express service are less attractive for office development and supporting business services than other markets served by the Preferred Alternative.
| Geographic Scale | Rail Transportation | Transit-Oriented Development | Preservation of Built or Natural Environments | Fully Compatible1 | Partially Compatible2 | Partially Compatible; TOD Development3 | Not Compatible4 | Number of Counties within the Metropolitan Area |
|---|---|---|---|---|---|---|---|---|
| Greater Washington Area | 23% | 23% | 23% | 23% | 0% | 0% | 77% | 22 |
| Greater Baltimore Area | 75% | 75% | 75% | 75% | 0% | 0% | 25% | 8 |
| Greater Philadelphia Area | 79% | 64% | 79% | 64% | 14% | 0% | 21% | 14 |
| New York-North Jersey Area | 85% | 85% | 85% | 85% | 0% | 0% | 15% | 26 |
| Greater Hartford Area | 60% | 60% | 60% | 60% | 0% | 0% | 40% | 5 |
| Greater Providence Area | 100% | 86% | 100% | 86% | 14% | 0% | 0% | 7 |
| Greater Boston Area | 70% | 70% | 70% | 70% | 0% | 0% | 30% | 10 |
| Springfield Area | 100% | 50% | 100% | 50% | 50% | 0% | 0% | 4 |
| Average/Total | 74% | 64% | 74% | 64% | 10% | 0% | 26% | 96 |
Source: NEC FUTURE team, 2016
Note:
The table summarizes the percentage of counties that have development
plans for each Metropolitan area that fall within the Affected Environment;
data is representative of current conditions.
1 Percentage of counties
that is compatible with all development plans (Fully Compatible)
2 Percentage of counties that is compatible with some but not all development
plans (Partially Compatible)
3 Percentage of counties that is partially
compatible and at least compatible with Transit-Oriented Development
4 Percentage of counties that is not compatible (either fully or partially)
TOD = transit-oriented development
| Geographic Scale | Range of Pricing | Number of Daily Intercity-Express Trains | Number of Daily Intercity-Corridor Trains | Regional Service (Y/N) | ||||
|---|---|---|---|---|---|---|---|---|
| No Action Alternative | Preferred Alternative | No Action Alternative | Preferred Alternative | No Action Alternative | Preferred Alternative | No Action Alternative | Preferred Alternative | |
| Greater Washington Area (Union Station) | Low-High | Low-High | 16 | 57 | 26 | 81 | Y | Y |
| Greater Baltimore Area (Baltimore Penn Station) | Low-High | Low-High | 16 | 33 | 26 | 81 | Y | Y |
| Greater Philadelphia Area (Philadelphia 30th Street Station) | Low-High | Low-High | 16 | 63 | 35 | 93 | Y | Y |
| New York-North Jersey Area (Penn Station New York) | Low-High | Low-High | 16 | 63 | 48 | 88 | Y | Y |
| Greater Hartford Area (Hartford Station) | Medium | Medium | 0 | 0 | 9 | 39 | Y | Y |
| Greater Providence Area (Providence Station) | Low-High | Low-High | 9 | 56 | 10 | 33 | Y | Y |
| Greater Boston Area (Boston South Station) | Low-High | Low-High | 9 | 56 | 10 | 38 | Y | Y |
| Springfield Area (Springfield Station) | Medium | Medium | 0 | 0 | 9 | 39 | N | Y |
Source: NEC FUTURE team, 2016
Note:
Numerical Count of Daily trains presented in this table represent one-directional
counts. Numerical Count of Daily trains for Penn Station New York, Philadelphia
30th Street Station and Washington, D.C., Union Station may be lower
than the actual train counts. The working assumption is that Intercity-Express
would have the highest cost and Regional rail would have the lowest
cost. Intercity-Corridor would provide service for a cost that falls
somewhere between Intercity-Express and Regional rail. Intercity-Corridor
service includes Metropolitan service
Rail Capacity
Innovation Districts
Rail is a key asset to emerging "innovation districts" along the Northeast Corridor, within which economic growth is increasingly taking place. Some examples of innovation districts along the Northeast Corridor include neighborhoods in Boston, Philadelphia, and Newark, DE. These districts provide an environment for new firms to locate in established urban environments and support the creation of new jobs. The Northeast Corridor Commission report entitled Investing in the Northeast Corridor: Advancing the American Economy explores these districts in more detail.
The frequency of train service was highlighted in the Economic Development Workshops as one of the most desirable service features, following reliability. The ability to make plans without having large service gaps in the schedule made rail service more attractive. Moreover, in those markets that can already accomplish a day trip to New York by rail, frequency of service was more important than speed for prospective travelers.
Table 6-12 summarizes the number of additional daily trains serving the market for the No Action Alternative and Preferred Alternative. Greater Philadelphia would gain the largest increases in new daily trains under the Preferred Alternative. Consistent with other markets' preferences to access the Greater New York market, New York would gain significant increases in new daily trains in the Preferred Alternative. Setting New York aside, the greatest net gains (net of the No Action) in the Preferred Alternative would be in the Greater Washington, Greater Baltimore, Greater Providence, and Greater Boston markets, although all major metropolitan markets would achieve some gain.
| Hub Station | No Action Alternative | Preferred Alternative | % Change |
|---|---|---|---|
| Greater Washington Area (Union Station) | 42 | 138 | 229% |
| Greater Baltimore Area (Baltimore Penn Station) | 42 | 114 | 171% |
| Greater Philadelphia Area (Philadelphia 30th Street Station) | 51 | 156 | 206% |
| New York-North Jersey Area (New York Penn Station) | 64 | 151 | 135% |
| Greater Hartford Area (Hartford Station) | 9 | 39 | 333% |
| Greater Providence Area (Providence Station) | 19 | 89 | 366% |
| Greater Boston Area (Boston South Station) | 19 | 94 | 395% |
| Springfield Area (Springfield Station) | 9 | 39 | 333% |
Source: NEC FUTURE team, 2016
Note:
Numerical Count of Daily trains presented in this table represent
one-directional counts. Train counts include Intercity-Express and Intercity-Corridor
services and do not include Regional service.
With fewer than 40,000 residents, Odenton is one of the smaller communities along the NEC. It is strategically located within a 30-minute MARC train ride of Baltimore and Washington, D.C., and within a 20-minute drive of Annapolis (the state's capital and a tourist destination). Odenton benefited from the 2005 Federal Base Realignment and Closure (BRAC) Initiative since numerous federal positions were relocated to the Fort George G. Meade military base adjacent to the Odenton Town Center. The National Security Agency and the U.S. Cyber Command are also located at Fort Meade. Odenton is one stop from the BWI station on the MARC Penn Line.
Value of Additional Rail Capacity. Odenton already has frequent regional rail service (approximately 50 daily trains stop in Odenton). These are regional commuter trains: the Penn Line runs from Washington, D.C., to Baltimore and on to Perryville, MD. The service is popular and Odenton's parking lots regularly fill and turn away would-be rail passengers. One of the benefits of the Preferred Alternative is the expansion of rail capacity through the corridor that would provide additional "slots" to regional transit providers as well as Intercity trains. The ease of access to the defense complex located in Washington, D.C., has allowed the NSA and the U.S. Cyber Command to locate at Fort Meade and still fulfill its mission. A 33-mile trip between Odenton, MD, and the Pentagon can reliably be accomplished by train in under an hour (about 50 minutes). By contrast, a 33-mile highway trip between the Pentagon and Quantico, VA, along the I-395/I-95 corridor may take significantly longer with much more variable trip times that can easily reach 75 minutes. The availability of the rail connection has permitted major defense agencies and the private contracting community to locate in Odenton, bolstering the economy and offering an unusual concentration of technical and professional jobs for a comparatively small community. While Odenton has comparatively frequent regional service to Washington, D.C., and Baltimore, Intercity trains do not stop at the Odenton Station. Odenton passengers must drive to BWI to catch an Intercity train.
Odenton rail passengers would see a sharp expansion of Intercity-corridor service that complements their existing Regional rail service. The introduction of Intercity rail service within Odenton intensifies the advantage of locating here, allowing firms to reach beyond the Washington, D.C. - Baltimore market. Under the Preferred Alternative, Odenton-based firms would be able to expand their 30-minute travel shed to both Baltimore and Washington, D.C., with a direct connection. This permits the region's cluster of high-tech and defense-related industries to expand and diversify further. Because of the proximity to BWI and Fort Meade, Odenton is able to use rail as part of a strategy to attract employment, rather than serving more as labor supplier to the broader regional market.
Travel to and from New York City would improve under the Preferred Alternative. The number of Intercity trains to New York City would increase from zero under the No Action Alternative to 56 under the Preferred Alternative. The shortest trip time between Odenton and New York City would be about 2 hours 40 minutes.
Accessibility (Direct Connections)
Aside from the comparative time savings associated with a direct connection versus transfer, a direct connection was perceived to reduce the risk of delay by participants in the Economic Development Workshops. Moreover, locations with ready direct access to a variety of markets were favored for private development. In addition, because of the greater ease of access, market locations with higher densities of direct connections to other markets have greater agglomeration potential, all else being equal. Relative to the No Action Alternative, Greater Boston would see the greatest increase in new direct connections under the Preferred Alternative (21 new direct connections). Greater Hartford and Springfield would also see a substantial increase (17 new direct connections, relative to the No Action Alternative).
Table 6-13 summarizes the change by market and alternative.
| Hub Station | No Action Alternative | Preferred Alternative | % Change |
|---|---|---|---|
| Greater Washington Area (Union Station) | 39 | 50 | 28% |
| Greater Baltimore Area (Baltimore Penn Station) | 39 | 50 | 28% |
| Greater Philadelphia Area (Philadelphia 30th Street Station) | 40 | 50 | 25% |
| New York-North Jersey Area (New York Penn Station) | 40 | 50 | 25% |
| Greater Hartford Area (Hartford Station) | 24 | 41 | 71% |
| Greater Providence Area (Providence Station) | 29 | 43 | 48% |
| Greater Boston Area (Boston South Station) | 29 | 50 | 72% |
| Springfield Area (Springfield Station) | 24 | 41 | 71% |
Source: NEC FUTURE team, 2016
Note:
Numerical Count of Daily trains presented in this table represent
one-directional counts. Connections include Intercity-Express and Intercity-Corridor
services and do not include Regional service.
In addition to the number of new destinations directly accessible via rail, the frequency of that new service would affect ridership. For example, one direct train connection a day to a new destination is not as beneficial as 20 direct train connects. Table 6-14 summarizes the frequency of new direct connections (defined as number of direct connections times the number of trains making those direct connections). Overall, the Preferred Alternative would offer a large increase relative to the No Action Alternative. Regionally, the north and central regions of the corridor would experience the greatest increase. In the south sub-region, Philadelphia would experience the highest increases in frequency to directly accessible markets. Washington, D.C., would benefit from its role as a Major Hub and the southern terminus and Baltimore, MD would experience modest increases in frequency to directly accessible markets under the Preferred Alternative.
| Hub Station | No Action Alternative | Preferred Alternative | % Change |
|---|---|---|---|
| Greater Washington Area (Union Station) | 500 | 670 | 34% |
| Greater Baltimore Area (Baltimore Penn Station) | 546 | 648 | 19% |
| Greater Philadelphia Area (Philadelphia 30th Street Station) | 355 | 668 | 88% |
| New York-North Jersey Area (New York Penn Station) | 345 | 883 | 156% |
| Greater Hartford Area (Hartford Station) | 72 | 339 | 371% |
| Greater Providence Area (Providence Station) | 323 | 438 | 36% |
| Greater Boston Area (Boston South Station) | 323 | 496 | 54% |
| Springfield Area (Springfield Station) | 72 | 339 | 371% |
Source: NEC FUTURE team, 2016
Note:
Numerical Count of Daily trains presented in this table represent one-directional
counts. Values are the number of direct connections times the number
of trains making those direct connections. The calculations account
for trains/frequencies that are removed when certain connections are
discontinued in the Preferred Alternative. Connections include Intercity-Express
and Intercity-Corridor services, but do not include Regional rail service.
Trains Traversing New York Region
In the large New York market, it can be difficult to access some destinations by rail without multiple transfers. Thus, the concept of the City Region User arose out of the Economic Development Workshops. As a proxy for how the alternatives would help mobility within the market, the analysis considered the number of Intercity (non-Regional) connections between the following: Long Island to Connecticut, Long Island to New Jersey, and New Jersey to Connecticut. Since the Preferred Alternative does not include a route via Long Island, Long Island would not gain any new connections to the broader region under the Preferred Alternative. However, connections would improve between New Jersey and Connecticut under the Preferred Alternative since two new station pairs between these areas would be served by direct Intercity rail service.
Travel Time to New York City
The ability to make a day trip to New York City from locations along the corridor is an important metric for that market's ability to support the New York City market and also to benefit from its own comparatively lower business costs to attract businesses that complement the headquarters and high valued added activities in the New York City core. Table 6-15 summarizes the changes in travel times across the No Action Alternative and Preferred Alternative by market. The analysis considered the shortest travel times to Penn Station New York from a selected Hub station within a given metro area. While most markets would see some improvement in travel times to New York City under the Preferred Alternative, the northern part of the corridor would see the greatest gains. In addition, between Boston South Station and Penn Station New York, the Preferred Alternative would improve travel time over the No Action Alternative sufficient to permit rail travelers to easily make a round trip in a day - an important threshold for business travelers.
While the region is working to deepen its local commercial base, access to New York City remains an essential economic advantage for this high-cost economy.

Credit: Springfield Redevelopment Authority, http://www.springfield-ma.gov/planning/index.php?id=union_station
A connected labor market. Reliable rail service that connected Hartford, Springfield (and New Haven) would change how the cities work together. Because of the region's high costs, its focus has to be on knowledge-based industries where face-to-face interaction is still important. These are the anchors of the regional economy as it is transforming itself. The ability to link the three cities or better link them to larger markets has two types of labor market effects. The first is to simplify the ability of workers to access an expanded range of work opportunities. The second is the ability to demonstrate a larger pool of available labor, which supports business recruitment and retention. It also allows the region to reach for larger-sized relocations.
Ability to offer amenities to high-skilled and mobile workers. Many parts of the nation are developing technology and bio-research capabilities. The ability of the region's firms to compete for these workers is aided by reliable and affordable rail service to New York City and the surrounding region as mitigation to congestion but also as a way to access the full range of recreational and entertainment options offered here. Absent this positive benefit, the region's high costs will encourage the technology industry to leave the region for more livable markets with similar technology opportunities.
"This will create long-term jobs in Connecticut."
"Springfield's Union Station is an all-important north-south
and east-west rail hub for the region's future economic development
success"
Hartford, CT, and Springfield, MA, rail passengers would see a sharp expansion of moderately priced intercity corridor service - using trips to New York City as an example, the number of trains would rise from 2 to 35 under the Preferred Alternative. But just as importantly, the convenience of the trip would be enhanced. With electrification, travelers would no longer need to transfer at New Haven.
| Station | In hours and minutes | % Change | |
|---|---|---|---|
| No Action Alternative | Preferred Alternative | ||
| Washington Union Station | 2:45 | 2:15 | 18% |
| Baltimore Penn Station | 2:10 | 1:50 | 15% |
| Philadelphia 30th Street | 1:10 | 0:55 | 21% |
| Hartford | 2:55 | 1:55 | 34% |
| Providence Station | 2:55 | 2:10 | 26% |
| Boston South Station | 3:30 | 2:45 | 21% |
| Springfield Union Station | 3:30 | 2:30 | 31% |
Source: NEC FUTURE team, 2016
Number of New Trains to New York City
Rail capacity to the New York City market is also considered (Table 6-16). For most markets, the Preferred Alternative would offer the greatest number of trains and the largest increase in service to New York City. Increased frequency to New York City would provide important support for the health of the New York City market since it aids intra-regional connectivity.
| Geographic Scale | No Action Alternative | Preferred Alternative | % Change |
|---|---|---|---|
| Greater Washington Area | 13 | 75 | 472% |
| Greater Baltimore Area | 11 | 56 | 396% |
| Greater Philadelphia Area | 13 | 70 | 446% |
| New York-ÂNorth Jersey Area | 7 | 54 | 705% |
| Greater Hartford Area | 3 | 22 | 665% |
| Greater Providence Area | 6 | 42 | 617% |
| Greater Boston Area | 8 | 39 | 411% |
| Springfield Area | 2 | 35 | 1,650% |
Source: NEC FUTURE team, 2016
Note:
Counts in the table represent the average number of trains to New
York City (for a metropolitan area, average number of trains per station).
Train counts include Intercity-Express and Intercity-Corridor services
and do not include Regional service.
Number of Airports Served by Rail Link
Airports serve as gateways to the national and global economy. Excluding Regional rail, the No Action Alternative includes two air-rail links where Intercity rail offers an efficient landside connection. The Preferred Alternative would add two air-rail links at T.F. Green Airport in Providence, RI, and Philadelphia International Airport.
New York City, NY, has the highest business and living costs of any major metro economy directly located on the NEC and in the United States. Strategically located in the middle of the corridor with a large concentration of headquarters operations with a large office and retail industry, as well as local services for the large tourist and resident population (restaurants, cleaners, barbers, etc.) reliable passenger transportation provides New York City's firms with essential access to a labor market and residents with greater flexibility in their housing choices.
Supports City Region Users. Households in the broad New York City region will have access to a greater range of employment, shopping, entertainment, and recreational options from their residential area within the region. Greater mobility allows a typical resident of the region to expand their range of activities in the local economy - making the region more attractive for households and supporting local consumption and associated economic activity. Thus, residents who pay a high cost of living to be in the New York City region will be better able to access the range of amenities, recreational and entertainment opportunities associated with that high cost.
Long-term competitiveness. The ability of New York City's commercial base to expand is directly related to its ability to effectively access the surrounding labor market - both to maintain its existing base and to grow. Particularly in a service- and knowledge-based economy, such as New York City, access to skilled labor is essential for its continued health.
Households seeking access to New York City's opportunities. Living in a large urban area offers a wide range of housing, entertainment and retail options, but is not without the cost of living in a large dense and often congested area. With frequent rail connections, households are able to select less costly housing alternatives and still access the range of employment opportunities and comparatively higher wages offered in New York.
"Select investment packages that enable and encourage economic growth. While the travel-time savings among the alternatives is similar, Alternatives 2 and 3 greatly increase regional job accessibility for residents in New York City and the surrounding metropolitan area."
New York City rail passengers would see a sharp expansion of moderately priced Intercity-Corridor service. Using trips to Newark, NJ, as an example, the number of non-Intercity-Express trains would increase from 35 under the No Action Alternative to 93 under the Preferred Alternative.
Improved rail service also creates the potential for labor markets to become more interlinked as additional places fall within a 45- minute travel shed.
Table 6-17 summarizes a representational change in labor pools that would be reachable by 45 minutes of travel by the No Action Alternative and Preferred Alternative for the Major Hub stations in each market considered. The table shows that the greatest gains in accessibility would be located in the markets located in the center of the corridor where the "market reach" extends in two directions. Thus, residents using Penn Station New York, Newark and Trenton, NJ, and Philadelphia, PA, would gain access to over 1 million jobs under the Preferred Alternative. The population accessible from each of these stations (Table 6-18) would increase by over 3 million. Among smaller markets, Wilmington, DE, Baltimore, MD, and New Haven, CT, would see the largest gains.
| Hub Station | No Action Alternative | Preferred Alternative | % Change |
|---|---|---|---|
| Washington Union | 1,670,000 | 1,830,000 | 9% |
| Baltimore Penn Station | 1,600,000 | 1,960,000 | 22% |
| Wilmington Station | 1,570,000 | 2,080,000 | 33% |
| Philadelphia 30th Street | 2,000,000 | 3,780,000 | 89% |
| Trenton | 3,180,000 | 4,630,000 | 45% |
| Newark Penn Station | 5,090,000 | 6,480,000 | 27% |
| Penn Station New York | 3,410,000 | 4,860,000 | 42% |
| New Haven | 820,000 | 1,120,000 | 37% |
| Hartford | 640,000 | 740,000 | 16% |
| Boston South Station | 910,000 | 960,000 | 6% |
| Springfield Union | 420,000 | 420,000 | 0% |
Source: NEC FUTURE team, 2016
Note:
Counts shown exclude Regional rail service. Job counts are representative
of those within a 10-mile radius of stations accessible in a 45-minute
travel time, exclusive of jobs surrounding the origin station. Estimates
are based on 2040 employment data and were adjusted where station buffers
overlap.
| Hub Station | No Action Alternative | Preferred Alternative | % Change |
|---|---|---|---|
| Washington Union | 3,590,000 | 3,890,000 | 8% |
| Baltimore Penn Station | 3,400,000 | 4,180,000 | 23% |
| Wilmington Station | 3,690,000 | 4,680,000 | 27% |
| Philadelphia 30th Street | 4,510,000 | 8,230,000 | 83% |
| Trenton | 7,050,000 | 10,110,000 | 43% |
| Newark Penn Station | 11,090,000 | 14,420,000 | 30% |
| Penn Station New York | 7,530,000 | 10,580,000 | 40% |
| New Haven | 1,670,000 | 2,290,000 | 37% |
| Hartford | 1,310,000 | 1,520,000 | 16% |
| Boston South Station | 1,920,000 | 2,030,000 | 6% |
| Springfield Union | 840,000 | 840,000 | 0% |
Source: NEC FUTURE team, 2016
Note:
Counts shown exclude Regional rail service. Job counts are representative
of those within a 10-mile radius of stations accessible in a 45-minute
travel time, exclusive of jobs surrounding the origin station. Estimates
are based on 2040 population data and were adjusted where station buffers
overlap.
Indirect effects, as defined in regulations promulgated by the Council on Environmental Quality (CEQ), are those effects that "...are caused by the action and are later in time and farther removed in distance, but still reasonably foreseeable." An indirect effects analysis can include "induced-growth effects" as well as "encroachment/alteration effects." Induced-growth effects include effects related to changes, induced by implementation of an alternative, in the pattern of land use, population density or growth rate, and related effects on air and water and other natural systems, including ecosystems; encroachment/alteration effects are proximity effects caused by implementation of an alternative (e.g., effects on natural habitats caused by changes in air quality, noise/vibration, etc.). The FRA analysis examined indirect effects of the Preferred and No Action Alternatives by examining their induced-growth effects. Encroachment and other types of proximity effects of the Preferred Alternative are examined as part of the direct effects analysis for each resource.
Indirect Effects may occur in areas that have high potential for induced growth. Generally, the potential for induced growth, and thus indirect effects, to occur is greater in areas that:
The degree to which areas perform with regard to the factors noted above, as well as the following two factors, would influence the type of induced growth and the range of indirect effects that would result from that growth:
The character of the land around the station (i.e., developed, undeveloped, mixed) and available space for development could also influence the potential and type of induced growth. In general, the areas around existing stations along the NEC are developed or are characterized by a mix of developed and undeveloped land. In areas that are heavily developed, induced growth could take place in urban infill locations (i.e., vacant land within existing built environments). Induced growth in urban infill locations would likely increase the density of the existing developed environment. In areas characterized by a mix of developed land closest to the station and undeveloped land on the fringe, induced growth could occur in urban infill locations closest to the station as well as on the undeveloped land on the fringe. In areas that are characterized by an even mix of developed and undeveloped land around the station, development pressures and induced growth may occur on the undeveloped land. In the cases where most of the land around the station is undeveloped, induced development is likely to occur. The type and amount of development depends on additional factors noted below.
Induced growth could encourage positive investment in resources or put a strain on resources within the Affected Environment. The potential to cause effects on certain types of resources differs based on if induced growth occurs on developed land versus undeveloped land. Generally, the potential to cause effects on the built and human environment is higher where induced growth occurs on developed land. The potential to cause effects on the natural environment and historic/cultural resources is higher where induced growth occurs on undeveloped land. A bulleted list of the types of indirect effects that could occur on developed versus undeveloped land types is provided below.
The types of indirect effects of induced growth on developed land would likely include the following:
The types of indirect effects of induced growth on undeveloped land would likely include the following:
In addition, there are potential induced-growth effects regardless of characterization of land cover type as developed or undeveloped:
The indirect effects analysis focuses on the potential for induced growth, particularly in the metropolitan areas served by the Preferred Alternative. The analysis examines how the Preferred Alternative and No Action Alternative perform with regard to the factors identified in Section 6.3.6.1 that influence the potential, type, and amount of induced growth.
Potential for Induced Growth for the Preferred Alternative
The indirect effects analysis focuses on the potential for induced growth, particularly in the metropolitan areas served by the Preferred Alternative.
Potential for Induced Growth Spurred by Improvements in Station Area Connectivity: The Greater New York-North Jersey, Greater Philadelphia, Greater Baltimore, and Greater Hartford markets would have the greatest gains in the number of stations. Moreover, each would gain one or more Hub or Major Hub stations, which would be focal points for development in the surrounding area. Hubs support greater development intensity than stations with just rail service. These stations have potential for indirect effects to occur as a result of induced growth.
Potential for Induced Growth Spurred by Improvements in Rail Capacity and Accessibility: Potential for induced growth spurred by additional rail capacity under the Preferred Alternative would be greatest in the north region of the corridor, with the highest potential in the Greater Boston Area, followed by the Greater Providence Area, and Greater Hartford and Springfield Areas. Rail capacity would more than quadruple in these areas. While there is still potential for induced growth attributed to these factors in other metropolitan areas along the Preferred Alternative, the potential would be lower even though increases in rail capacity would double, and in the case of the Greater Washington and Philadelphia Areas, triple.
Potential for induced growth spurred by additional accessibility to rail under the Preferred Alternative would also be greatest in the north region of the corridor. However, the Greater Hartford and Springfield Areas would by far have the greatest gains in accessibility because of growth in frequency of direct connections. The New York-North Jersey Area would also see significant improvements in accessibility - frequency of direct connections would more than triple, increasing likelihood of potential for induced growth.
Potential for Induced Growth Spurred by improvements in travel time and rail capacity to New York City: Potential for induced growth spurred by these improvements under the Preferred Alternative would be greatest for the north region of the corridor as well. Travel times to Penn Station New York would improve by over 30 percent from Hartford, CT, and Springfield, MA, and by over 25 percent from Providence Station. Additional rail capacity to New York City would be greatest for the Greater Springfield Area, followed by the Greater Hartford and Providence Areas.
Indirect Effects Around Representative Station Areas - Wilmington Station
Wilmington Station in Delaware would be maintained as a Major Hub station in the Preferred Alternative. The character of the land surrounding the existing station is developed, which indicates that there would be little physical space for development and that development would occur in urban infill locations. (Refer to Section 6.3.6.1 for types of indirect effects that could occur on developed land near the station.) In addition, hydrologic and ecological resources to the south and east of the station could either constrain development opportunities or be adversely affected by induced growth.
Potential Indirect Effects in Three Metropolitan Areas
The following case studies present three different scenarios of potential for indirect induced growth effects under the Preferred Alternative.
Greater Baltimore Area
The Greater Baltimore Area is forecast to see population and employment growth ranging from approximately 15 to 20 percent, which is higher than most other metropolitan areas along the Preferred Alternative. Also, urban planning in 75 percent of the counties in this area is guided by goals, objectives, and recommendations regarding improving rail transportation, TOD, and preservation of the built or natural environments. Thus, the Greater Baltimore Area is growing and the area is well prepared to respond to growth attributable to the Preferred Alternative.
Under the Preferred Alternative, the Greater Baltimore Area would
experience increases in station area connectivity, rail capacity, and
accessibility. Although these increases are comparably lower than increases
in other locations, they would increase the potential for induced growth
to occur in the Greater Baltimore Area.
In addition, as noted in Section 6.3.5.1, the Greater Baltimore Area would experience a large increase in Intercity-Corridor service, relative to the No Action Alternative, which could support mixed-use residential and retail development near stations in the Greater Baltimore Area. The type of development that occurs would have indirect effects on the surrounding community and supporting infrastructure and services. For example, mixed-use development could require an increase in transit services that operate not only during peak hours, but also throughout the day to serve various trip purposes (e.g., home, work, retail).
Although the above factors indicate a potential for induced growth to occur in the Greater Baltimore Area, the potential for induced growth could be hindered, and the potential for indirect effects to occur reduced, by existing transportation network conditions. In the Baltimore Economic Development Workshop held in October 2014, participants identified circulation within Baltimore and the ability to access Baltimore's station as key concerns. Participants noted that transportation network conditions makes access to the station difficult and that such accessibility concerns are a limiting factor on Baltimore's ability to capitalize on potential rail development.
New York-North Jersey Area
Indirect Effects Around Representative Station Areas - Odenton Station
Odenton Station, in Maryland, would be upgraded from an existing Local station to a Hub station in the Preferred Alternative. The character of the land surrounding the existing station is mixed (developed and undeveloped), which indicates that there would be physical space for development. (Refer to Section 6.3.6.1 for types of indirect effects that could occur on mixed [developed and undeveloped] land near the station.) However, ecological resources and agricultural lands surrounding the station could either constrain development opportunities or be adversely affected by induced growth.
The New York-North Jersey Area is forecast to see population and employment growth of approximately 12 percent, which is close to the average for population and employment growth in the Affected Environment. Also, urban planning in 85 percent of the counties in this area is guided by goals, objectives, and recommendations regarding improving rail transportation, TOD, and preservation of the built or natural environment. These are indicators that the New York-North Jersey Area is growing at the same pace as the Northeast as a whole and is positioned to respond to growth.
In addition, the area would see potential for induced growth based on improvements attributable to the Preferred Alternative. As previously stated, this area would see great improvements in accessibility-frequency of direct connections would more than triple-increasing likelihood of potential for induced growth.
Further, as noted in Section 6.3.5.1, the New York-North Jersey Area would be served by the greatest number of Intercity-Express options under the Preferred Alternative, which could serve the high-end market to a greater extent. The type of development that would occur would have indirect effects on the surrounding community and supporting infrastructure and services. For example, luxury residential development around station areas could have effects on EJ populations, such as those that derive from limiting the development of affordable and/or low-income housing.
Although the above factors indicate a potential for induced growth to occur in the New York-North Jersey Area, this potential could still be hindered, and the potential for indirect effects to occur reduced, by difficulties of planning for station area development. In the New Jersey and New York City Economic Development Workshops held in October 2014, participants identified fragmented planning across the state of New Jersey and along the corridor as a major impediment to obtaining a full return on rail investment.
Greater Hartford Area
The Greater Hartford Area would see some of the highest growth in
rail service and accessibility under the Preferred Alternative than
any other metropolitan area evaluated, and thus has high potential for
induced growth and development not only in the immediate station area
but in areas within reasonable commute times to the train station.
Indirect Effects Around Representative Station Areas - Hartford Station
Hartford Station in Connecticut would be upgraded from an existing Hub station to a Major Hub station in the Preferred Alternative. The character of the land surrounding the existing station is mixed (developed and undeveloped), which indicates that there would be physical space and opportunity for development. Growth in urban infill locations could encourage positive investment in or a strain on resources within the built and human environment and growth on undeveloped land could result in effects on the natural environment.
Under the Preferred Alternative, a medium-fare service and added Intercity-Corridor service suggests potential for mixed-use residential and retail, with less focus on office and business travel due to the lack of express trains. This development opportunity could have indirect effects on the existing community and supporting infrastructure and services provided. In the New Haven, Hartford, and Springfield Economic Development Workshop held in October 2014, which explored the Action Alternatives, participants noted that in some cases significant utilities, zoning, and investment in supportive infrastructure would be required.
Although the above factors indicate a potential for induced growth to occur in the Greater Hartford Area, the area may face challenges in responding to growth attributable to the Preferred Alternative for the following reasons:
These factors could collectively influence the nature of indirect effects, should growth occur in a manner that is not consistent with desired station area planning or that does not optimally capitalize on the rail investment.
Potential Indirect Effects along Connecting Corridors
Once a train from a connecting corridor reaches the NEC, it benefits from investments made under the Preferred Alternative. Thus, areas along connecting corridors could also experience indirect effects. For example, since the Preferred Alternative would reduce trip time between Harrisburg, PA, and New York City by over a half-hour relative to the No Action Alternative, Harrisburg could experience induced growth. The types of indirect effects resulting from induced growth in these areas would be the same as those described for the metropolitan areas served by the Preferred Alternative. However, the indirect effects along connecting corridors could be less intense than the indirect effects that could occur in metropolitan areas served by the Preferred Alternative, since the Preferred Alternative does not make any additional capital or operating investments to these connecting corridors. For example, the half-hour of travel-time savings between Harrisburg and New York City represents a 14 percent reduction relative to the No Action Alternative, which is lower than the travel-time savings realized along metropolitan areas served by the Preferred Alternative. Thus, potential for induced growth and indirect effects could be lower in Harrisburg than in areas served directly by the Preferred Alternative.
Potential Indirect Effects on Freight and Connecting Regional Rail and Transit Operations
The Preferred Alternative has the potential to induce growth in many markets throughout the Northeast, which could increase demand for Regional rail and other transit services within the Study Area and have indirect effects on these operations and infrastructure. The following list provides examples of where these types of effects could occur in the Study Area:
Train volumes could also increase on rail corridors that connect to the Preferred Alternative and that provide for mixed passenger and freight operations. Induced growth could also increase or shift demand for consumer goods, which could affect freight rail operations as well.
Rail and transit operators that operate within the Study Area may need to respond as demand increases for passenger rail, freight rail, and transit services. For example, transit service providers could respond to increases in demand by expanding service and making improvements in infrastructure, station amenities, and ancillary facilities such as parking facilities and traction power substations.
While the Preferred Alternative has the potential to influence changes in land development patterns and uses associated with growth, decisions related to proposed development and the approval of development would occur at the local level. Many of the areas within the NEC FUTURE Study Area have planning initiatives in place to prepare for growth. Such initiatives may use this document and the subsequent NEC FUTURE Service Development Plan to account for planned improvements in passenger rail as they continue to be developed and/or refined. Furthermore, the following mitigation strategies implemented at the local level could further help minimize indirect effects that would occur:
In addition, local-level governments could garner support from regional, state, and federal agencies for funding to assist in local planning efforts to prepare for growth and implement mitigation strategies to minimize indirect effects.
Subsequent Tier 2 project analysis will require more-detailed data gathering at the local level to determine more-specific indirect effects associated with potential induced growth around a station area.
In addition, the FRA did not evaluate community-specific resources or infrastructure in this Tier 1 Final EIS. Induced growth could place additional strain on these resources and existing resources may not be sufficient to support the amount of growth that could occur in these areas. Additional analysis regarding these types of resources will be required during Tier 2 project analyses.
1 The NEC Rail Network collectively refers to the NEC Spine and its connecting rail corridors, including the Hartford/Springfield Line.
2 The potential direct and total employment impacts are based on the RIMS II multiplier analysis. (See Appendix D for more details on RIMS II.)
3 The employment effects of the No Action Alternative and Preferred Alternative are expressed in job-years, which is defined as one full-time job for one person for one year. For example, three job-years are equal to three people doing a job for one year, or one person doing a job for three years.
4 Estimated by dividing the total job-years (1,439,600, which equals the lower range of job-years within the Affected Environment plus the job-years within the U.S., but outside the Affected Environment) by an assumed 25-year construction period.
5 Estimated by dividing the average total jobs per year (57,600) by 250 employees in a typical Walmart.
6 Calculated by totaling the earnings in the Affected Environment and the US-Outside Affected Environment.
7 Assumes that the rolling stock is manufactured in the United States, but outside of the Affected Environment.
8 Calculated by dividing the Preferred Alternative earnings ($70.2 billion) by total employment in job-years (1,439,600).
9 Calculated by dividing the No Action Alternative earnings ($14.11 billion) by total employment in job-years (295,650).
10 Budget, O. O. (2015). Historical Tables. Retrieved 2015, from Table 10.1 - Gross Domestic Product and Deflators Used in the Historical Tables: 1940-2020: https://www.whitehouse.gov/omb/budget/Historicals
11 Value of Time for Local Travel All purposes in 2013 dollars was $13.00 and converted to 2014 dollars using the GDP Deflator. This value of time was used because trip purpose and wages and income were not available to the same degree of detail in the Regional analysis as in Intercity. As a result, the national average, per U.S. DOT guidance, was used. Source: Transportation, U. D. (n.d.). Revised Departmental Guidance on Valuation of Travel Time in Economic Analysis. Retrieved from http://www.transportation.gov/sites/dot.gov/files/docs/Revised%20Departmental%20Guidance%20on%20Valuation%20of%20Travel%20Time%20in%20Economic%20Analysis.pdf
12 "Food and kindred product," which includes a range of activities related to food preparation and distribution, is one of the defined industry groups tracked by the Surface Transportation Board (STB) in its data on freight traffic flows.
13 Northeast Corridor Commission. February 2016, "Investing in the Northeast Corridor: Advancing the American Economy," page 23.
The information posted on this website includes hypertext links or pointers to information created and maintained by other public and/or private organizations. The FRA provides these links and pointers solely for information and convenience. When users select a link to an outside website, they are leaving the NEC FUTURE website and are subject to the privacy and security policies of the owners/sponsors of the outside website. The FRA does not control or guarantee the accuracy, relevance, timeliness or completeness of information contained on a linked website, or endorse the organizations sponsoring linked websites, the views they express, or the products/services they offer. The FRA cannot authorize the use of copyrighted materials contained in linked websites and is not responsible for transmissions users receive from linked websites.