Energy is an important resource for the nation's economy, and the conservation of energy is vital to the U.S. Department of Transportation's and the Federal Railroad Administration's (FRA) goals of environmental sustainability, clean air, and the reduction of greenhouse gases (GHG). Transportation uses energy to move people and goods, and accounts for a large portion of the total energy consumed within the NEC FUTURE Study Area (Study Area). A new executive order that promotes energy efficiencies in federal agencies was issued since the publication of the Tier 1 Draft Environmental Impact Statement (Tier 1 Draft EIS): Executive Order 13693, Planning for Federal Sustainability in the Next Decade (EOP 2015)
This chapter reflects the analysis prepared by the FRA to understand energy usage associated with the Preferred Alternative. The FRA calculated potential regional energy usage of the trains based on changes in train vehicle-miles and average energy requirements of passenger trains, as detailed in the Transportation Energy Data Book (Edition 33). The energy impacts caused by changes in air travel and construction are discussed qualitatively. Volume 2, Appendix E.14, provides the effects-assessment methodology to assess energy usage.
Under the Preferred Alternative, roadway energy would decrease, whereas the energy for electric trains would increase. The Preferred Alternative exhibits a greater decrease in overall energy use compared to the decreases of the Action Alternatives analyzed in the Tier 1 Draft EIS (Volume 2). Changes in energy use of diesel trains would be much smaller in scale than the changes in energy use from autos and electric trains, as shown by the relatively small change that would be caused by the Preferred Alternative. The shifts in energy usage are related to the following:
The FRA has updated the data provided for the Tier 1 Draft EIS (see Volume 2, Chapter 7.14) to reflect the latest energy information collected by the United States Energy Information Administration (EIA).
Energy information is updated yearly by the EIA. As such, the data in the following tables and pie charts have been updated to the latest available information (2013). Therefore, the data may be different from that presented in Volume 2, which reflects 2012 energy data.
Energy consumption per capita varies among the states and districts within the Study Area. In 2013, Delaware and Pennsylvania tied for the highest energy consumption per capita for states along the NEC (although 28th in the nation), and Rhode Island and New York tied for the lowest consumption for states along the NEC (Table 7.14-1).
| Geography | Consumption per Capita (million Btu) |
Consumption per Capita, Rank (out of 50 states and Washington, D.C.) |
Consumption per Capita, Rank (out of 8 states and Washington, D.C.) |
|---|---|---|---|
| D.C. | 263 | 36 | 2 |
| MD | 236 | 40 | 4 |
| DE | 297 | 28 | 1 |
| PA | 297 | 28 | 1 |
| NJ | 260 | 37 | 3 |
| NY | 184 | 50 | 7 |
| CT | 208 | 46 | 5 |
| RI | 184 | 50 | 7 |
| MA | 215 | 43 | 6 |
Source: United States Energy Information Administration, 2016.
Transportation accounts for a significant portion of the energy consumed in the Study Area. Energy usage for transportation accounts for approximately 11 - 37 percent of the states' energy consumption within the Study Area (Figure 7.14-1).
Table 7.14-2 indicates that in 2013 in the United States, light vehicles (cars, light trucks, and motorcycles) accounted for the largest percentage of transportation energy use (58.0 percent). Medium- and heavy-duty trucks accounted for the next largest percentage of total transportation energy use (22.7 percent). When including buses (0.8 percent of total transportation energy use), on-road vehicles accounted for over 80 percent of total transportation energy. Of the remaining non-roadway modes of transportation, aircrafts accounted for 7.8 percent of the total, watercrafts accounted for 4.0 percent, pipelines accounted for 4.4 percent, and rail accounted for 2.3 percent.
| Mode | Consumption (trillion Btu) |
Percentage of Total |
|---|---|---|
| Light Vehicles | 15,182.0 | 58.0% |
| Buses | 204.1 | 0.8% |
| Medium/Heavy Trucks | 5,923.8 | 22.7% |
| Aircraft | 2,037.0 | 7.8% |
| Watercraft | 1,054.9 | 4.0% |
| Pipeline | 1,140.8 | 4.4% |
| Rail | 610.8 | 2.3% |
Source: Oak Ridge National Laboratory. (2015, August). Transportation Energy Data Book. Accessed April 2016 from Transportation Research Board: http://cta.ornl.gov/data/index.shtml
Figure 7.14-1: Energy Consumption by Sector
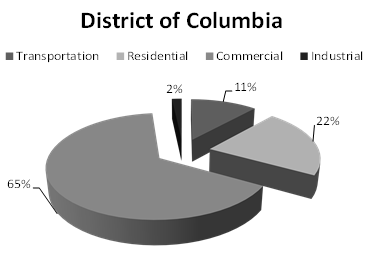
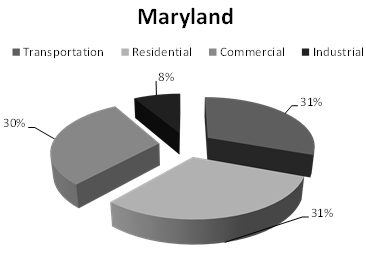
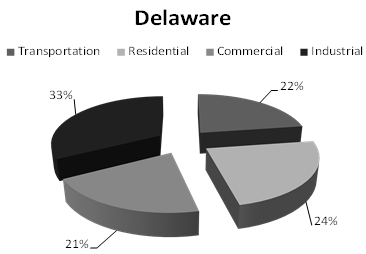
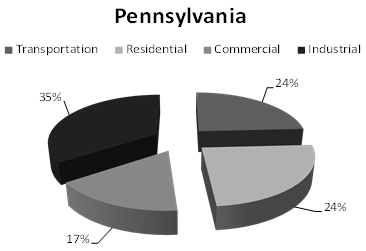
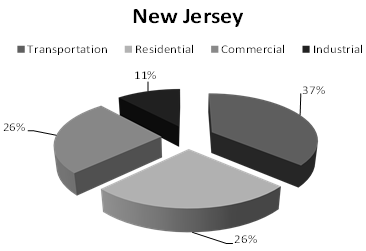
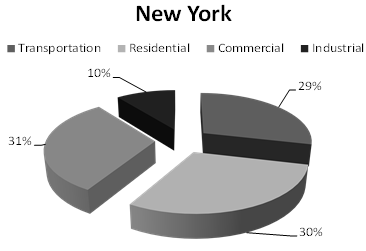
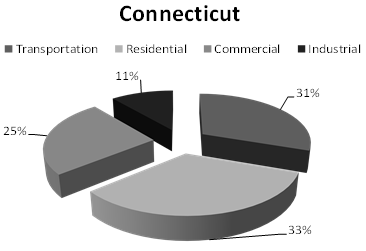

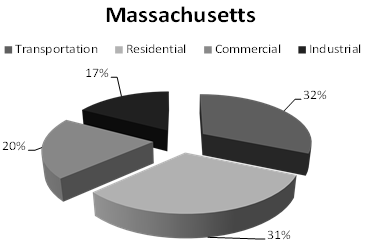
Source: U.S. Energy Information Administration. Accessed April 2016 at http://www.eia.gov/beta/state/seds/data.cfm?incfile=sep_sum/html/rank_use.html
Table 7.14-3 presents the changes in energy use for roadways, diesel trains, and electric trains for the Study Area in the year 2040 under the Preferred Alternative as compared to the No Action Alternative. The results are also presented in terms of tons of oil equivalent. The analysis of energy use will be affected by a later decision as to the type of trainsets that will be used. Table 7.14-5 presents the energy intensities of Amtrak trains currently operating within the Study Area.
| Project Element | MMBtu/Year |
|---|---|
| Roadways* | -11,688,940 |
| Diesel Trains | 28,455 |
| Electric Trains | 2,285,455 |
| TOTAL (MMBtu/year) | -9,375,030 |
| TOTAL** (Tons of Oil Equivalent/year) | -236,250 |
Source: NEC FUTURE team, 2016
* Roadways
represent changes in vehicle-miles traveled from personal vehicles (autos)
on the roadway network; this does not include potential changes in intercity
buses and trucks.
** Conversion based upon U.S. Department of Energy's
Transportation Energy Data Book: Edition 34, Table B.7.
MMBtu = million Btu
As shown in Table 7.14-3, for the Preferred Alternative, roadway energy would decrease, whereas the energy for electric trains would increase. The Preferred Alternative exhibits a greater decrease in overall energy use compared to the decreases of the Action Alternatives analyzed in the Tier 1 Draft EIS (Volume 2). Changes in energy use of diesel trains would be much smaller in scale than those from autos and electric trains, as shown by the relatively small change that would be caused by the Preferred Alternative.
The decreases in roadway energy use are attributed to decreases in VMT under the Preferred Alternative, as compared to the No Action Alternative, caused by passengers choosing to use the train rather than drive. The increases in electric train energy are attributed to the increases in train service associated with the Preferred Alternative. The changes in diesel trains are also attributed to changes in service associated with the Preferred Alternative.
As discussed in Chapter 5, Transportation, investment in the NEC FUTURE passenger rail infrastructure would create a shift in demand from aircraft and bus trips servicing the corridor to rail trips, when comparing the Preferred Alternative to the No Action Alternative. As such, the shift in travel mode choice would likely result in a decrease in energy use from aircraft and buses under the Preferred Alternative; however, it was not within the scope of this analysis to make quantitative predictions regarding the level of decrease in energy use.
Table 7.14-4 presents energy intensities - or the energy required to move a passenger per mile for each mode of transportation - for various modes of transportation. Intercity rail has a lower energy intensity (2,118 Btu per passenger-mile) than transit buses (4,071 Btu per passenger-mile) or aircraft (2,406 Btu per passenger-mile). As such, the expected mode shifts from buses and aircraft to intercity passenger rail would result in an overall decrease in energy use. As shown in the table, the energy intensities of cars, personal trucks, and motorcycles would also be higher than for Intercity rail. Table 7.14-5 presents possible energy intensities for each type of Amtrak train operating along the corridor in Btu per seat-mile.
| Mode | Energy Intensities (Btu per passenger-mile) |
|---|---|
| Transit Buses | 4,071 |
| Personal Trucks | 3,503 |
| Cars | 3,144 |
| Commuter Rail | 2,737 |
| Aircraft | 2,406 |
| Motorcycles | 2,475 |
| Transit Rail | 2,404 |
| Intercity Rail | 2,118 |
Source: Oak Ridge National Laboratory. (2015, August). Transportation Energy Data Book. Accessed April 2016 from Transportation Research Board: http://cta.ornl.gov/data/index.shtml.
| Train | Possible Energy Intensities (Btu per seat-mile) |
|---|---|
| AEM7 and Six Amfleet Coaches | 226 |
| Swedish X2000 (1L-5C trainset)* | 183 |
| German ICE (L-6C-L trainset)* | 241 |
Source: National Cooperative Rail Research
Program. (2015). Comparison of Passenger Rail Energy Consumption
With Competing Modes. Accessed April 2016 at
http://www.trb.org/Main/Blurbs/173718.aspx
* These are
integrated trainsets (L = power car, C = coach)
Refer to Volume 2, Chapter 7.14, for the discussion on new equipment and a brief overview of potential effects on energy due to construction activities for the Preferred Alternative.
The Preferred Alternative performs better than the Action Alternatives in total energy reduction. The increase in diesel energy use under the Preferred Alternative would be offset by a greater reduction in roadway energy use.
The Preferred Alternative would decrease operational energy use, resulting in beneficial energy effects and therefore no need for mitigation. To further reduce energy use, measures that include using alternative energy sources, creating renewable energy plans, and increasing fuel efficiency will be considered during later phases of project development and construction.
Elements of the U.S. Department of Transportation's Strategic Plan that are applicable to energy usage, sustainability, and reliability will be incorporated as part of subsequent Tier 2 project-level analysis. Depending upon the Tier 2 action, further analysis of operational energy effects may not be required.
The information posted on this website includes hypertext links or pointers to information created and maintained by other public and/or private organizations. The FRA provides these links and pointers solely for information and convenience. When users select a link to an outside website, they are leaving the NEC FUTURE website and are subject to the privacy and security policies of the owners/sponsors of the outside website. The FRA does not control or guarantee the accuracy, relevance, timeliness or completeness of information contained on a linked website, or endorse the organizations sponsoring linked websites, the views they express, or the products/services they offer. The FRA cannot authorize the use of copyrighted materials contained in linked websites and is not responsible for transmissions users receive from linked websites.