This chapter evaluates the potential for the Preferred Alternative to contribute to cumulative effects on resources evaluated in this Tier 1 Final Environmental Impact Statement (Tier 1 Final EIS). The Council on Environmental Quality defines cumulative effects as:
"the impact on the environment which results from the incremental impact of the action when added to other past, present, and reasonably foreseeable future actions regardless of what agency (Federal or non-federal) or person undertakes such other actions (40 CFR section 1508.7)"
The Federal Railroad Administration (FRA) developed a methodology for assessing cumulative effects (see Volume 2, Appendix E.19). The assessment of cumulative effects broadly identifies and discloses the potential for additive effects of the Preferred Alternative when considered with other past, present, and reasonably foreseeable future actions on identified key resource areas presented in this Tier 1 Final EIS. Areas of concern for future consideration as the program advances are highlighted.
The programmatic level of detail provided by this Tier 1 Final EIS and the geographic extent of the Study Area presents challenges in presenting quantitative data in regards to assessing cumulative effects. As such, the FRA presents a qualitative assessment of the Preferred Alternative's potential to contribute to cumulative effects on key resources.
Implementation of the Preferred Alternative has the potential to contribute both positively and negatively to cumulative effects. The FRA identified key resources in this analysis based on information presented in Chapters 5, 6, and 7. Improvements to the rail network by the Preferred Alternative have the potential to bring substantial benefits to the transportation system of the Northeast. The greatest potential for the Preferred Alternative to contribute to adverse cumulative effects is where new segments are proposed. Response to population growth and the need for improved and larger infrastructure (e.g., roads, housing, utilities, and commercial areas) that result in conversion of land cover and uses is the greatest trend affecting resources throughout the Study Area.
The Study Area for NEC FUTURE includes a broad geographic area (Figure 7.20-1), stretching from Washington, D.C., in the south, to Boston, MA, in the north, and covering over 50,000 square miles. For purposes of this programmatic assessment, the FRA defines the potential geographic boundary for cumulative effects as the entire Study Area. The FRA recognizes that the geographic boundary for effects on some resources may extend beyond the Study Area to follow natural boundaries, such as hydrologic and ecological resources. Subsequent Tier 2 project studies will define more accurate geographic boundaries based on the resources identified.
Figure 7.20-1 : Affected Environment for Cumulative Effect
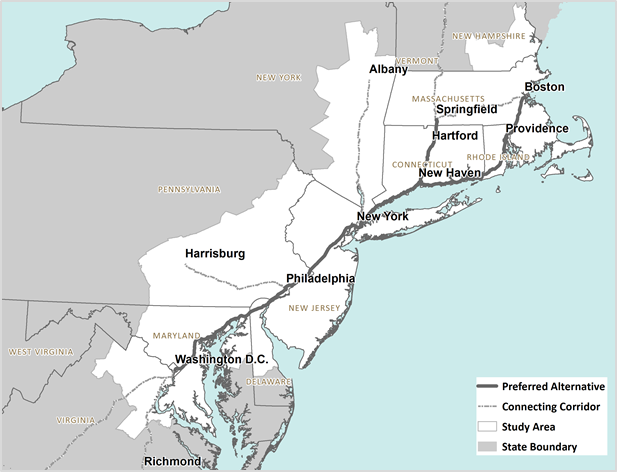
Source: NEC FUTURE team, 2016
The horizon year for NEC FUTURE is 2040.1 Implementation of the Preferred Alternative is designed occur over decades (see Chapter 10, Phasing and Implementation); however, the effects of the improved service associated with the Preferred Alternative will be felt beyond 2040. The Preferred Alternative represents the "grow" vision described for Alternative 2 (presented in Volume 2, Chapter 4). This vision expands the role of rail service, reaches new markets, and provides capacity beyond projected growth.
Key resources are those that have the greatest potential to be cumulatively affected by the Preferred Alternative.2 The FRA identified key resources for the cumulative effects analysis for the Preferred Alternative based on the analysis presented in this Tier 1 Final EIS (see Chapters 5, 6, and 7):
Past, present, and reasonably foreseeable future actions in this cumulative effects analysis include development in response to growth within the Study Area. Examples of these types of actions include real estate development, public/private infrastructure, and transportation. Table 7.20-1 provides examples of other transportation projects and non-transportation actions that represent past, present, and reasonably foreseeable future actions within the geographic boundaries defined for this cumulative effects analysis. It should be noted that the FRA has not quantified effects associated with this representative list of actions. However, given the context and the FRA's understanding of the Study Area, the FRA qualitatively presents potential effects associated with these types of actions.
| Category | Representative Actions (state) |
|---|---|
| Transportation: Transit |
|
| Transportation: Freight |
|
| Transportation: Maritime |
|
| Transportation: Rail |
|
| Transportation: Highway |
|
| Non-transportation: Large-scale Commercial &Residential |
|
Source: NEC FUTURE team, 2016
Note: See
Volume 2, Chapter 7.20 for a complete list of and description of the
non-transportation projects identified in the Study Area. See Volume
2, Appendix B.1, for a complete list and description of the transportation
projects identified in the Study Area.
Perhaps the greatest trend affecting resources within the Study Area is land development in response to a growing population. The Study Area is located in the Northeast region of the United States. The Northeast region is home to more than 51 million people and includes 4 of the 10 largest metropolitan areas in the United States: Washington, D.C., Philadelphia, New York City, and Boston. The density of development within the Northeast is similarly impressive, contributing 30 percent of the U.S. jobs on 2 percent of the nation's land area. By 2040, the Northeast is expected to add 7 million new residents. With this projected growth in population, comes increased real estate development activities and transportation infrastructure needs.
Pressure to serve transportation needs of a growing population has and will continue to result in land cover conversions of undeveloped land to developed land. Changes in land cover have far reaching effects on the built and natural environment - changing development patterns and loss or fragmentation of natural and cultural resources. These land cover conversions have the following further reaching effects on water resources:
In the Study Area, growth in non-highway travel outpaced highway travel between 2006 and 2012. During this time frame, both Regional rail and Intercity rail ridership increased throughout the Northeast Corridor (NEC). As described in Volume 2, Chapter 5, Intercity rail ridership increased by approximately 24 percent. Penn Station New York was the busiest Intercity passenger rail station in the country in both 2006 and 2012. Washington Union Station experienced the second-highest Intercity passenger volume in the country followed by Philadelphia with the third-highest passenger volume. Regional rail ridership within the Study Area increased approximately 4 percent - particularly with the Shore Line East service in Connecticut, VRE service in Virginia, and MARC service in Maryland.
Significant investments in all modes will be required in the coming decades to accommodate the magnitude of projected growth in travel demand across the Northeast. Unmet demand for passenger rail will require travelers to continue to rely on automobiles, air, and intercity bus for travel in the corridor. Transportation congestion will increase because of the projected population growth and continued reliance on automobiles. As a result, increased congestion will result in negative effects on both energy consumption and air quality, including increases in greenhouse gases, which contribute to climate change.
The Preferred Alternative has the potential to contribute both positively and negatively to cumulative effects on key resources identified within the Study Area. Implementation of improvements to the rail network will result in positive effects on the overall transportation network in the Northeast. The greatest potential for the Preferred Alternative to contribute negative cumulative effects is where new segments are proposed. These potential effects are described below.
Although the Preferred Alternative has the potential to contribute both positively and negatively to cumulative effects, the effects on the greater transportation network, when combined with other transportation actions, would likely have dramatic, positive impacts on how people move throughout the corridor. Shifts in mode choice, from a less efficient to a more efficient mode, result in net benefits to air quality and energy consumption. The Preferred Alternative provides such benefits, as rail is a more efficient mode of travel, and transportation benefits provided by the Preferred Alternative also result in positive economic effects throughout the corridor such as better access to jobs, new construction jobs, and development in and around station areas. Some economic changes would be immediate, while others would take place over a longer period. Implementation of the Preferred Alternative could, however, result in indirect effects due to induced growth, as discussed in Chapter 6, which would contribute to cumulative effects.
The Preferred Alternative would affect overall travel mode share throughout the Study Area, elevating the role of rail. Within the Study Area, analysis shows that trips made by automobile would decrease by approximately 4 percent and trips made by Intercity rail would increase by approximately 4 percent.
Travel times between destinations would be reduced and passengers would have a range of services and price points to choose from. The Preferred Alternative would also provide stronger connections between the Study Area's Intercity rail network and airports, thereby enhancing mobility throughout the Northeast region and beyond.
These changes in the transportation network would translate into net positive effects on air quality and an overall reduction in energy consumption. The Preferred Alternative would contribute positively to cumulative benefits on air quality due to mode shifts from auto and aircraft travel to passenger rail. Net changes in CO2e emissions resulting from the Preferred Alternative would result in a decrease of GHG. These effects combined with results of implementing the U.S. Environmental Protection Agency's proposed Clean Power Plan, which proposes to reduce criteria pollutants by 25 percent by 2030 and investments in energy efficiency programs, will have a meaningful improvement to air quality and overall energy consumption in the Northeast region.3
Similarly, the Preferred Alternative transportation benefits correlate to positive economic effects. By expanding markets served, the Preferred Alternative would increase connectivity to other Northeast locations and would intensify the potential for station-area development. The increase in Regional rail would enable great accessibility for workers and employers. Business productivity would benefit from employers' access to a broader and more diverse labor market. The range of service and price options would provide rail travelers with greater flexibility to match service with their trip need, allowing travelers to tradeoff between travel costs and time savings. More immediately, the economic benefits would be seen in an increase in construction jobs. Jobs would also increase as needs are identified for operating and maintaining the expanded rail service. Access and mobility provided by the Preferred Alternative would contribute to positive cumulative effects on the regional and local economies.
Freight operations would also benefit from through the elimination of chokepoints and other infrastructure improvements throughout the corridor would provide additional capacity to reduce circumstances where freight rail trains idle and passenger rail trains operate on the NEC. The benefits of reducing conflicts between freight operators and passenger rail would further improve air quality, and would provide for more efficient freight rail movements and smoother freight rail operations.
The FRA considered the effects of the Preferred Alternative on connecting corridors. Increases in service, the implementation of operational efficiencies, the alleviation of chokepoints, and the addition of new tracks and segments would create spillover benefits that would be realized along connecting corridors. With these benefits, localities along these connecting corridors could see an increase in development activity as people choose to live farther away from their places of work given the improved mobility. With development there is the potential to affect a variety of resources, both natural and built, that could contribute negatively to cumulative effects.
The Preferred Alternative improves the Existing NEC + Hartford/Springfield Line and proposes new segments at key locations to alleviate chokepoints, increase capacity, and improve performance. These infrastructure improvements proposed by the Preferred Alternative may exacerbate existing constraints on the built and natural environment.
New segments require new right-of-way, thereby introducing impacts to resources that exist in those areas. Table 7.20-2 summarizes the cumulative effects on key resources by new segment. Furthermore, the infrastructure improvements proposed by the Preferred Alternative would affect key resources and thereby would further contribute to cumulative effects within the Study Area. Table 7.20-3 summarizes the total potential contributions of the Preferred Alternative on key resources identified.
Of particular concern, is the Preferred Alternative's potential to further contribute to effects on hydrologic and ecological resources. Past, current, and reasonably foreseeable actions in response to population growth result in conversion of undeveloped land to developed land that can result in fragmentation. The U.S. Environmental Protection Agency and the U.S. Fish and Wildlife Service (USFWS) noted the cumulative effects of fragmentation in their comments on the Tier 1 Draft EIS.
| State | New or Upgraded Segments | Key Resource Affected | |||||
|---|---|---|---|---|---|---|---|
| Land Cover | Parklands and Wild and Scenic Rivers | Hydrologic Resources | Ecological Resources | Cultural Resources | Environmental Justice Populations | ||
| MD/DE | Bayview to Newport | X | X | X | X | X | X |
| DE | Wilmington Segment (bypasses Wilmington Station | X | X | X | X | X | X |
| PA | Philadelphia Segments | X | X | X | X | ||
| NJ | New Brunswick to Secaucus | X | X | X | X | X | X |
| NJ | Secaucus/Bergen loop | X | X | X | X | ||
| NY/CT | New Rochelle to Greens Farms | X | X | X | X | X | X |
| CT/RI | Old Saybrook-Kenyon | X | X | X | X | X | X |
| CT/MA | Hartford/Springfield Line (upgraded track/electrification)1 | X | X | X | X | X | |
Source: NEC FUTURE team, 2016
X = Potential
contribution of the Preferred Alternative to cumulative effects on key
resources; potential effects subject to Tier 2 project analysis.
| Resource | Effects of Preferred Alternative |
|---|---|
| Land Cover | |
|
9,855 |
|
2,710 |
|
2,535 |
|
1,035 |
| Parklands and Wild and Scenic Rivers | |
|
122 |
|
675 |
|
210 |
|
1 |
| Hydrologic Resources | |
|
510 |
|
1,920 |
|
325 |
|
280 |
| Ecological Resources | |
|
2,350 |
|
14 |
|
14 |
|
54 |
| Cultural Resources | |
|
6 |
|
108 |
| Environmental Justice | |
|
744 |
Source: NEC FUTURE team, 2016
These changes in land cover from undeveloped to developed could fragment habitats that are used by wildlife - including federally protected species - for shelter, foraging, and breeding. Loss and fragmentation of habitat can change migratory patterns of some species and result in the demise of species that rely on those habitats. Likewise, fragmentation of hydrologic resources could result in the degradation of waterbodies, including wetlands and floodplains, which would minimize their function in the broader watershed in which they exist. Dredge and fill of these resources would result in the loss of these hydrologic features and could contribute to increased flooding risk to developed areas.
Implementation of the Preferred Alternative could result in conversion of existing parklands to non-recreational uses and expanded or new crossings of designated wild and scenic rivers. Conversions of parklands may occur by modifying existing rail infrastructure or constructing new rail infrastructure within parklands. Crossing a wild and scenic river may affect the visual character or setting that may be important to the designation. The Preferred Alternative could also result in proximity effects, such as noise and vibration effects.
Cultural resources are irreplaceable. State Historic Preservation Offices within the Study Area noted concern with the potential for cumulative effects on cultural resources from multiple individual impacts over time. Both transportation and non-transportation-related actions could affect the following cultural resources: structures, archaeological sites, and tribal resources.
Census tracts designated as EJ populations exist throughout the Study Area and along the rail network. While the analysis presented in this Tier 1 Final EIS does not provide a determination of disproportionate and adverse effects, it does identify areas where key resources are in proximity to EJ census tracts. Effects on resources within these EJ census tracts could result in disproportionate cumulative effects when taken into account with other transportation and non-transportation actions.
The cumulative effects assessment presented as part of this Tier 1 Final EIS should be considered a starting point when completing Tier 2 project analyses. Geographic and time boundaries for specific resources should be further defined and consideration of more site-specific past, present, and reasonably foreseeable actions should be given, including specific types of cumulative effects, such as time lags, fragmentation, and triggers and thresholds.
1 The horizon year refers to the future timeframe within which Environmental Consequences associated with the construction and operation of the No Action Alternative and Preferred Alternative will be assessed.
2 As part of the Tier 1 Draft EIS analysis of cumulative effects, the FRA included climate change and indirect effects as key resources. The NEC FUTURE climate change analysis focuses on vulnerability of infrastructure and not how the Preferred Alternative would contribute to cumulative effects on climate change; therefore, climate change is not included as a key resource in this Tier 1 Final EIS cumulative effects analysis. Indirect effects analysis is discussed in Chapter 6.
3 The FRA recognizes that the Supreme Court stayed implementation of the Clean Power Plan in February 2016, pending judicial review of legal challenges to the rule. This analysis assumes that states will continue to voluntarily comply with the Clean Power Plan during the stay and that the Clean Power Plan will be upheld.
The information posted on this website includes hypertext links or pointers to information created and maintained by other public and/or private organizations. The FRA provides these links and pointers solely for information and convenience. When users select a link to an outside website, they are leaving the NEC FUTURE website and are subject to the privacy and security policies of the owners/sponsors of the outside website. The FRA does not control or guarantee the accuracy, relevance, timeliness or completeness of information contained on a linked website, or endorse the organizations sponsoring linked websites, the views they express, or the products/services they offer. The FRA cannot authorize the use of copyrighted materials contained in linked websites and is not responsible for transmissions users receive from linked websites.