The purpose of this chapter is to review and evaluate the findings of this Tier 1 Final Environmental Impact Statement (Tier 1 Final EIS). The Federal Railroad Administration (FRA) identified the Preferred Alternative through a deliberative screening process, from a broad range of possibilities presented in the Tier 1 Draft EIS, and at a level of detail consistent with a programmatic EIS and sufficient to evaluate benefits and effects to both the built and natural environments. The Preferred Alternative achieves a "grow" vision consistent with Alternative 2, but incorporates elements of Alternatives 1 and 3 where features of those Alternatives were considered a better fit with local conditions.
This chapter presents the evaluation of the Preferred Alternative when compared to the No Action Alternative (see Chapter 4 for a description of the No Action Alternative and Preferred Alternative). The assessment of the Preferred Alternative is consistent with the previous evaluation of the Action Alternatives in Chapter 9 of the Tier 1 Draft EIS. For this assessment of the Preferred Alternative, highlights of key metrics for the Action Alternatives relative to the No Action Alternative are provided for comparative purposes, but the full sets of metrics for each Action Alternative are not repeated in this Volume 1. Volume 2, Chapter 9, provides the full set of metrics for each Action Alternative.
The FRA chose specific metrics to evaluate how the alternatives evaluated in the Tier 1 EIS address the needs for the NEC FUTURE program, and to compare benefits, costs, and other factors among the alternatives. The evaluation framework is based on the NEC FUTURE Purpose and Need, as well as considerations of environmental impacts, cost, and constructability. Thus, the metrics used to assess the performance of the alternative against the evaluation factors measure, both quantitatively and qualitatively, how well each alternative addresses Study Area needs. Table 9-1 presents the evaluation factors and the specific metrics to evaluate the alternatives. Note that factors are defined in two categories: needs-based factors that represent each of the seven needs identified in the Purpose and Need for the program (Chapter 3), and other factors that characterize the costs and benefits of the alternatives. This section evaluates the Preferred Alternative and the No Action Alternative within the evaluation factors.
The information is presented for the No Action Alternative and Preferred Alternative as a total value or assessment. As appropriate, analytical results are summarized for metropolitan areas or representative stations or station-pairs. The metropolitan areas and representative stations are consistent with the analyses presented in Chapter 5, Transportation. Where applicable, data are presented separately for Intercity and Regional rail services.
| Factors | Metrics for Evaluation of Alternatives |
|---|---|
| NEC FUTURE NEEDS | |
| Aging Infrastructure |
|
| Capacity |
|
| Connectivity |
|
| Performance |
|
| Resiliency |
|
| Environmental Sustainability |
|
| Economic Growth |
|
| BENEFITS, COSTS, AND OTHER FACTORS | |
| Environmental Impacts |
|
| Capital/O&M Costs |
|
| Constructability |
|
Source: NEC FUTURE team, 2016
Aging and obsolete infrastructure on the NEC erodes service quality and increases the cost and complexity of maintaining the railroad operations. Current investment on the NEC falls short of funding the improvements needed to maintain system reliability or to meet growing demand. Continued underinvestment in the NEC will result in further service disruptions and degradations in service quality. Rail infrastructure also influences passenger rail system safety. Failures associated with aging infrastructure can contribute to train- or station-related incidents involving operations, personnel, and passengers.
To continue current service, the No Action Alternative assumes additional investment in the NEC that exceeds existing funding levels; however, the No Action Alternative addresses only a modest proportion of the significant backlog of improvements. Critical infrastructure projects such as the Baltimore and Potomac (B&P) Tunnel Replacement, Susquehanna Bridge Replacement, Portal Bridge, Hudson River Tunnels, Norwalk and Saugatuck Bridge Rehabilitation, and Devon Bridge Replacement will not be completed. As a result, the No Action Alternative will continue to rely on aging infrastructure and fall short of bringing the NEC to a state of good repair.
The Preferred Alternative brings the NEC to a state of good repair by replacing or renewing aging infrastructure on the NEC and eliminating the backlog of infrastructure requiring replacement, enabling all future capital upgrades to be planned and implemented according to a regular replacement cycle. The Preferred Alternative also provides numerous equipment and infrastructure upgrades that would improve reliability and reduce delays associated with equipment failures or infrastructure deficiencies.
The NEC operates at or close to its capacity at multiple locations during peak travel periods. Adding capacity is essential to accommodating projected future growth in travel and is a key element of the Preferred Alternative. Adding capacity entails relieving critical chokepoints on the rail network, adding new main line tracks where needed, upgrading stations and building new stations, and increasing the size of the rolling stock fleet and the capacity of rail yards. The portions of the NEC approaching the Major Hub stations at Washington, D.C., New York City, and Boston are among the locations where existing rail traffic and ridership push the limits of available capacity and, therefore, are good examples to illustrate how the No Action Alternative and Preferred Alternative would utilize capacity.
Railroad Capacity Utilization
For purpose of this analysis, the FRA identified five key segments, or screenlines, to measure capacity and capacity utilization. These screenlines, which are defined as imaginary lines across which rail and passenger traffic can be counted or measured, are located at the following locations:
The utilization of capacity and the availability of residual railroad capacity are both important considerations in the evaluation of the extent to which the No Action Alternative and Preferred Alternative are able to fulfill their objectives with respect to the role of rail in serving interregional and regional travel demand within the Study Area.
The Preferred Alternative provides major investment in capacity across the Hudson River screenline, with new tunnels providing two new tracks parallel to the existing tunnels and an expansion of Penn Station New York. In addition, the Preferred Alternative adds two additional tracks at the East River screenline providing 10 slots and excess capacity beyond the 2040 horizon year.
Table 9-2 presents measures of peak-hours rail service capacity and practical capacity at the given screenline locations approaching the major hubs on the NEC. The table indicates practical capacity and utilization in terms of the number of train slots. Utilization is presented for Intercity and Regional rail trains that operate in the standard peak hour in the peak direction of travel at the five screenline locations-based on the representative Service Plans for the No Action Alternative and Preferred Alternative. The Preferred Alternative provides a level-of-service that responds to traveler demand and grows the role of rail relative to other trans-Hudson travel modes at the Hudson River screenline. This contrasts with the No Action Alternative, which does not create sufficient train capacity at the Hudson River (or at the other major screenline locations) to keep up with growth in demand.
| Screenline | No Action Alternative | Preferred Alternative |
|---|---|---|
| Washington, D.C. (north of Union Station) | ||
| Total Practical Capacity (Slots/Hour) | 12 | 20 |
| Total Intercity (IC & EXP) | 2 | 10 |
| Regional Rail | 4 | 10 |
| Total Trains (EXP+IC+REG) | 6 | 20 |
| Hudson River | ||
| Total Practical Capacity (Slots/Hour) | 24 | 52 |
| Total Intercity (IC & EXP) | 3 | 10 |
| Regional Rail | 21 | 42 |
| Total Trains (EXP+IC+REG) | 24 | 52 |
| East River (PSNY --> Queens) | ||
| Total Practical Capacity (Slots/Hour) | 40 | 70 |
| Total Intercity (IC & EXP) | 2 | 10 |
| Regional Rail | 36 | 50 |
| Total Trains (EXP+IC+REG) | 38 | 60 |
| New Haven North (Hartford/Springfield Line) | ||
| Total Practical Capacity (Slots/Hour) | 2 | 6 |
| Total Intercity (IC & EXP) | 1 | 4 |
| Regional Rail | 1 | 2 |
| Total Trains (EXP+IC+REG) | 2 | 6 |
| Boston (South of Back Bay Station [NEC]) | ||
| Total Practical Capacity (Slots/Hour) | 24 | 24 |
| Total Intercity (IC & EXP) | 2 | 6 |
| Regional Rail | 9 | 12 |
| Total Trains (EXP+IC+REG) | 11 | 18 |
Source: NEC FUTURE: Service Plans, 2016
Note: Excludes new Long Island Rail Road service to Grand Central
Terminal with the East Side Access project
Note: Peak hour,
peak direction service at the Boston South screenline for Existing Conditions
and the No Action Alternative was updated for the Tier 1 Final EIS to
two trains to capture those peak hours where one Intercity-Express and
one Intercity-Corridor train operate in the same hour. This is an update
from the Tier 1 Draft EIS.
EXP=Express; IC=Intercity-Corridor; REG=Regional
rail; Intercity-Corridor service includes Metropolitan, Off-Corridor
and Long Distance services
Passenger Capacity Utilization
Passenger-carrying capacity (defined as passengers per hour or PPH) on a section of rail line is calculated by taking train capacity in trains per hour (TPH)-measured as either the number of peak-hour trains or the maximum practical number of peak-hour slots-and multiplying by the average practical seating capacity per train, which is a function of the mix of train types and service patterns in the service plan. Seats on the train are used as a surrogate for the number of passengers that can be carried, since Intercity trains require reservations and Regional rail service standards are based on passengers being able to obtain seats on unreserved trains. Passenger capacity utilization is calculated as the ratio of peak-hour ridership to peak-hour seating capacity. A related statistic is residual capacity, which calculates the available capacity that exists in the peak hour at each screenline location, measured in terms of available seats. These are two ways of comparing the volume of traffic with the capacity available at a single point on the NEC. Table 9-3 shows peak-hour passenger-carrying capacity as measured in practical seats and ridership (passengers per hour or PPH) at the five screenlines.
| Screenline | No Action Alternative | Preferred Alternative |
|---|---|---|
| Washington, D.C. (north of Union Station) | ||
| Practical Seats (EXP+IC+REG) | 6,400 | 17,400 |
| Total Ridership (pph) | 6,600 | 11,200 |
| Hudson River | ||
| Practical Seats (EXP+IC+REG) | 28,900 | 63,000 |
| Total Ridership (pph) | 30,400 | 61,300 |
| East River (PSNY --> Queens) | ||
| Practical Seats (EXP+IC+REG) | 38,300 | 56,300 |
| Total Ridership (pph) | 32,800 | 49,300 |
| New Haven North (Hartford/Springfield Line) | ||
| Practical Seats (EXP+IC+REG) | 1,000 | 3,000 |
| Total Ridership (pph) | 200 | 700 |
| Boston (South of Back Bay Station [NEC]) | ||
| Practical Seats (EXP+IC+REG) | 10,000 | 20,900 |
| Total Ridership (pph) | 9,600 | 14,700 |
Source: NEC FUTURE Service Plans, 2015;
NEC FUTURE Intercity Travel Demand Model outputs, April 2015; Regional
Travel Demand Model outputs, 2016
Excludes new Long Island Rail Road
service to Grand Central Terminal with the East Side Access project
pph = persons per hour
EXP=Express; IC=Intercity-Corridor; REG=Regional
rail; Intercity-Corridor service includes Metropolitan, Off-Corridor
and Long Distance services
Ridership
For this Tier 1 Final EIS, the FRA adjusted the NEC FUTURE Interregional Model based on issues identified during the Tier 1 Draft EIS comment period and a reassessment of the overall model outcomes. These adjustments did not affect the relative findings of the Action Alternatives (when compared to the No Action Alternative), but did result in modifications to the total numbers of trips and their distribution by station or metropolitan area. Appendix BB, Technical Analysis on the Preferred Alternative, contains a detailed description of the rationale for these adjustments, the process used to apply the adjustments, and a summary of the changes in the model results, compared to the results presented in the Tier 1 Draft EIS. The Preferred Alternative increases both Intercity and Regional rail travel compared to the No Action Alternative. The FRA considered three metrics in the evaluation of ridership:
Table 9-4 summarizes Intercity and Regional rail trips and passenger miles for the No Action Alternative and Preferred Alternative. Ridership is presented in 1,000s (thousands) of linked trips, or a complete one-way trip from origin to destination, regardless of whether a transfer was required for the trip.
| No Action Alternative | Preferred Alternative | Percentage Change over No Action | |
|---|---|---|---|
| Annual Passenger Trips (in 1,000s of one-way trips) | |||
| Intercity Rail | 19,500 | 40,200 | 107% |
| Regional Rail | 419,800 | 502,800 | 20% |
| TOTAL Trips | 439,300 | 543,000 | 24% |
| Annual Passenger Miles (in 1,000s) | |||
| Intercity Rail | 3,074,500 | 6,966,800 | 127% |
| Regional Rail | 11,264,400 | 13,641,900 | 21% |
| TOTAL Miles | 14,338,900 | 20,608,700 | 44% |
Source: NEC FUTURE Travel Demand Model,
2016
Note: Numbers may not add due to rounding
Table 9-5 summarizes the increase in passenger trips for the Preferred Alternative compared to the No Action Alternative. Commensurate with the increased levels of passenger rail service and improved connectivity to both existing and new markets, the Preferred Alternative has increased ridership.
| Geography | No Action Alternative | Preferred Alternative | Percentage Change over No Action |
|---|---|---|---|
| Greater Washington Area | 6,500 | 12,500 | 92% |
| Greater Philadelphia Area | 6,300 | 11,800 | 87% |
| New York - North Jersey Area | 14,700 | 30,600 | 108% |
| Greater Hartford Area | 800 | 2,700 | 238% |
| Greater Boston Area | 3,100 | 6,100 | 97% |
Source: NEC FUTURE Travel Demand Model, 2016
Trip Diversion
Using the No Action Alternative as a baseline, the FRA measured the effectiveness of the Preferred Alternative at achieving the "grow" vision by measuring trips diverted from other modes. Table 9-6 summarizes the total forecast Intercity trips and those diverted from auto, air, or intercity bus for the Preferred Alternative. Approximately 49 percent of the total Intercity trips are diverted from other modes. Of those diversions, the majority are auto diversions. In addition, the Preferred Alternative provides residual capacity able to accommodate future growth in ridership beyond what is estimated in the regional models for 2040.
| Mode | Preferred Alternative |
|---|---|
| Auto Diversions | 16,700 |
| Air Diversions | 1,200 |
| Intercity Bus Diversions | 1,600 |
| Total Diversions (Auto, Air, Intercity Bus) | 19,600 |
| Total Intercity Rail Trips | 40,200 |
| % Trips on the NEC Diverted from Other Modes (Auto, Air, Intercity Bus) | 49% |
Source: NEC FUTURE Travel Demand Model, 2016
| Mode | Preferred Alternative |
|---|---|
| Auto Diversions | 48,500 |
| Other Transit Diversions (bus, subway, LRT) | 34,500 |
| Total Diversions (Auto, Other Transit) | 83,000 |
| Total Regional Rail Trips | 502,800 |
| % Trips on the NEC Diverted from Other Modes (Auto, Other Transit) | 17% |
Source: NEC FUTURE Travel Demand Model, 2016
| Market/Service Type | Preferred Alternative |
|---|---|
| Intercity Rail Market Automobile VMT Reduction | (3,023,000) |
| Regional Rail Market Automobile VMT Reduction | (1,001,600) |
| Total 2040 No Action VMT | 56,203,710 |
| Portion of 2040 VMT Reduction Attributed to the Preferred Alternative | 7% |
| TOTAL VMT Reduction | (4,024,600) |
Source: NEC FUTURE Travel Demand Model, 2016
Connectivity is measured by change in service frequency for representative station-pairs for the NEC as well as the connecting corridors. Also of interest is the change in intermodal connectivity, for example, improved access to airports. Chapter 5, Transportation, presents an assessment of improvements at representative stations including: change in type of service, volume of service, and travel times to other stations. As described in Section 9.1.1.7, Economic Growth, an additional metric is the number of places accessible within 45 minutes of train travel time from Hub stations, which indicates areas with improved access to rail service.
Air-Rail Connectivity
Increased direct passenger rail service to Study Area airports improves air-rail connectivity and enhance the complementarity of the two modes, providing service redundancy when there are unanticipated events causing service disruptions in either rail or air service. The Preferred Alternative would provide Intercity and Regional rail services to all airport stations1 in the Study Area, with increases in frequencies consistent with the "grow" vision. Intercity and Regional rail frequencies for each of the existing and new airport stations are provided in Table 9-9.
| Airport Station | No Action Alternative | Preferred Alternative |
|---|---|---|
| Baltimore/Washington International Thurgood Marshall | 143 | 350 |
| Philadelphia International | 72 | 332 |
| Newark Liberty International | 153 | 378 |
| Bradley International Airport | 24 | 76 |
| T.F. Green | 10 | 154 |
Source: NEC FUTURE team, 2016
Note:
The daily number of daily trains includes Intercity-Express, Intercity-Corridor,
and Regional rail service. For purposes of this analysis Windsor Locks
Station on the Hartford/Springfield Line would provide direct connections
to Bradley International Airport.
Additional airports not with direct connections to rail in the Preferred Alternative would also benefit from improved connections to connecting corridors. For example, passengers will have Intercity and Regional rail service connections to Bradley International Airport via a shuttle connection at Windsor Locks, CT.
Air-rail connectivity is also measured by the competitiveness of passenger rail to relieve the growing demands on capacity constrained airports in the Study Area. The Preferred Alternative would create the single greatest number of diversions to rail within the New York-North Jersey Area to Greater Boston Area, followed by the Greater Washington Area to New York-North Jersey Area (Table 9-10). The diversions to rail in the Preferred Alternative are likely due to increased frequencies associated with the Preferred Alternative and trips times by rail decreasing to below 3 hours. The trips diverted to rail between both the Greater Washington and New York-North Jersey Areas, and the Greater New York-North Jersey Area, represents the greatest number of diversions, indicating the continued attractiveness to the New York City market. The 2,000 trips diverted to rail between the Greater Washington and Greater Philadelphia Areas represents the smallest number of diversions in the Study Area. However these diversions represent over 20 percent of the roughly 9,000 air trips taken between these two markets in the No Action Alternative.
| Metro Area to Metro Area | Preferred Alternative | |
|---|---|---|
| Greater Washington Area | New York-North Jersey Area | 160,000 |
| Greater Philadelphia Area | Greater Washington Area | 2,000 |
| New York-North Jersey Area | Greater Boston Area | 180,000 |
| Greater Boston Area | Greater Philadelphia Area | 30,000 |
| Greater Washington Area | Greater Boston Area | 80,000 |
Source: NEC FUTURE team, 2016
Note:
Air-to-rail diversions are a portion of the increased annual rail trips
over the No Action Alternative.
Intercity and Regional Rail Connectivity
Intercity service where there is a direct, one-seat connection between origin and destination would become more commonplace in the Preferred Alternative. The Preferred Alternative would upgrade five stations from Local stations to Hub stations, connecting Regional rail service and Intercity rail services. Local stations like Odenton and Secaucus become Hub stations in the Preferred Alternative. Intercity services to existing Hub and Major Hub stations would almost triple, as compared to the No Action Alternative. Table 9-11 presents a representative assessment of improvements in connectivity within the Study Area, and is representative of typical daily number of trains (service volumes) between similar station types for each alternative.
| Average Trains Per Day by Service Type | No Action Alternative | Preferred Alternative | |||
|---|---|---|---|---|---|
| Station 1 | Station 2 | Express | Corridor | Express | Corridor |
| Washington Union Station | Newark, DE | - | 1 | - | 58 |
| Philadelphia 30th Street | 16 | 22 | 57 | 81 | |
| Secaucus | - | - | - | 56 | |
| Penn Station New York | 16 | 22 | 57 | 79 | |
| Boston South Station | 10 | 8 | 43 | 30 | |
| Baltimore Penn Station | New Haven | 9 | 10 | 29 | 60 |
| Philadelphia 30th Street | Odenton | - | - | - | 58 |
| Penn Station New York | Baltimore Penn Station | 16 | 22 | 33 | 79 |
| Wilmington | 16 | 22 | 33 | 56 | |
| Philadelphia 30th Street | 16 | 32 | 63 | 93 | |
| Stamford | Providence | 10 | 9 | 56 | 32 |
| Hartford | Newark Penn Station | - | 1 | - | 32 |
| New London | Penn Station New York | 1 | 9 | - | 32 |
| Boston South Station | Philadelphia 30th Street | 10 | 8 | 49 | 32 |
| Penn Station New York | 10 | 9 | 56 | 38 | |
Source: NEC FUTURE team, 2016
The Preferred Alternative adds 22 new stations for a total of 138 stations. Eight new stations are located in Connecticut, the most of any state within the Study Area. Four new stations are located on the Hartford/Springfield Line, in New Haven and Hartford Counties, followed by two in Fairfield County, one in New Haven County on the NEC, and one in New London County. Five new stations are added in New York: four in Bronx County and one in Westchester County.
As described in Chapter 4, Preferred Alternative, Intercity-Corridor service includes a new service concept-Metropolitan-that offers improved service to markets and key transfer locations, and stops at more stations than current Intercity-Corridor service. As such, Intercity service between Hartford and Washington, D.C., for example, increases from 5 daily trains in the No Action Alternative to 61 trains in the Preferred Alternative. Intercity service between Hartford and Stamford, CT, increases from 6 daily trains in the No Action Alternative to 35 daily trains in the Preferred Alternative.
Connecting Corridors
Connectivity improvements resulting from the Preferred Alternative would also be realized for services to connecting corridors, including Intercity-Corridor services south of Washington Union Station to Richmond, VA, and continuing on to other areas of Virginia and North Carolina; Keystone Corridor service from Philadelphia 30th Street Station to Harrisburg and points west; Empire Corridor service from Penn Station New York to Albany and western New York; and services north of Springfield.
The FRA evaluated changes in service volumes for stations on each of the above connecting corridors to either Penn Station New York or Washington Union Station. Table 9-12 depicts daily Intercity service volumes, measured as trains per day, for these representative station-pairs. Service volumes would increase in the Preferred Alternative, providing more service and improved connections to New York and Washington, D.C., as well as intermediate destinations. The greatest increase in service would be Hartford/Springfield Line, which would be electrified and double-tracked in the Preferred Alternative to support more-frequent service via New Haven to Hartford, CT, and Springfield, MA. One-seat-ride service would be available from Springfield to both Penn Station New York and Washington Union Station.
| Connecting Corridors - Representative Station-Pairs | No Action Alternative | Preferred Alternative | |
|---|---|---|---|
| From | To | ||
| South of Washington, D.C. | |||
| Richmond Staples Mill Road | Washington Union Station | 9 | 11 |
| Penn Station New York | 9 | 141 | |
| Keystone Line | |||
| Harrisburg | Washington Union Station | 13 | 23 |
| Penn Station New York | 14 | 24 | |
| Empire Corridor | |||
| Albany-Rensselaer | Washington Union Station | 11 | 21 |
| Penn Station New York | 12 | 22 | |
Source: NEC FUTURE team, 2016
1 For service
planning purposes, the FRA considered three long-distance trains continuing
south of Washington, D.C./ Alexandria, VA, to allow sufficient capacity
to accommodate these services. The FRA did not explicitly consider these
trains in ridership forecasting.
Passenger rail performance, as measured by travel time and reliability, would significantly improve in the Preferred Alternative when compared to the No Action Alternative. Capacity improvements relieve bottlenecks and improve service performance while also extending the reach of the passenger rail network to new markets (see Section 9.1.1.3, Connectivity). Metrics for performance improvement include best travel times and service reliability.
Reliability and on-time performance improvements for Regional rail service would result in improved travel times, particularly in the peak hour, peak direction. The Preferred Alternative would reduce the causes of train delay-such as infrastructure failure, infrastructure maintenance, and rolling stock failure-as assets are brought to a state of good repair and rolling stock is replaced. As new rail infrastructure is constructed for the Preferred Alternative, network interaction would improve and chokepoints and schedule conflicts would be eliminated. (See Appendix BB for additional details on how delay-related assumptions influence service planning of the Preferred Alternative.)
The Preferred Alternative would also improve Intercity travel times between representative station-pairs. As shown in Table 9-13, best Intercity-Express travel times from Washington Union Station to Penn Station New York would decrease by approximately 30 minutes for the Preferred Alternative. Between Washington, D.C., and Boston, MA, Intercity-Express travel time would decrease by approximately 90 minutes, and Intercity-Corridor would decrease by approximately 75 minutes for the Preferred Alternative. Service to Springfield is similar to Hartford in the Preferred Alternative. However, the greatest decreases in travel times occur between Springfield, MA, and Washington Union Station where overall travel times could result in savings of more than 90 minutes.
| Station 1 | Station 2 | No Action Alternative | Preferred Alternative |
|---|---|---|---|
| Washington Union Station | Newark, DE | 1:25 | 1:10 |
| Philadelphia 30th Street | 1:35 | 1:20 | |
| Secaucus | - | 2:55 | |
| Penn Station New York | 2:45 | 2:15 | |
| Boston South Station | 6:35 | 5:10 | |
| Baltimore Penn Station | New Haven | 3:55 | 3:05 |
| Philadelphia 30th Street | Odenton | - | 1:20 |
| Penn Station New York | Baltimore Penn Station | 2:10 | 1:50 |
| Wilmington | 1:30 | 1:15 | |
| Philadelphia 30th Street | 1:10 | 0:55 | |
| Stamford | Providence | 2:05 | 1:40 |
| Hartford | Newark Penn Station | 3:25 | 2:05 |
| New London | Penn Station New York | 2:15 | 1:45 |
| Boston South Station | Philadelphia 30th Street | 4:55 | 3:50 |
| Penn Station New York | 3:30 | 2:45 |
Source: NEC FUTURE Intercity Travel Demand
Model outputs, 2016
- = No connection for that station-pair and/or
service type.
Connecting Corridors
Travel-time improvements on the NEC in the Preferred Alternative cascade to connecting corridor services as well. Longer-distance trips (e.g., Richmond Staples Mill Road to Penn Station New York or Albany-Rensselaer to Washington Union Station) would have travel-time improvements greater than 60 minutes in the Preferred Alternative. Table 9-14 depicts travel-time savings, compared to the No Action Alternative, for connecting corridors in the Preferred Alternative. Travel-time savings on the Keystone Corridor between Harrisburg, PA, and Penn Station New York are approximately 30 minutes, while between Harrisburg, PA, and Washington Union Station travel-time savings are approximately 50 minutes.
| Station 1 | Station 2 | No Action Alternative | Preferred Alternative | Difference |
|---|---|---|---|---|
| South of Washington, D.C. | ||||
| Richmond Staples Mill Road | Washington Union Station | 2:10 | 2:05 | 0:05 |
| Penn Station New York | 6:10 | 4:55 | 1:15 | |
| Keystone Corridor | ||||
| Harrisburg | Washington Union Station | 4:55 | 4:05 | 0:50 |
| Penn Station New York | 3:40 | 3:05 | 0:30 | |
| Empire Corridor | ||||
| Albany-Rensselaer | Washington Union Station | 7:20 | 5:55 | 1:25 |
| Penn Station New York | 2:30 | 2:15 | 0:15 | |
Source: NEC FUTURE Intercity Travel Demand
Model outputs, April 2016
Note: The Hartford/Springfield
Line is upgraded to a double-track, electrified rail line and included
in the Preferred Alternative.
The Preferred Alternative improves existing infrastructure, adds additional tracks to allow for increased operational flexibility, and increases system resiliency and redundancy by incorporating new segments. New segments constructed adjacent and connecting to major markets in the Study Area provide redundant network connections to markets. System redundancy is needed to support the reliability of the transportation system in the Study Area and to ensure that it is resilient and adaptable to changing circumstances.
One quantitative factor in considering resiliency is the ability of the infrastructure to withstand increased risks of sea level rise, coastal storm surge flooding, and riverine flooding as described in Chapter 7.15, Climate Change and Adaptation. The following sections focus on acreage in the Representative Route of the Preferred Alternative at risk from all flooding hazards under current climate conditions in order to identify the comparative level of risk between the NEC and the Hartford/Springfield Line, and select new segments in the Preferred Alternative.
As described in Chapter 7.15, the percentage of total acreage for the Preferred Alternative at risk of sea level rise and storm surge flooding increases slightly, less than 1 percent. This slight increase is due to new segments that would be constructed adjacent to the NEC, which lies along the coastline, close to major water bodies and tidal waters. Riverine flooding decreases slightly, less than 1 percent, in the Preferred Alternative. Overall flooding vulnerability analysis indicates that the Preferred Alternative is slightly more vulnerable to flood risk, but this finding does not account for adaptation measures and design considerations that would be incorporated as part of the Tier 2 design process to reduce vulnerability to flooding.
Construction types of either at-grade or trench types, have a greater risk of inundation than "above-grade" construction types (e.g., embankment or aerial structure). When considering construction types, the Preferred Alternative provides greater resilience benefits than the Existing NEC + Hartford/Springfield Line. Overall, the route miles of the Preferred Alternative include 53 percent at-grade and trench construction types, compared to 62 percent for the Existing NEC + Hartford/Springfield Line.
The decrease in route miles of at-grade and trench construction types in the Preferred Alternative is due to the construction of new route segments, which include fewer at-grade and trench construction types (see Section 9.1.2.3, Constructability) in areas at risk of sea level rise flooding, storm surge flooding, or riverine flooding than the Existing NEC + Hartford/Springfield Line. For example, the Old Saybrook-Kenyon new segment includes less than 1 percent of acreage of at-grade and trench construction types at risk of riverine flooding compared to approximately 16 percent for the NEC between Old Saybrook, CT, and Kenyon, RI (see Table 9-15). As such, the Old Saybrook-Kenyon new segment provides more resiliency to inundation than the NEC.
| Existing NEC + Hartford / Springfield Line | Preferred Alternative | |
|---|---|---|
| Sea Level Rise Flooding | 0.6% | 0.1% |
| Storm Surge Flooding | 13.9% | 0.7% |
| Riverine Flooding | 15.6% | 0.9% |
Source: NEC FUTURE team, 2016
Another example is the Bayview-Newport new segment, which includes approximately 2 percent of acreage of at-grade and trench construction types at risk of riverine flooding compared to approximately 3 percent for the NEC between Bayview, MD, and Newport, DE (see Table 9-16 ). As these data show, the Bayview-Newport new segment provides more resiliency to inundation than the NEC.
The redundancy resulting from new segments also provides benefits compared to the No Action Alternative. Redundant track outside of the areas of risk provides, as is the case on the Old Saybrook-Kenyon and Bayview-Newport new segments, alternate routing when other segments are closed because of flooding, allowing some level-of-service to be maintained.
| Existing NEC + Hartford / Springfield Line |
Preferred Alternative | |
|---|---|---|
| Sea Level Rise Flooding | 0.0% | 0.0% |
| Storm Surge Flooding | 1.2% | 0.2% |
| Riverine Flooding | 2.5% | 1.7% |
Source: NEC FUTURE team, 2016
Continued reliance on modes of transportation that result in greater energy consumption and encourage sprawl development affects environmental sustainability. Energy use and emissions associated with transportation diminish environmental quality. Expanding the availability of more energy efficient transportation modes, including passenger rail, is needed to support desired improvements in air quality and growth patterns.
Air Quality
Chapter 7.13, Air Quality, describes the existing and future level of contaminants in the air. Construction of the Preferred Alternative would result in temporary emissions of criteria pollutants associated with construction equipment and activities. Local levels of criteria pollutants could also increase near station locations and parking facilities caused by vehicles queuing at these locations. The FRA did not conduct a quantitative analysis of the impacts to air quality from construction as a detailed construction schedule, along with estimates of construction equipment and activities are not developed as part of the NEC FUTURE.
Operation of the Preferred Alternative, post construction, would have a beneficial effect on emissions of criteria pollutants and greenhouse gases (GHG) from roadway vehicles since they would decrease VMT and associated vehicle emissions. Changes in emissions of criteria pollutants and GHGs are expected to decrease with the operation of the Preferred Alternative, because of the potential mode shift from auto and aircraft travel to passenger rail. However, the Preferred Alternative would increase emissions of criteria pollutants and GHGs from power plants because of the increased electrical requirements of the trains under the Preferred Alternative. Nonetheless, the net result is a decrease in emissions of criteria pollutants and GHGs under the Preferred Alternative.
Energy
Chapter 7.14, Energy, presents the changes in energy use for roadways, diesel trains, and electric trains for the Study Area in the year 2040 under the Preferred Alternative as compared to the No Action Alternative. The Preferred Alternative would reduce total energy use by the equivalent of over 236 thousand tons of oil per year.
Changes in energy use of diesel trains are much smaller in scale than those from roadways and electric trains. The Preferred Alternative would reduce roadway energy use. The decrease in roadway energy use is attributed to decrease in VMT under the Preferred Alternative.
The FRA's Travel Demand Model shows that the Preferred Alternative causes a shift in demand from aircraft and bus trips to rail. As such, the shift in travel mode choice results in a reduction in energy use from aircraft and buses under the Preferred Alternative; however, it was not within the scope of this analysis to make quantitative predictions regarding the level of decrease in energy use for aircraft and buses.
Development Growth Patterns
The FRA reviewed the existing goals and objectives of planning documents developed by the states and metropolitan planning organizations within the Study Area to identify compatibility of NEC FUTURE with these plans. NEC FUTURE is compatible, or partially compatible with all planning documents reviewed by the FRA.
In addition, the Preferred Alternative generally supports the goals and objectives related to improved passenger rail transportation and transit-oriented development goals. The Preferred Alternative improves the NEC and the Hartford/Springfield Line and incorporates new segments that, together, expand capacity to grow the role of rail and have the greatest potential for operational benefit. The Preferred Alternative brings the NEC to a state of good repair; maximizes its capacity through alleviation of chokepoints, addition of new tracks and segments at targeted locations; implements service operational efficiencies; removes speed restrictions; reduces trip times; offers frequent metropolitan and enhanced Intercity-Express services; and allows substantial growth for all Regional rail markets. In addition, the Preferred Alternative supports these transit-oriented development goals and objectives by strengthening urban centers and supporting communities along the NEC and the Hartford/Springfield Line with more-frequent, convenient passenger rail service to more places that will be used by more travelers. The Preferred Alternative continues to serve major existing terminals as Hubs and Major Hubs for all passenger rail services, and coordinates schedules to allow for timed transfers at major existing terminals.
The Preferred Alternative supports goals and objectives related to the preservation of the built and natural environment by providing improvements focused on the NEC and at existing stations that result in greater capacity and maximizes capacity through alleviation of chokepoints, addition of new tracks and segments at targeted locations, and implementation of service operational efficiencies. However, the Preferred Alternative is less supportive of these goals and objectives where the Representative Route of the Preferred Alternative includes new segments off the NEC that would potentially affect cultural and historic resources, parklands resources, or undeveloped land covers, such as in Cecil County in Maryland.
Economic growth depends on connectivity and access to labor markets, as described Chapter 3, Purpose and Need. Connectivity and access create economies of scale or agglomeration effects for individual metropolitan areas along the NEC. Economic growth is reflected in employment effects from construction of the rail infrastructure and operation of the NEC; monetized travel-time savings and emission savings associated with mode shift; and improved access to the labor market.
Innovation Districts
Rail is a key asset to emerging "innovation districts" along the NEC, within which economic growth is increasingly taking place. Some examples of innovation districts along the NEC include neighborhoods in Boston, Philadelphia, and Newark, DE. These districts provide an environment for new firms to locate in established urban environments and support the creation of new jobs. The Northeast Corridor Commission report entitled Investing in the Northeast Corridor: Advancing the American Economy explores these districts in more detail.
Employment Effects
The construction and operation of the No Action Alternative and Preferred Alternative would influence economic activity throughout the Study Area. Building the requisite infrastructure and facilities would expand payrolls for the duration of the construction process. Similarly, operating, and maintaining the rail service would expand payrolls in each year the project is operated. The earnings of the newly-hired employees would translate into a proportional increase in consumer demand as these workers purchase goods and services in the region. Table 9-17 shows the anticipated total employment impacts from construction and operation of the No Action Alternative and Preferred Alternative.
| Employment (in Job-Years) | No Action Alternative | Preferred Alternative |
|---|---|---|
| Construction Impacts - Total Employment | 295,650 | 1,385,340 |
| Full O&M Impacts - Total Employment | 2,300 | 23,500 |
| TOTAL Employment | 297,950 | 1,408,840 |
Source: NEC FUTURE team, 2016
Construction
Impacts - Total Employment assumes rolling stock is manufactured in
the United States but outside of the Study Area. For the Preferred Alternative,
the construction impacts represents an average number of job-years.
Travel Market Effects
Investing in the NEC FUTURE program would provide positive transportation market effects (see Table 9-18). The benefits to users and non-users would include reduced travel time, travel cost, reduced likelihood of accidents, and emission reduction savings due to improved mobility, reduced VMT, and subsequent reduction in congestion in the Study Area.
| Preferred Alternative (in millions of $2014) | |
|---|---|
| Total Intercity Travel-Time Savings | $942 |
| Total Emissions Savings | $54 |
| Total Safety Benefits for VMT Diverted to Passenger Rail | $1,283 |
Source: NEC FUTURE team, 2016
Note:
Travel Market savings are compared to the No Action Alternative. Existing
energy profile represented.
Access to Labor Markets
Improved rail service also creates the potential for labor markets to become more interlinked as additional places fall within a 45-minute travel shed (Table 9-19). The greatest gains in accessibility would be located in the markets located in the center of the corridor where the "market reach" extends in two directions. As such, the largest gain in access would occur for residents using Penn Station New York, Newark, Trenton, and Philadelphia.
| Hub Station | No Action Alternative | Preferred Alternative | % Change |
|---|---|---|---|
| Washington Union | 1,670,000 | 1,830,000 | 9% |
| Baltimore Penn Station | 1,600,000 | 1,960,000 | 22% |
| Wilmington Station | 1,570,000 | 2,080,000 | 33% |
| Philadelphia 30th Street | 2,000,000 | 3,780,000 | 89% |
| Trenton | 3,180,000 | 4,630,000 | 45% |
| Newark Penn Station | 5,090,000 | 6,480,000 | 27% |
| Penn Station New York | 3,410,000 | 4,860,000 | 42% |
| New Haven | 820,000 | 1,120,000 | 37% |
| Hartford | 640,000 | 740,000 | 16% |
| Boston South Station | 910,000 | 960,000 | 6% |
| Springfield Union | 420,000 | 420,000 | 0% |
Source: NEC FUTURE team, 2016
Note:
Counts shown exclude Regional rail service. Job counts are representative
of those within a 10-mile radius of stations accessible in a 45-minute
travel time, exclusive of jobs surrounding the origin station. Estimates
are based on 2040 population data and were adjusted where station buffers
overlap. For the Preferred Alternative, counts shown are the change
from No Action Alternative.
Station-Area Development Effects
Development around station access points is among the most visible market change. It is also the most local in terms of geographic scale. The scale and character of the development are influenced by the nature of the rail service provided, as well as the ability of the surrounding area to plan for and provide the other necessary factors to support development around stations. Connecting infrastructure, available parcels of sufficient size to accommodate the new developments, and appropriate policies and zoning are all examples of these necessary and complementary elements of station-area development.
Figure 9-1 summarizes the differences in the number of Local, Hub, and Major Hub stations by location for the No Action Alternative and Preferred Alternative. As stations move along the spectrum from Local station to Major Hub station, they increase the number of modal options and rail services clustered at their locations: The greater the number of connections, the greater the potential for station-area development. Under the Preferred Alternative, the Greater New York-North Jersey, Greater Philadelphia, and Greater Baltimore markets have the greatest gains in stations, with Greater Hartford experiencing modest gains in stations. Moreover, each market area gains one or more Hub stations, which are focal points for development in the surrounding area.
Figure 9-1: Number of Stations of Each Category in the NEC FUTURE Station Typology
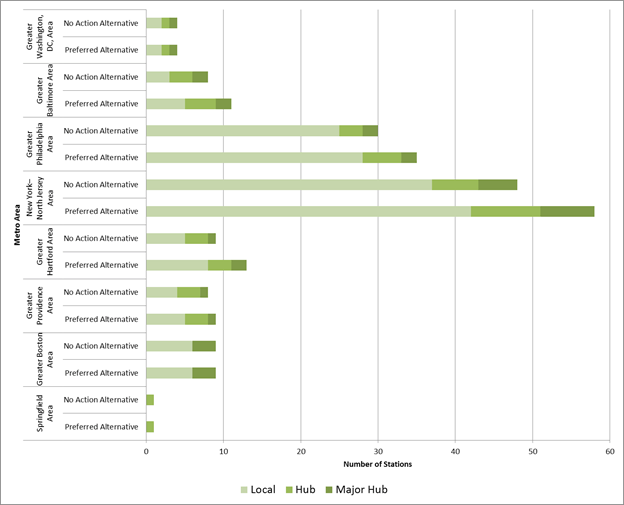
Source: NEC FUTURE team, 2016
In addition to those metrics that evaluate how well the Preferred Alternative meets the identified NEC FUTURE needs, there are other factors for costs and benefits that the FRA considered in evaluating the Preferred Alternative. The environmental impacts, capital and operating costs, constructability, and phasing are all additional considerations used to evaluate the Preferred Alternative.
Chapter 7 of this Tier 1 Final EIS presents the effects-assessments for environmental resources. Each of these assessments is relevant to evaluating the Preferred Alternative. The Preferred Alternative results in both service-related and footprint effects on the built and natural environment. Service-related effects result from changes in the existing rail service, such as increased frequencies or speeds. Footprint effects result from expanding existing infrastructure or providing new infrastructure to support the proposed rail service. Environmental impacts resulting from the Preferred Alternative are likely to occur to various resources that exist within and adjacent to the Representative Route of the Preferred Alternative. Table 9-20 (and summary tables throughout Chapter 7) summarizes the metrics considered. For comparison, effects to resources associated with the Existing NEC + Hartford/Springfield Line are provided.
| Resource | Existing NEC + Hartford / Springfield Line | Preferred Alternative |
|---|---|---|
| Land Cover - Potential Conversion - Developed (acres) | 7,280 | 9,855 |
| Land Cover - Potential Conversion - Undeveloped (acres) | 1,800 | 2,710 |
| Land Cover - Potential Acquisitions - Developed (Existing NEC removed from Preferred Alt) (acres)* | - | 2,535 |
| Land Cover - Potential Acquisitions - Undeveloped (Existing NEC removed from Preferred Alt) (acres)* | - | 1,035 |
| Freshwater Wetlands (acres) | 295 | 510 |
| Floodplains (acres) | 1,345 | 1,920 |
| Saltwater Wetlands (acres) | 205 | 325 |
| Coastal Zone (route miles) | 198 | 279 |
| Ecologically Sensitive Habitat - Terrestrial and Aquatic (acres) | 1,355 | 2,350 |
| Threatened and Endangered (# species) | 17 | 18 |
| Essential Fish Habitat (# species) | 7 | 17 |
| Essential Fish Habitat (# crossings) | 49 | 54 |
| National Historic Landmarks (#) | 0 | 5 |
| National Register of Historic Properties (#) | 51 | 142 |
| Total Population (Affected Environment) | 4,869,980 | 4,995,997 |
| Minority Population (Affected Environment) | 2,610,355 | 2,658,763 |
| Low-Income Population (Affected Environment) | 804,868 | 801,721 |
| Percentage Minority (Affected Environment) | 54% | 53% |
| Percentage Low Income (Affected Environment) | 17% | 17% |
| Environmental Justice Populations (# EJ Tracts) | 731 | 744 |
Source: NEC FUTURE team, 2016
Note:
Effects shown represent the areas/number of a given resource identified
within the Representative Route unless otherwise noted to be associated
with the Affected Environment.
* Acquisitions could result in future
displacements; those displacements will be quantified only as part of
Tier 2 project studies.
Effects would be greater where new segments are proposed. Overall, the Preferred Alternative would affect additional land cover and cultural and historic resources. Maryland and Connecticut would have the highest acreage of land conversions for the Preferred Alternative. Most of the potential conversions of undeveloped land cover would occur in Connecticut, where the addition of the Old Saybrook-Kenyon new segment outside of the NEC through New London County includes many acres of undeveloped land cover. Connecticut tends to have the largest acreage of the following types of undeveloped land cover within the Representative Route for the Preferred Alternative: Open Water, Forest/Shrub, and Wetlands; Maryland has the largest acreages of Grassland/Cultivated land cover. Connecticut also has the most cultural resources and historic properties within the Representative Route. These are primarily National Register of Historic Places (NRHP) properties, and National Register-eligible (NRE) properties. There are 5 NHLs within the Representative Route of the Preferred Alternative, most of which are located in Philadelphia, PA.
Chapter 7.1, Summary of Findings, provides more information on the environmental impacts of the Preferred Alternative and Existing NEC + Hartford/Springfield Line.
The NEC FUTURE capital cost model provides a documented and validated conceptual cost estimate for the Preferred Alternative commensurate with the level of detail required in a Tier 1 EIS. The appropriate level of detail was determined by the FRA and is a function of deliberation, analysis, and engineering assessments, and is consistent with a conservative approach to estimate capital costs of the Preferred Alternative. Actual costs will differ after more-refined engineering and design work is completed. Actual costs will also reflect value engineering, selection of construction and staging methodologies, and price inflation/deflation. The capital costs do not represent or include any specific implementation timelines, project delivery methods, funding sources, penalties or fees associated with construction impacts to existing operations, railroad force-account construction costs that exceed direct labor required for the work, or temporary construction access agreements with the operating railroads.
The FRA prepared representative estimates of the costs associated with operations and maintenance (O&M) of the representative Service Plans for the No Action Alternative and Preferred Alternative. The methodology produced high-level, order-of-magnitude estimates for O&M costs appropriate for a Tier 1 level of review. In conjunction with the capital cost estimates, these O&M cost estimates facilitate comparative cost analysis between the No Action Alternative and Preferred Alternative, for Intercity service. For complete details of the costs and how the capital and O&M costs were developed, see Appendix BB, Technical Analysis on the Preferred Alternative.
Table 9-21 shows the estimated capital costs for the No Action Alternative and Preferred Alternative. The No Action Alternative may have additional costs not accounted for, which would result from emergency or unplanned repairs, as the corridor would remain at heightened risk of service disruption and unpredictable failures. The high and low range of capital costs for the Preferred Alternative represents varying degrees of risk or unforeseen circumstance based upon typical historical project values.
The cost to operate the Preferred Alternative is approximately $2 billion annually, about twice the cost to operate in the No Action Alternative.2 The FRA did not attempt to optimize operator revenue in its analysis. Choices about how to optimize revenues would be dependent on future detailed service and operating plans and policies determined by railroad operators (e.g., types and number of classes of service, yield management practices).
| Category | No Action Alternative | Preferred Alternative - Low | Preferred Alternative - High |
|---|---|---|---|
| Infrastructure | - | $107 | $112 |
| Vehicles | - | $6 | $6 |
| Subtotal | - | $113 | $118 |
| No Action Alternative Projects | $20 | $9 | $9 |
| Total | $20 | $123 | $128 |
Source: NEC FUTURE team, 2016
Note:
Infrastructure costs include professional services; costs do not include
property acquisition costs for yards or stations.
Numbers may not
add due to rounding.
The Preferred Alternative involves construction of significant new rail infrastructure-tunnels, bridges, embankments, new stations and ancillary roads and support facilities-across the NEC over an extended period. Chapter 8, Construction Effects, describes the potential construction types and sequencing that would be required for constructing the Preferred Alternative. Table 9-22 describes the percentage of construction types by route distance for the Existing NEC + Hartford/Springfield Line and the Preferred Alternative.
| Construction Type | Existing NEC + Hartford / Springfield Line |
Preferred Alternative |
|---|---|---|
| Tunnel | 2% | 8% |
| Trench | 1% | 3% |
| At-Grade | 61% | 49% |
| Embankment | 32% | 30% |
| Aerial | 3% | 8% |
| Major bridge | 1% | 2% |
Source: NEC FUTURE, 2015
Note:
Numbers may not add due to rounding
As this table shows, among all construction types, the percentage of the route miles of tunnel construction increases the most in the Preferred Alternative. The Preferred Alternative includes approximately 2.5 miles of new tunnels in Baltimore, and approximately 3 miles of new tunnel under the Hudson River from New Jersey to New York. In Connecticut, the Preferred Alternative includes approximately 15 miles of new tunnel associated with the Old Saybrook-Kenyon new segment.
The next greatest percentage increase in route miles is for aerial construction type. The percentage of route miles of at-grade construction decreases in the Preferred Alternative. This is consistent with addition of new rail segments off of the NEC in a new right-of-way, upgrades (including chokepoint relief projects, new bridges and tunnels), and new rail segments that would be constructed parallel to or along (or over) the NEC.
The Preferred Alternative achieves sufficient capacity, connectivity, and performance to meet future northeast mobility needs in 2040 and beyond, allowing for the adoption and implementation of enhanced service concepts that will positively transform the rail service experience for the passenger. The current level of investment in the NEC, best associated with the No Action Alternative, is insufficient; would provide inadequate rail service, and fails to meet the NEC FUTURE Purpose and Need.
The interrelatedness of the NEC-with Intercity and Regional travel requiring more-frequent and more efficient connections-also suggested the importance of defining a single vision that would serve the entire NEC from end-to-end. Therefore, development of the Preferred Alternative required agreement on a shared vision for the long term, with flexibility built in to respond to local priorities or future uncertainty, and one that would be implementable in a phased manner. Ultimately, the FRA determined that a "grow" vision as defined by Alternative 2 would best meet near and longer term needs of the region, and furthermore could help to grow the role of rail in the future mobility of the northeast. Subsequent Tier 2 project studies will further define the actual effects and benefits.
Table 9-23 summarizes the factors and metrics discussed in this chapter to evaluate the similarities and differences between the No Action Alternative and Preferred Alternative, and illustrates the overall potential for improved mobility and economic growth. Metrics that capture changes in service frequency and travel times demonstrate how the Preferred Alternative would change travel from a local and end-to-end perspective.
| Project Needs Addressed | Metrics for Evaluating | No Action Alternative | Preferred Alternative |
|---|---|---|---|
| Aging Infrastructure | NEC in a state of good repair | NO | YES |
| Capacity | Peak rail capacity utilization (number of trains, peak hour, peak direction) | Washington, D.C.: 6 Hudson River: 24 Boston: 11 |
Washington, D.C.: 20 Hudson River: 52 Boston: 18 |
| Peak trains per hour (Intercity trains at Hudson River Screenline) | * | 3X the No Action | |
| Peak passenger capacity utilization (# of passengers, peak hour, peak direction) | Washington, D.C.: 6,610 Hudson River: 30,374 Boston: 8,236 |
Washington, D.C.: 11,173 Hudson River: 44,993 Boston: 12,718 |
|
| Annual passenger Trips (1,000s of trips) | 439,300 | 542,900 | |
| Intercity | 19,500 | 40,200 | |
| Regional Rail | 419,800 | 502,800 | |
| Annual passenger miles (in 1,000s) | 14,338,900 | 20,608,700 | |
| Intercity | 3,074,500 | 6,966,800 | |
| Regional Rail | 11,264,400 | 13,641,900 | |
| Change in annual Intercity VMT (in millions) | * | -3,000 | |
| % Intercity trips diverted to rail (% of trips on the NEC diverted from other modes) | * | 49% | |
| % Regional trips diverted to rail (% of trips on the NEC diverted from other modes) | * | 17% |
* No Action Alternative values are not applicable. The values shown for the Action Alternatives and Preferred Alternative reflect the absolute or percentage change when compared to the No Action Alternative.
| Project Needs Addressed | Metrics for evaluating | No Action Alternative | Preferred Alternative |
|---|---|---|---|
| Connectivity | Daily trains serving airport stations1 (total number of trains) | BWI: 143 PHL: 72 EWR: 153 T.F. Green: 10 |
BWI: 350 PHL: 332 EWR: 378 T.F. Green: 154 |
| Air-to-rail diversions (annual one-way trips in 1,000s) | * | WAS-NJ/NY: 160 NJ/NY-BOS: 180 PHL-BOS: 30 |
|
| Daily Intercity service (one way) - number of trains for key city-pairs and key stations | WAS-NYC: 38 NYC-BOS: 19 |
WAS-NYC: 136 NYC-BOS: 94 |
|
| Daily Intercity service- number of trains to connecting corridors | Richmond-NYC: 9 Harrisburg-NYC: 14 Albany-NYC: 12 Springfield-NYC: 2 |
Richmond-NYC: 141 Harrisburg-NYC: 24 Albany-NYC: 22 Springfield-NYC: 35 |
|
| Number of Stops by Station (daily) | |||
| Intercity service | Odenton: * | Odenton: 116 | |
| PHL Airport: * | PHL Airport: 116 | ||
| Secaucus: * | Secaucus: 140 | ||
| Providence: 38 | Providence: 177 | ||
| Regional rail service | Odenton: 59 | Odenton: 122 | |
| PHL Airport: 72 | PHL Airport: 216 | ||
| Secaucus: 367 | Secaucus: 782 | ||
| Providence: 36 | Providence: 94 | ||
| Total (Intercity + Regional rail service) | Odenton: 59 | Odenton: 238 | |
| PHL Airport: 72 | PHL Airport: 332 | ||
| Secaucus: 367 | Secaucus: 922 | ||
| Providence: 74 | Providence: 271 |
1 Philadelphia International Airport is served today
by Regional rail service located off the existing NEC. T.F. Green Airport
is served by Regional rail service today; Intercity Rail service to
these airports is included in the Preferred Alternative service plan.
2 For service planning purposes, three long distance trains continuing
south of Washington, D.C., were considered to allow sufficient capacity
to accommodate these services. These trains were not explicitly considered
in ridership forecasting.
* No Action Alternative values are not
applicable. The values shown for the Action Alternatives and Preferred
Alternative reflect the net change when compared to the No Action Alternative.
| Project Needs Addressed | Metrics for evaluating | No Action Alternative | Preferred Alternative |
|---|---|---|---|
| Performance | Approximate Travel-time savings (minutes) for key city-pairs (Intercity-Express times in min saved relative to No Action Alternative) | * | WAS-NYC: 30 NYC-BOS: 45 |
| Best station-to-station travel times1 (hours:minutes) - Intercity-Corridor2 | WAS-PHL: 1:35 PHL-ODN: N/A PHL-NHV: 2:50 |
WAS-PHL 1:20 PHL-ODN 1:20 PHL-NHV 2:10 |
|
| Top speed by segment | WAS-NYC: 160 NYC-BOS: 150 |
WAS-NYC: 160 NYC-BOS: 160 |
|
| Resiliency | % At-risk construction type (trench and at-grade): End to end - complete area | 62% | 53% |
| % At-risk construction type (trench and at-grade): End to end - within areas susceptible SLR, SS, RF3 | 12% | 10% | |
| Environmental Sustainability | Change in greenhouse gas and criteria pollutants (tons/year) - Existing Energy Profile | ||
| CO2e | * | -713,840 | |
| CO | * | -6,040 | |
| VOC | * | -75 | |
| NOx | * | -225 | |
| PM10 | * | -75 | |
| PM2.5 | * | -25 | |
| SO2 | * | 370 | |
| Change in energy use (MMBtu) | -9,375,030 | ||
| Roadways | * | -11,688,940 | |
| Diesel trains | * | 28,455 | |
| Electric trains | * | 2,285,455 |
1 Travel times are rounded to the nearest five minutes
2 Stations identified by Amtrak station code except for Odenton, MD
(ODN). See Chapter 4, Table 4-9 for Amtrak station codes.
3 Sea Level
Rise (SLR), Storm Surge Flooding (SSF), Riverine Flooding (RF)
*
No Action Alternative values are not applicable. The values shown for
the Action Alternatives and Preferred Alternative reflect the net
change when compared to the No Action Alternative.
| Project Needs Addressed | Metrics for evaluating | No Action Alternative | Preferred Alternative |
|---|---|---|---|
| Economic Growth | Employment impacts (Number of job-years) | 297,950 | 1,408,840 |
| Construction employment effects | 295,650 | 1,385,340 | |
| Rail operations employment effects | 2,300 | 23,500 | |
| Annual travel market savings ($ millions) | |||
| Total Intercity Travel-Time Savings | * | $942 | |
| Total Emissions Savings | * | $54 | |
| Total Safety Benefits for VMT Diverted to Passenger Rail | * | $1,283 | |
| Jobs accessible in a 45-minute train-travel time | WAS: 1,670,000 NYP: 3,410,000 BOS: 910,000 |
WAS: 1,830,000 NYP: 4,860,000 BOS: 960,000 |
|
| Environmental Impacts | Land Cover - Potential Conversion - Developed (acres) | 7,280 | 9,855 |
| Land Cover - Potential Conversion - Undeveloped (acres) | 1,800 | 2,710 | |
| Total Population (Affected Environment)1 | 4.9 million | 5.0 million | |
| Environmental Justice Populations (Number of EJ Tracts) | 731 | 744 | |
| Section 4(f)/parks (Acres) | 475 | 675 | |
| Section 6(f) (Acres) | 55 | 110 | |
| National Register of Historic Properties2 (number) | 51 | 142 | |
| Cost | Total capital costs ($B 2014) | $20 | $123-$128 |
| Total Intercity Operating Costs ($M 2014) | $890 | $1,980 |
Source: NEC FUTURE team, 2016
Note:
The No Action Alternative includes the NEC and the Hartford/Springfield
Line. The FRA did develop a representational footprint for both the
Existing NEC and Existing Hartford/Springfield Line (Existing NEC +
Hartford/Springfield Line), and used that to understand resources that
could be physically affected by the projects that will be implemented
under the No Action Alternative.
1 The total population of theNo
Action Alternative for the Tier 1 Final EIS was updated to include the
Affected Environment of the Hartford/Springfield Line. As a result,
the population of the No Action Alternative is greater than the population
provided in the Tier 1 Draft EIS. The population was 4.4 million in
the Tier 1 DEIS. See Chapter 7 for additional information.
2 The
FRA also considered National Register-eligible (NRE) rail-related properties
in the NEC as designated by the National Park Service in prior environmental
studies. The NRE properties identified are included in the total count
for National Register of Historic Properties.
* The values for the
Action Alternatives and Preferred Alternative reflect change relative
to the No Action Alternative (i.e. the total Intercity travel time savings
and total emissions savings over the No Action Alternative).
1 Philadelphia International Airport is served today by Regional rail service located off the existing NEC. T.F. Green Airport is served by Regional rail service today; Intercity Rail service to these airports is included in the Preferred Alternative service plans.
2 Operating costs in $2014. Volume 2, Appendix B, Operations & Maintenance Cost Technical Memorandum, details the O&M cost methodology.
The information posted on this website includes hypertext links or pointers to information created and maintained by other public and/or private organizations. The FRA provides these links and pointers solely for information and convenience. When users select a link to an outside website, they are leaving the NEC FUTURE website and are subject to the privacy and security policies of the owners/sponsors of the outside website. The FRA does not control or guarantee the accuracy, relevance, timeliness or completeness of information contained on a linked website, or endorse the organizations sponsoring linked websites, the views they express, or the products/services they offer. The FRA cannot authorize the use of copyrighted materials contained in linked websites and is not responsible for transmissions users receive from linked websites.