S.2 Consideration of Other Transportation Modes and Freight Rail Service
S.4 Statement of Purpose and Need (Chapter 3)
S.5 Preferred Alternative (Chapter 4)
S.6 Analysis and Evaluation of Alternatives
This Tier 1 Final Environmental Impact Statement (EIS) presents the Preferred Alternative identified by the Federal Railroad Administration (FRA) for NEC FUTURE and documents the public comment period on the Tier 1 Draft EIS. This document provides the rationale for the FRA's preference (Chapter 4) and presents the evaluation of the Preferred Alternative (Chapters 5-9). It also provides responses to public comments received during the Tier 1 Draft EIS comment period (Chapter 11 and Appendix JJ).
This Tier 1 Final EIS is presented in two volumes:
The Tier 1 EIS was prepared in compliance with the National Environmental Policy Act (42 USC §4332 et seq.) and implementing regulations (40 CFR Parts 1500-1508) (NEPA), and other applicable laws and regulations. It presents the analysis completed by the FRA to assess the potential effects of NECFUTURE rail investment alternatives on the economy, transportation system, and the human and natural environment within the Study Area. This Tier 1 Final EIS provides information to inform the public and stakeholders about the findings of the analysis, and will inform the FRA's final decision to select an alternative for NECFUTURE. No sooner than 30-days following the Tier 1 Final EIS, the FRA will select an alternative and document its selection in the Record of Decision (ROD). At that point, the alternative to be carried forward for implementation will be called the Selected Alternative. The FRA will then prepare a phasing and implementation plan for the Selected Alternative in the Service Development Plan (SDP). Chapter 10 provides information on phasing and implementation.
Concurrent with the Tier 1 Final EIS, the FRA is conducting a review of potential effects on historic properties under Section 106 of the National Historic Preservation Act. (Appendix GG presents the Final Programmatic Agreement under Section 106.)
This Tier 1 Final EIS and subsequent ROD do not allow construction to begin on the Selected Alternative, but rather provide a framework to inform future studies to advance the Selected Alternative. This Tier 1 Final EIS evaluates representative routes and service plans for analytical purposes; the Selected Alternative will be refined and carried through a series of project-level planning efforts (Tier 2 projects) to determine and evaluate site-specific details. As appropriate, feasibility studies may be conducted prior to advancing Tier 2 projects to consider location-specific constraints and opportunities. The Selected Alternative will be implemented incrementally over the next few decades.
NECFUTURE is a comprehensive planning effort to define, evaluate, and prioritize future investments in the Northeast Corridor (NEC) from Washington, D.C., to Boston. The NEC is the rail transportation spine of the Northeast and a key component of the region's transportation system. The NEC supports the operation of eight Regional rail authorities and Amtrak - the Intercity rail service provider - as well as four freight railroads.
The FRA launched NECFUTURE in 2012 to evaluate improvements to address passenger rail transportation needs within the Study Area (Figure S-1). NECFUTURE will result in a Passenger Rail Corridor Investment Plan (PRCIP) for the NEC that will establish a framework for future investment in the corridor through 2040 and beyond. The PRCIP comprises a Tier 1 EIS and an SDP. Together, these documents will provide a long-term vision for the role of passenger rail on the NEC in the regional transportation system and a phased investment plan to accomplish that vision.
In developing the alternatives for evaluation in this Tier 1 EIS process, the FRA considered a broad spectrum of future possibilities to meet the Purpose and Need. The unique geographic, technical, and institutional complexity of NECFUTURE led the FRA to an innovative approach to developing and evaluating alternatives, focused on analysis of markets and services. This process is described in greater detail in various alternatives documents, including the Initial Alternatives Report, Preliminary Alternatives Report, Preliminary Alternatives Evaluation Report, and Tier 1 EIS Alternatives Report (see Volume 2, Appendix B).
The FRA began the evaluation of alternatives with an initial list of 98 rail market and service options, developed through extensive outreach with the NECFUTURE stakeholders, the Northeast Corridor Commission, and the general public. These Initial Alternatives were then organized into 15 Preliminary Alternatives representative of the broad spectrum of approaches that could be used to serve existing and new markets in the region. (See Volume 2, Appendix B, Preliminary Alternatives Evaluation Report, for additional information regarding the Preliminary Alternatives and their evaluation.) The FRA considered whether and how the Preliminary Alternatives met the Purpose and Need, and analyzed their benefits in terms of ridership, travel time, service quality, and performance (for those that included second-spine route options). Based on this analysis, the FRA repackaged the Preliminary Alternatives to form the alternatives analyzed in the Tier 1 Draft EIS.
Figure S-1: Study Area Map
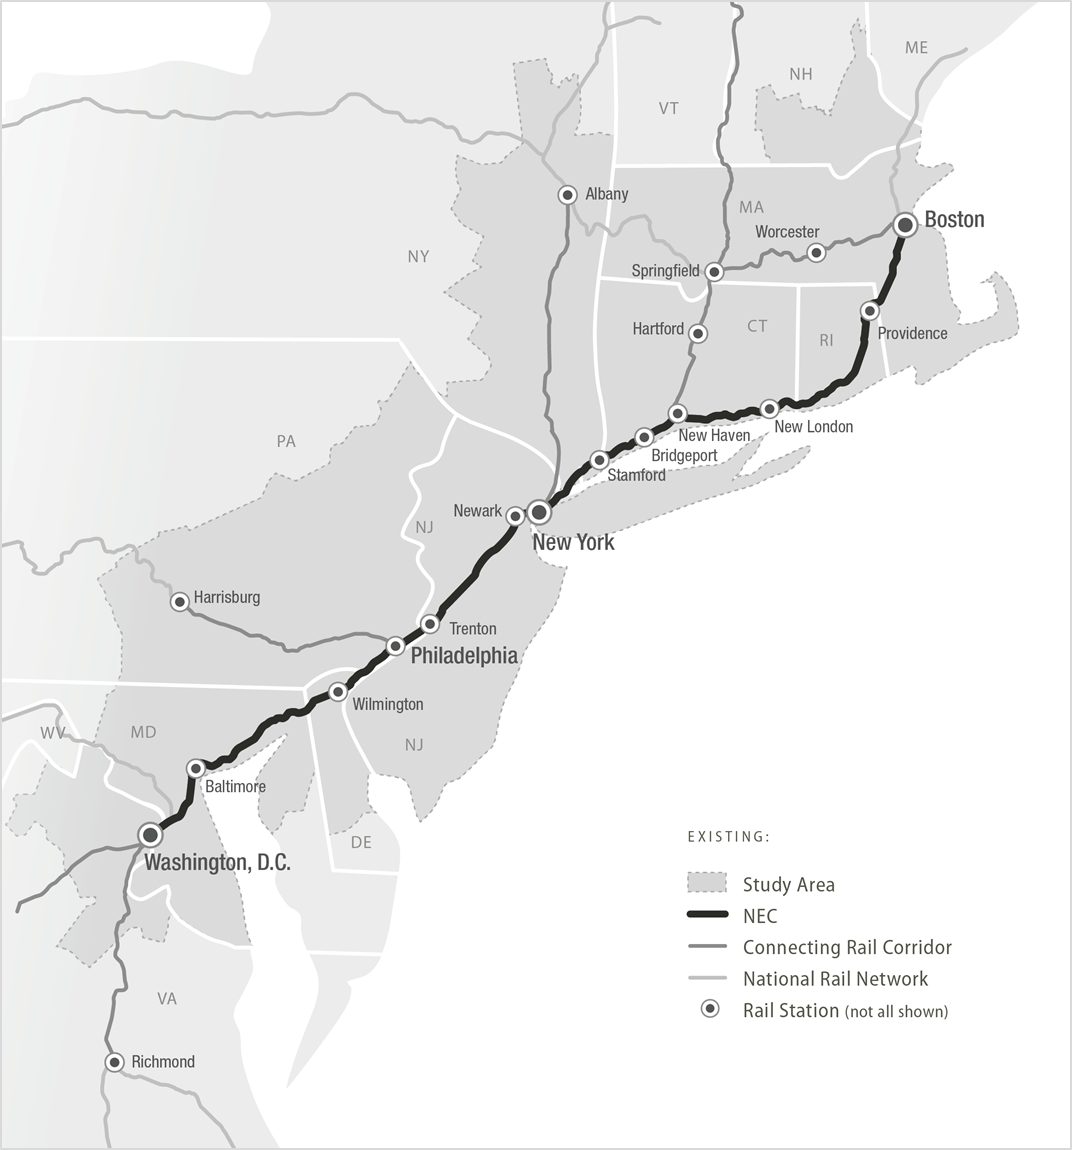
Source: NEC FUTURE team, 2016
In the Tier 1 Draft EIS, the FRA considered three Action Alternatives that represent unique visions for the role of rail in the transportation system of the Northeast, and enable a broad analysis of benefits and impacts. The three Action Alternatives are the following:
The FRA compared the Action Alternatives to a No Action Alternative using ridership and service planning characteristics estimated with models customized for this effort. The transportation effects, economic effects, and environmental assessments of the Action Alternatives are presented in Volume 2, Chapters 5, 6, and 7, respectively.
On November 10, 2015, the FRA released the Tier 1 Draft EIS for public review and comment, along with the Draft Programmatic Agreement under Section 106 of the National Historic Preservation Act. The FRA established an initial public comment period of over two months, ending on January 30, 2016. In response to requests for additional time to comment on the Tier 1 Draft EIS, the FRA subsequently extended the comment period to February 16, 2016. Public hearings were held during December 2015 and January 2016. During the 95-day comment period, the FRA received over 3,200 submissions on the Tier 1 Draft EIS from individuals, agencies, and organizations. The comments provided useful insights into the concerns of the traveling public and helped to guide the FRA in developing a Preferred Alternative that responds to the needs of travelers in the Study Area, provides the best opportunities for economic growth, and minimizes effects to built or natural environmental features of particular concern. Additional information about the comment period activities and comments received is presented in Volume 1, Chapter 11 and Appendix FF.
While NECFUTURE focuses on passenger rail, it is important to understand the connectivity and interface of rail with other modes in the Northeast transportation network. Travelers within the NEC have multiple transportation options to move through and along it, including air, rail, automobiles, and buses. To better understand the role of rail within this transportation network, the FRA began by examining the role that rail service plays today in the Northeast transportation network and considering what role it could play in the future. These questions were fundamental to how the FRA developed the rail alternatives evaluated in the Tier 1 Draft EIS and how the FRA identified the Preferred Alternative evaluated in this Tier 1 Final EIS.
NEC FUTURE is focused on passenger rail services, and the Preferred Alternative reflects the FRA's commitment to expand the passenger rail network; however, NEC FUTURE and the Preferred Alternative also consider how passenger-focused investments in the Study Area can highlight opportunities to accommodate future growth and improvement of freight rail service. Although freight rail service is operated privately, the FRA recognizes that freight rail service is critical to the continued vitality and competitiveness of the Northeast economy.
Passenger rail services that operate along the NEC rail network are a critical component of the transportation system in the Study Area. By 2040, continued population and employment growth in the Study Area is expected to create increasing demand for travel options across the passenger transportation system - rail, air, auto, transit, and intercity bus. Yet the aging infrastructure and capacity limitations of the NEC already result in congestion and delays for daily commuters and for regional1 and interregional2 travelers. Forecast growth in population and employment in the Study Area will put increasing pressures on this already constrained NEC rail network.
The 457-mile NEC and its connecting rail corridors3 form the most heavily utilized rail network in the United States. The NEC ranks among the busiest rail corridors in the world, moving more than 750,000 passengers every day4 on 2,200 trains.5 Freight operators share the NEC with passenger railroads and are responsible for the movement of over 350,000 car loads of freight per year on the NEC.6 This volume of traffic and diversity of service today operates on an NEC with capacity constraints that require scheduled and real-time trade-offs in frequency, speed, and performance of passenger and freight services. The congestion caused by these capacity constraints limits operations and opportunities to improve or expand passenger rail services. The NEC's aging infrastructure further limits operations and constrains the ability to improve and expand services. This infrastructure, in many cases built over 100 years ago, does not provide the resiliency or redundancy necessary to respond to unanticipated natural disasters or other disruptive events.
Growth in population and employment in the region, combined with changes in travel preference, will increasingly require a level of service and connectivity that cannot be supported by the existing NEC infrastructure. Challenges to passenger rail travelers today include poorly coordinated transfers and infrequent service, which makes other travel choices more appealing. A well-defined and coordinated investment program to support both preservation and enhancement of the NEC is essential to meet the needs of the NEC's passenger and freight markets in the coming decades. A rail transportation system that better connects residents and visitors with established and growing business centers in the Study Area is critical to the economic health of the region.
The following is the statement of Purpose and Need adopted for the NECFUTURE Tier 1 EIS:
The purpose of the NECFUTURE program is to upgrade aging infrastructure and to improve the reliability, capacity, connectivity, performance, and resiliency of future passenger rail service on the NEC for both Intercity and Regional trips, while promoting environmental sustainability and continued economic growth.
Overall needs addressed by NECFUTURE include aging infrastructure, insufficient capacity, gaps in connectivity, compromised performance, and lack of resiliency. These needs are essential to support the reliability of the passenger rail system. In addition, there is a need to promote environmental sustainability and economic growth. These needs are summarized below:
In addressing the overall needs of aging infrastructure, insufficient capacity, gaps in connectivity, compromised performance, and lack of resiliency, the FRA is committed to promoting environmental sustainability and continued economic growth:
To identify a Preferred Alternative, the FRA followed an iterative process that provided the flexibility necessary to evaluate various factors together and better understand the interrelationships between markets, service, infrastructure, and environmental considerations. A full description of this process and definition of the Preferred Alternative is provided in Chapter 4, Preferred Alternative. The FRA considered environmental and other analytical findings of the Tier 1 Draft EIS, public and stakeholder comments, and the FRA's objectives for guiding NEC investments (policy objectives) in identifying a Preferred Alternative.
The Preferred Alternative represents achievement of the "grow" vision described in Alternative 2 and combines elements presented in the Tier 1 Draft EIS Action Alternatives; however, it is not a one-for-one match to any of the Action Alternatives presented in the Tier 1 Draft EIS. The FRA structured the evaluation of the Action Alternatives to facilitate selection of the most appropriate elements of each in defining a Preferred Alternative. To that end, the decision to strive for a "grow" vision for the NEC then led the FRA to review geographically distinct sections of the NEC, balance the service objectives with the various infrastructure options, and select a fit that best minimized environmental effects.
NEC FUTURE Service Types
Intercity-Corridor is Intercity service that operates both on the NEC and on connecting corridors that reach markets beyond the NEC. These trains provide connectivity and direct one-seat service to large and mid-size markets on the NEC.
Intercity-Express is premium Intercity rail service operating at speeds of 160-220 miles per hour (mph), making limited stops and only serving the largest markets. Intercity-Express service offers the shortest travel times for Intercity trips, higher-quality onboard amenities, at a premium price, using high-performance trainsets.
Metropolitan is the new Intercity service envisioned in NEC FUTURE with high-performance trainsets that operate on infrastructure tailored to regular service patterns (clockface headways), Metropolitan trains can provide faster journeys stopping at more destinations more frequently, at a lower cost and with timed connections with express Intercity and Regional train services.
Regional Rail is service within a single metropolitan area to local markets. Regional rail trains provide local and commuter-focused service characterized by relatively low fares and a high percentage of regular travelers.
The Preferred Alternative improves the NEC and adds new segments that, together, expand capacity to grow the role of rail and create the potential for operational benefits. With up to 5 times more Intercity service, expanded Regional rail service, and the implementation of railroad operating efficiencies, the Preferred Alternative reduces trip times, offers frequent enhanced Intercity-Express service, introduces Metropolitan service, and allows substantial growth for NEC commuter rail markets. The Preferred Alternative brings the NEC to a state of good repair and maximizes its capacity through alleviation of chokepoints and the addition of new infrastructure (new tracks and new segments) to bring the NEC to four tracks at most locations. This not only supports more-efficient and more traveler-friendly service, but balances capital costs with operating efficiencies such as higher capacity train sets, reduced dwell time at stations, and through-service at major terminals. The markets served by the NEC expand to include more one-seat ride destinations on the NEC, and new and improved intermodal connections, such as rail-airport connections at Philadelphia International Airport and Bradley International Airport.
In summary, the Preferred Alternative:
The FRA conducted an extensive analysis of the Preferred Alternative, Action Alternatives, and the No Action Alternative. The No Action Alternative establishes a baseline for analysis and includes projects currently planned and programmed and repairs needed to keep the railroad operating. The No Action Alternative has not changed since the publication of the Tier 1 Draft EIS. For more information on the No Action Alternative, see Chapter 4.
As described in separate chapters of this Tier 1 Final EIS, these analyses considered transportation effects, economic effects, environmental consequences, and construction effects, as well as capital and operations and maintenance costs. A variety of indicators and metrics are presented for each topic and used to compare the Preferred Alternative with the No Action Alternative in the Tier 1 Final EIS. A cross-cutting evaluation, presented in Chapter 9, links these findings to the needs defined in the Purpose and Need statement.
This summary briefly describes each of the analyses performed and highlights several key findings. The reader is referred to the appropriate chapters within this Tier 1 Final EIS for additional context, details, and conclusions.
The No Action Alternative includes projects and transportation improvements that range in scope and complexity. Most of the projects and activities included as part of the No Action Alternative occur within the existing NEC right-of-way or as part of the planned improvements to the Hartford/Springfield Line. Under the No Action Alternative, passenger rail service along the NEC will operate and provide approximately the same level of service as provided today. As a result, new service-related effects from passenger rail on noise and vibration will be unlikely. However, service-related effects on air quality could result from increased congestion on the overall multimodal transportation network. "Footprint" effects on environmental resources under the No Action Alternative will vary, depending on the scope of the project being implemented. In a few cases, projects that are part of the No Action Alternative have footprints and effects that extend beyond the existing rail right-of-way. Those types of projects, depending on the scope and complexity, have a greater potential to affect environmental resources than those activities occurring within the existing rail right-of-way. However, the majority of passenger rail projects included in the No Action Alternative will occur within the existing rail right-of-way.
Implementation of the Preferred Alternative would dramatically change rail transportation in the Northeast. There would be up to 5 times as much Intercity service, with reductions in trip time. The number and frequency of Regional rail trains would also increase, attracting a greater proportion of trips to rail and accommodating the growth in population and employment projected for the Northeast. The Preferred Alternative would also result in improved reliability and greater Intercity and Regional rail options for travelers compared to the No Action Alternative. These improvements would effectively change how people travel in the Northeast. The benefits from the various improvements implemented as part of the Preferred Alternative - new segments, new tracks, reduced chokepoints, minimized freight rail conflicts, eliminated localized speed restrictions, better coordinated services, and new operational efficiencies - are reflected in the projected increase in Intercity and Regional rail ridership.
The No Action Alternative does not have sufficient capacity to accommodate projected demand for rail services. Because of this constraint, potential rail travelers make other choices, imposing a drag on the Northeast region's economy. The Preferred Alternative removes this capacity constraint by providing sufficient capacity to meet projected demand for rail travel. The Preferred Alternative also increases service frequency and connectivity among the metropolitan economies of the NEC relative to the No Action Alternative.
The construction and operation of the rail improvements and services under the Preferred Alternative would result in changes to economic activity throughout the Study Area. Some changes would be immediate, while others would take place over a longer period. These economic effects are compared to those that would occur under the No Action Alternative and include economic development response, travel market effects, construction and rail sector employment effects, and indirect effects associated with potential economic growth.
The Preferred Alternative at least doubles, and in some instances, more than quadruples, the number of daily trains serving metropolitan areas along the corridor and allows travelers in these areas to access between 10 and 21 additional destinations via direct Intercity connection. The increase in Regional rail would provide greater accessibility for workers and employers. Business productivity would benefit from employers' access to a broader and more diverse labor market. The increase in access to people would be greatest in Philadelphia, Trenton, Newark (NJ), and New York where the net change in people accessible within a 45-minute train travel time of each economy's hub station in 2040 would exceed 3,000,000 relative to the No Action Alternative.
The incorporation of the Hartford/Springfield Line into the Preferred Alternative expands the area of mobility and benefits provided by Intercity service. For example, the Preferred Alternative would allow travelers in Springfield to access 17 additional destinations via a direct rail connection. This increase in connectivity to other destinations along the NEC would intensify the potential for station-area development.
The expanded range of services and price options available under the Preferred Alternative would provide rail travelers with greater flexibility to select a service meeting their trip needs. These expanded choices would improve the ability of NEC travelers to select trips matching their preferred trip time and cost characteristics, while also enjoying the safety and air quality benefits of the rail travel mode. For example, when both the value of travel time and travel cost are considered jointly, the net benefit for travelers diverting from other modes (air, auto, and bus) to rail is estimated to be over $300 million annually under the Preferred Alternative. These travel cost savings represent real gains in disposable income that would be available for other types of expenditures or saving.
Potential construction effects would occur primarily within the Affected Environment and represent a large, one-time stimulus to the economy. Construction jobs (measured as job-years) range from approximately 300,000 under the No Action Alternative to more than 1.4 million under the Preferred Alternative. Additional hiring would be required to operate and maintain the expanded rail service under the Preferred Alternative; the Preferred Alternative would support approximately 23,500 jobs related to operation and maintenance (measured as job-years), in comparison to 2,300 jobs under the No Action Alternative.
The expansion of Intercity service proposed in the Preferred Alternative would generate revenues in excess of projected operation and maintenance (O&M) costs. As such, no additional public subsidy is anticipated for the operation of the representative Intercity service included in the Preferred Alternative. While the Tier 1 Final EIS analysis did not seek to optimize revenues, future, more-detailed service planning could change the mix of services and enhance net revenue potential.
Induced growth can result in both positive and negative indirect effects. The potential for induced growth effects is higher under the Preferred Alternative relative to the No Action Alternative. The region north of New York City would have a higher potential for indirect effects than the region south of New York City. In addition, many metropolitan areas along the Preferred Alternative, particularly in and south of New York City, gain one or more Hub stations, which are focal points for development in the surrounding area. Hubs and Major Hub stations support greater development intensity than Local stations, and have the potential for indirect effects as a result of induced growth.
The FRA analyzed the effects of the Preferred Alternative on the resources shown in Table S-1. For each resource, an Affected Environment was studied to assess potential for impact and was defined generally as a swath of land centered on the Representative Route for the Preferred Alternative. The approach and methodologies used are the same as those used to evaluate the Action Alternatives in the Tier 1 Draft EIS. Some potential environmental effects are due to changes in the physical footprint of the rail infrastructure, while others are due to changes in the type and volume of passenger rail service associated with the Preferred Alternative. The environmental effects assessment is based on readily available secondary source data, including geographic information system (GIS) data, published reports, and technical analyses. No field investigations occurred as part of this analysis.
| Resource | Description of Resource | Affected Environment |
|---|---|---|
| Land Cover | Land cover within the Affected Environment | ½-mile-wide swath centered on the Representative Route for the Preferred Alternative |
| Agricultural Lands (Prime Farmlands and Timberlands) | Prime farmland and timberlands | 2,000-foot-wide swath centered along Representative Route for the Preferred Alternative |
| Parklands and Wild and Scenic Rivers | Publicly owned parklands; parklands receiving funding from the Land and Water Conservation Fund Act; Rivers identified as Wild and Scenic by the National Rivers Inventory within the Affected Environment | 2,000-foot-wide swath centered along Representative Route for the Preferred Alternative |
| Hydrologic/Water Resources | Coastal zones and saltwater wetlands, freshwater resources (including wetlands), and floodplains | 2,000-foot-wide swath centered on the Representative Route |
| Ecological Resources | Critical habitats and federally listed Threatened & Endangered Species | 3,000-foot-wide swath centered along Representative Route for the Preferred Alternative |
| Geologic Resources | Soil, geological, groundwater, and topographic resources | 3,000-foot-wide swath centered along Representative Route for the Preferred Alternative |
| Hazardous Waste and Contaminated Material Sites | Known sources and potential suspected sources of contaminated and hazardous materials | 2-mile-wide swath centered along Representative Route for the Preferred Alternative |
| Cultural Resources and Historic Properties | Resources listed in or eligible for listing in the National Register of Historic Places within the Affected Environment or identified as significant by Indian Tribes | 1-mile-wide swath centered along Representative Route for the Preferred Alternative |
| Visual and Aesthetic Resources | Prominent visual resources and aesthetic qualities within the Affected Environment | 1-mile-wide swath centered along Representative Route for the Preferred Alternative |
| Environmental Justice | Minority and low-income populations within the Affected Environment | 1-mile-wide swath centered along Representative Route for the Preferred Alternative |
| Noise and Vibration | Ambient noise and vibration conditions, and noise-sensitive land cover categories | 5,000-foot-wide swath centered along Representative Route for the Preferred Alternative |
| Air Quality (including greenhouse gas emissions) | Current attainment status for criteria pollutants established by the U.S. Environmental Protection Agency for air-sheds within the Study Area | Determined by metropolitan planning organization by state within the Study Area |
| Energy | Energy consumed, particularly by the transportation sector | Entire Study Area |
Note: Chapter 5 addresses transportation effects, and Chapter 6 addresses economic effects and growth.
| Resource | Description of Resource | Affected Environment |
|---|---|---|
| Climate Change and
Adaptation (excluding greenhouse gas emissions) |
Identification of areas susceptible to the impacts of climate change (sea level rise, storm surge and/or extreme heat and cold events) | For flood hazards: 2,000-foot-wide swath |
| For extreme heat and cold events: Entire Study Area | ||
| Section 4(f) and Section 6(f) Resources | Parklands converted to transportation use, including publicly owned public parks, recreation areas, and wildlife/waterfowl refuges | 2,000-foot-wide swath centered along Representative Route for the Preferred Alternative |
| Converted lands or facilities that were acquired with Land and Water Conservation Fund Act funds | ||
| Historic resources converted to transportation use, including historic sites of local, state or national significance (eligible or listed) | 1-mile-wide swath centered along Representative Route for the Preferred Alternative | |
| Electromagnetic Fields and Electromagnetic Interference | Electromagnetic Fields (EMF) associated with electric conventional or high-speed train operations and electromagnetic interference that occurs when EMFs are produced | 2,000-foot-wide swath centered on Representative Route for the Preferred Alternative |
| Safety | Operational, infrastructure and overall modal safety | Entire Study Area |
| Public Health | Potential public health-related effects for each of the relevant Tier 1 Final EIS resource areas | As per the resource areas |
| Cumulative Effects | Combined result of the incremental direct and indirect effects of the Tier 1 Final EIS Preferred Alternative as well as the effects of other past, present, and reasonably foreseeable future actions, regardless of agency, on key resources | Study Area, expanded to include connecting corridors |
Source: NEC FUTURE team, 2016
In general, impacts on environmental resources would be greatest in areas where the Representative Route includes new segments. These areas are often less developed than the current NEC. However, some impacts would exist to resources located along and within the existing NEC right-of-way. The Preferred Alternative also includes improvements to the existing NEC; therefore, all effects-assessments consider potential effects that occur to both the existing NEC and any proposed off-corridor routing.
The Preferred Alternative and its construction characteristics are the basis for the analysis in the NEC FUTURE Tier 1 EIS. They illustrate necessary improvements to achieve the Preferred Alternative service and performance objectives. As part of the Tier 1 process, the FRA has determined the necessity for new segments in particular geographic sections of the NEC in order to meet the Purpose and Need, and has identified a representative route for each potential new segment. The FRA or another federal agency providing funding for a particular project will evaluate specific locations for new segments as part of the Tier 2 project studies, prior to making any decision regarding new segment locations.
The Preferred Alternative would result in both service-related and footprint effects on the built and natural environment. Service-related effects would result from changes in the existing rail service, such as increased frequencies or speeds. Footprint effects would result from expanding existing infrastructure or providing new infrastructure to support the proposed rail service. As stated in Chapter 5, Transportation, service provided by the implementation of the Preferred Alternative would dramatically change rail transportation in the Northeast by providing up to 5 times as much Intercity service, significantly reducing trip times, increasing frequency of Regional trains, and ultimately providing a more reliable service.
Changes in service levels and speeds would also result in changes in noise and vibration, air quality, and energy consumption. All counties along the Representative Route of the Preferred Alternative would have moderate to severe noise impacts that would require mitigation; fewer counties would be affected by vibration. However, implementation of the Preferred Alternative would result in net benefits to air quality within the Study Area and a net total decrease in greenhouse gases (GHG). Service changes result in an overall decrease in energy use.
The Preferred Alternative has the potential to contribute to indirect and cumulative effects. Induced growth is a likely outcome of implementing the Preferred Alternative, as travelers would have greater options in terms of connecting places of employment to their residences. Such expansion of transportation options may result in increased development densities around stations and people choosing to live farther from their places of employment and driving to nearby stations. Expansion of infrastructure in these areas could result in impacts to environmental resources. Furthermore, effects identified could contribute cumulatively to effects on like resources by other projects within the Study Area.
Physical or footprint-related effects would be greater where new segments are proposed. In many areas, the Preferred Alternative would reduce potential footprint impacts as compared to the Action Alternatives. Effects identified through this Tier 1 EIS process will be further evaluated in subsequent Tier 2 project studies when more-detailed design and engineering are conducted. Information provided by this analysis is useful to help understand areas that need further evaluation and coordination with regulating agencies to confirm impacts and to identify permit needs and mitigation. The FRA sees this analysis as a starting point to further minimize impacts to resources as planning for the Tier 2 projects progress. Chapter 7.1 provides a summary of effects identified and the rest of Chapter 7 provides further detail on each resource analyzed.
The Preferred Alternative would involve construction of significant rail infrastructure - tunnels, bridges, embankments, stations, and ancillary roads and support facilities - across the Affected Environment over an extended time period. Minimizing construction impacts on ongoing rail operations can be best planned and achieved through the packaging of projects into multiple phases. Through such phasing, individual projects can be timed to meet a number of important objectives. These include optimizing the benefits across the NEC of complementary capacity and travel-time projects, balancing the demand on resources, and spacing projects to take maximum advantage of construction outages and minimize adverse impacts on ongoing train operations. The SDP will include a full phasing plan for the Selected Alternative that seeks to achieve these benefits.
Subsequent planning and environmental compliance processes associated with Tier 2 projects will assess temporary construction-related effects to the natural and built environment. Tier 2 project analysis will be based upon site-specific design and construction methods, as well as construction scheduling and sequencing. Project sponsors leading subsequent Tier 2 project studies will complete more-detailed sequences of construction activities and specific construction-related project tasks. Tier 2 project analysis will include field investigations, subsurface testing, and require project-specific measures to reduce and/or mitigate construction impacts. Consultation with regulatory agencies regarding temporary construction effects and development of agreed-upon permit requirements and conditions will also be undertaken during Tier 2 evaluations.
The FRA developed capital cost estimates to understand the difference between the No Action Alternative and Preferred Alternative. Volume 2, Appendix B, Capital Costs Technical Memorandum, details the methodology used to estimate capital costs, and Volume 1, Appendix BB, Technical Analysis on the Preferred Alternative, describes the cost estimating process for the Preferred Alternative.
An estimate of the capital cost of the No Action Alternative is $20 billion in 2014 dollars. This includes $8billion in funded projects, $1 billion in funded and unfunded mandates, and $11 billion in unfunded projects that are necessary to keep the railroad operating. The estimated $9 billion cost of the first two types of projects (funded or mandated projects) is also included in each of the Action Alternatives. The No Action Alternative may have additional costs from emergency or unplanned repairs since the corridor will remain at heightened risk of service disruption and unpredictable failures. These additional costs are not accounted for in the estimate.
Table S-2 presents the estimated costs of the Preferred Alternative. Capital costs represent a range based on low to high allocated contingency rates.10 An average capital cost estimate for the Preferred Alternative is presented as a range of lowest to highest values.
| Category | Preferred Alternative - Low | Preferred Alternative - High |
|---|---|---|
| Infrastructure | $107 | $112 |
| Vehicles | $6 | $6 |
| Subtotal | $113 | $118 |
| No Action Alternative Projects | $9 | $9 |
| Total | $123 | $128 |
Source: NEC FUTURE team, 2016
Notes:
Infrastructure costs include professional services; costs do not include
property acquisition costs for yards or stations.
The FRA also estimated annual operating and maintenance costs for each alternative. Volume 2, Appendix B.9, Operations & Maintenance Cost Technical Memorandum, details the O&M cost methodology, and Volume 1, Appendix BB, Technical Analysis of the Preferred Alternative describes the cost estimating process for the Preferred Alternative.
Costs and revenues associated with the No Action Alternative were not adjusted to reflect the decrease in reliability and insufficient capacity and how the performance and overcrowding would affect the overall cost structure. In addition, the No Action Alternative assumes existing Intercity fare policy. The Preferred Alternative assumes a generalized fare structure for the representative Service Plan developed to maximize ridership and to cover costs, but not to optimize revenues. Further analysis as to the range of possible revenues and costs and the best balance of service and pricing policy is needed and could be considered in subsequent analyses.
Table S-3 summarizes the factors and metrics the FRA used to evaluate the similarities and differences between the No Action Alternative and Preferred Alternative. Metrics such as service frequency, capacity, and annual passenger trips would increase as the level of investment and service improvements increase, demonstrating the range of possibilities for the role of rail in the Study Area. Table S-3 illustrates the overall potential for improved mobility and economic growth. Metrics that capture changes in service frequency and travel times demonstrate how the Preferred Alternative would change travel from a local perspective. Both the end-to-end and local (sub-region or city-pair) perspectives are important in considering the benefits and costs of the No Action Alternative and Preferred Alternative.
Chapter 10, Phasing Implementation, provides information on phasing and implementation of an NEC FUTURE investment program to be selected by the FRA in the ROD. The system-wide benefits of the Selected Alternative will only be realized with implementation of numerous interrelated projects. The scope, complexity, and interrelatedness of these projects will require thoughtful and well-coordinated planning over time. While individual projects can address specific chokepoints or other localized needs; it will take groups of projects stretching across the NEC to generate the desired corridor-wide benefits.
Given the scale of this effort, the FRA identified a set of principles for the incremental implementation of the Preferred Alternative vision. These principles are intended to guide further coordination and collaboration with the stakeholder states, Washington, D.C., and railroad operators regarding project phasing and implementation.
Chapter 10 of the Tier 1 Draft EIS (Volume 2) presented a representative initial phase of projects that would be implemented with any of the three Action Alternatives.11 Public and stakeholder comments on this chapter and more generally on implementation phasing emphasized the importance of achieving near-term improvements through incremental phases and the need for a list of projects to be included in an initial phase of the NEC FUTURE investment program.
The FRA has not defined an initial phase for the Preferred Alternative described in this Tier 1 Final EIS, nor does the FRA intend to define an initial phase in the ROD for the Selected Alternative. The FRA will work collaboratively with the NEC states, railroad stakeholders, and the Federal Transit Administration to develop a list of projects to be implemented in an initial phase of the Selected Alternative (Initial Phase). Participation by these key stakeholders in defining an Initial Phase is critical to establishing a framework for working together to achieve common goals. The chapter describes the FRA's proposed approach to working with stakeholders to define an Initial Phase as well as the FRA's proposed approach to carrying out subsequent Tier 2 project studies or other planning processes necessary to implement the Initial Phase.
| Project Needs Addressed | Metrics for Evaluating | No Action Alternative | Preferred Alternative |
|---|---|---|---|
| Aging Infrastructure | NEC in a state of good repair | NO | YES |
| Capacity | Peak rail capacity utilization (number of trains, peak hour, peak direction) | Washington, D.C.: 6 Hudson River: 24 Boston: 11 |
Washington, D.C.: 20 Hudson River: 52 Boston: 18 |
| Peak trains per hour (Intercity trains at Hudson River Screenline) | * | 3X the No Action | |
| Peak passenger capacity utilization (# of passengers, peak hour, peak direction) | Washington, D.C.: 6,610 Hudson River: 30,374 Boston: 8,236 |
Washington, D.C.: 11,173 Hudson River: 44,993 Boston: 12,718 |
|
| Annual passenger Trips (1,000s of trips) | 439,300 | 542,900 | |
| Intercity | 19,500 | 40,200 | |
| Regional Rail | 419,800 | 502,800 | |
| Annual passenger miles (in 1,000s) | 14,338,900 | 20,608,700 | |
| Intercity | 3,074,500 | 6,966,800 | |
| Regional Rail | 11,264,400 | 13,641,900 | |
| Change in annual Intercity VMT (in millions) | * | -3,000 | |
| % Intercity trips diverted to rail (% of trips on the NEC diverted from other modes) | * | 49% | |
| % Regional trips diverted to rail (% of trips on the NEC diverted from other modes) | * | 17% |
* No Action Alternative values are not applicable. The values shown for the Action Alternatives and Preferred Alternative reflect the absolute or percentage change when compared to the No Action Alternative.
| Project Needs Addressed | Metrics for evaluating | No Action Alternative | Preferred Alternative |
|---|---|---|---|
| Connectivity1 | Daily trains serving airport stations1 (total number of trains) | BWI: 143 PHL: 72 EWR: 153 T.F. Green: 10 |
BWI: 350 PHL: 332 EWR: 378 T.F. Green: 154 |
| Air-to-rail diversions (annual one-way trips in 1,000s) | * | WAS-NJ/NY: 160 NJ/NY-BOS: 180 PHL-BOS: 30 |
|
| Daily Intercity service (one way) - number of trains for key city-pairs and key stations | WAS-NYC: 38 NYC-BOS: 19 |
WAS-NYC: 136 NYC-BOS: 94 |
|
| Daily Intercity service- number of trains to connecting corridors | Richmond-NYC: 9 Harrisburg-NYC: 14 Albany-NYC: 12 Springfield-NYC: 2 |
Richmond-NYC: 14 2 Harrisburg-NYC: 24 Albany-NYC: 22 Springfield-NYC: 35 |
|
| Number of Stops by Station (daily) | |||
| Intercity service | Odenton: * | Odenton: 116 | |
| PHL Airport: * | PHL Airport: 116 | ||
| Secaucus: * | Secaucus: 140 | ||
| Providence: 38 | Providence: 177 | ||
| Regional rail service | Odenton: 59 | Odenton: 122 | |
| PHL Airport: 72 | PHL Airport: 216 | ||
| Secaucus: 367 | Secaucus: 782 | ||
| Providence: 36 | Providence: 94 | ||
| Total (Intercity + Regional rail service) | Odenton: 59 | Odenton: 238 | |
| PHL Airport: 72 | PHL Airport: 332 | ||
| Secaucus: 367 | Secaucus: 922 | ||
| Providence: 74 | Providence: 271 |
1 Philadelphia International Airport is
served today by Regional rail service located off the existing NEC.
T.F. Green Airport is served by Regional rail service today; Intercity
Rail service to these airports is included in the Preferred Alternative
service plan.
2 For service planning purposes, three long
distance trains continuing south of Washington, D.C., were considered
to allow sufficient capacity to accommodate these services. These trains
were not explicitly considered in ridership forecasting.
* No Action
Alternative values are not applicable. The values shown for the Action
Alternatives and Preferred Alternative reflect the net change when compared
to the No Action Alternative.
| Project Needs Addressed | Metrics for evaluating | No Action Alternative | Preferred Alternative |
|---|---|---|---|
| Performance | Approximate Travel-time savings (minutes) for key city-pairs (Intercity-Express times in min saved relative to No Action Alternative) | * | WAS-NYC: 30 NYC-BOS: 45 |
| Best station-to-station travel times 1 (hours:minutes) - Intercity-Corridor 2 | WAS-PHL: 1:35 PHL-ODN: N/A PHL-NHV: 2:50 |
WAS-PHL 1:20 PHL-ODN 1:20 PHL-NHV 2:10 |
|
| Top speed by segment | WAS-NYC: 160 NYC-BOS: 150 |
WAS-NYC: 160 NYC-BOS: 160 |
|
| Resiliency | % At-risk construction type (trench and at-grade): End to end - complete area | 62% | 53% |
| % At-risk construction type (trench and at-grade): End to end - within areas susceptible SLR, SS, RF3 | 12% | 10% | |
| Environmental Sustainability | Change in greenhouse gas and criteria pollutants (tons/year) - Existing Energy Profile | ||
| CO2e | * | -713,840 | |
| CO | * | -6,040 | |
| VOC | * | -75 | |
| NOx | * | -225 | |
| PM10 | * | -75 | |
| PM2.5 | * | -25 | |
| SO2 | * | 370 | |
| Change in energy use (MMBtu) | -9,375,030 | ||
| Roadways | * | -11,688,940 | |
| Diesel trains | * | 28,455 | |
| Electric trains | * | 2,285,455 |
1 Travel times are rounded to the nearest
five minutes
2 Stations identified by Amtrak station code
except for Odenton, MD (ODN). See Chapter 4, Table 4-9 for Amtrak station
codes.
3 Sea Level Rise (SLR), Storm Surge Flooding (SSF),
Riverine Flooding (RF)
* No Action Alternative values
are not applicable. The values shown for the Action Alternatives and
Preferred Alternative reflect the net change when compared to the No
Action Alternative change when compared to the No Action
Alternative.
| Project Needs Addressed | Metrics for evaluating | No Action Alternative | Preferred Alternative |
|---|---|---|---|
| Economic Growth | Employment impacts (Number of job-years) | 297,950 | 1,408,840 |
| Construction employment effects | 295,650 | 1,385,340 | |
| Rail operations employment effects | 2,300 | 23,500 | |
| Annual travel market savings ($ millions) | |||
| Total Intercity Travel-Time Savings | * | $942 | |
| Total Emissions Savings | * | $54 | |
| Total Safety Benefits for VMT Diverted to Passenger Rail | * | $1,283 | |
| Jobs accessible in a 45-minute train-travel time | WAS: 1,670,000 NYP: 3,410,000 BOS: 910,000 |
WAS: 1,830,000 NYP: 4,860,000 BOS: 960,000 |
|
| Environmental Impacts | Land Cover - Potential Conversion - Developed (acres) | 7,280 | 9,855 |
| Land Cover - Potential Conversion - Undeveloped (acres) | 1,800 | 2,710 | |
| Total Population (Affected Environment)1 | 4.9 million | 5.0 million | |
| Environmental Justice Populations (Number of EJ Tracts) | 731 | 744 | |
| Section 4(f)/parks (Acres) | 475 | 675 | |
| Section 6(f) (Acres) | 55 | 110 | |
| National Register of Historic Properties2 (number) | 51 | 142 | |
| Cost | Total capital costs ($B 2014) | $20 | $123-$128 |
| Total Intercity Operating Costs ($M 2014) | $890 | $1,980 |
Source: NEC FUTURE team, 2016
Note:
The No Action Alternative includes the NEC and the Hartford/Springfield
Line. The FRA did develop a representational footprint for both the
Existing NEC and Existing Hartford/Springfield Line (Existing NEC +
Hartford/Springfield Line), and used that to understand resources that
could be physically affected by the projects that will be implemented
under the No Action Alternative.
1 The total population
of the No Action Alternative for the Tier 1 Final EIS was updated to
include the Affected Environment of the Hartford/Springfield Line. As
a result, the population of the No Action Alternative is greater than
the population provided in the Tier 1 Draft EIS. The population was
4.4 million in the Tier 1 DEIS. See Chapter 7 for additional information.
2 The FRA also considered National Register-eligible (NRE)
rail-related properties in the NEC as designated by the National Park
Service in prior environmental studies. The NRE properties identified
are included in the total count for National Register of Historic Properties.
* No Action Alternative values are not applicable. The values
shown for the Action Alternatives and Preferred Alternative reflect
the net change when compared to the No Action Alternative
Notice of the availability of the Tier 1 Final EIS has been distributed to various stakeholders, resource and regulatory agencies, Signatories to the Section 106 Programmatic Agreement and those that commented on the Tier 1 Draft EIS. The FRA will hold a 30-day waiting period, beginning with a Notice of Availability in the Federal Register prior to selecting an alternative in the ROD. The Tier 1 Final EIS is available for download from the website and in hard copy form at major libraries throughout the Study Area, including in all counties through which the existing NEC and Hartford/Springfield Line and Preferred Alternative Representative Routes run.
During this 30-day waiting period the public may comment on the Preferred Alternative and the contents of the Tier 1 Final EIS. However, this is not a formal comment period. The FRA will consider comments received during this time in the ROD.
The ROD will complete the Tier1 environmental review process for NEC FUTURE. The FRA will then prepare an SDP for the Selected Alternative as defined in the ROD. Future decisions by the U.S. Department of Transportation, the NEC states and Washington, D.C., and rail operators will shape the manner in which NECFUTURE will be incrementally implemented over several decades.
1 Regional refers to the regional travel market, and includes trips that start and end within the same metropolitan area (see Chapter 13, Glossary).
2 Interregional refers to the interregional travel market, and includes trips that start and end in different metropolitan areas (see Chapter 13, Glossary).
3 Connecting corridors are those rail corridors that connect directly to a station on the NEC. These include (1) corridor service south of Washington Union Station to markets in Virginia (i.e., Lynchburg, Richmond, Newport News, Norfolk) and North Carolina (i.e., Charlotte); (2) Keystone (connects to Philadelphia 30th Street Station); (3) Empire (to Penn Station New York) and (4) New Haven-Hartford-Springfield Corridor (Hartford/Springfield Line) with connections north and east of Springfield Union Station via the Boston to Montreal and Inland Routes, respectively (see Volume 2, Chapter 13: Glossary).
4 Northeast Corridor Infrastructure and Operations Advisory Commission. (February 2014). State of the Northeast Corridor Region Transportation System. State of the Northeast Corridor Region Transportation System.
5 Amtrak. (2014). NEC Maps & Data: Growing Demand for Rail Services in the Northeast. Retrieved January 2015, from Amtrak, The Northeast Corridor: http://nec.amtrak.com/content/growing-demand-rail-services-northeast
6 Northeast Corridor Infrastructure and Operations Advisory Commission. (February 2014). State of the Northeast Corridor Region Transportation System. State of the Northeast Corridor Region Transportation System.
7 State of good repair is a condition in which assets are fit for the purpose for which they were intended. American Public Transportation Association. (2013). Defining a Transit Asset Management Framework to Achieve a State of Good Repair. Washington, D.C.: American Public Transportation Association.
8 Operating practices include the specification of service levels, stopping patterns, dwell times, and equipment types.
9 Assumes fastest Intercity-Express travel times operating non-stop between Philadelphia and Washington, D.C. Intercity-Express travel times making intermediate stops between these two cities would be about 10 minutes slower.
10 The low allocated contingency rate is based on typical historical project values. The high allocated contingency is 50percent greater than the low allocated contingency rates to reflect unknown risk.
11 The Tier 1 Draft EIS referred to this initial phase as the "Universal First Phase." The term "Universal" was used to indicate that the projects included in this first phase were common to all three Action Alternatives.
The information posted on this website includes hypertext links or pointers to information created and maintained by other public and/or private organizations. The FRA provides these links and pointers solely for information and convenience. When users select a link to an outside website, they are leaving the NEC FUTURE website and are subject to the privacy and security policies of the owners/sponsors of the outside website. The FRA does not control or guarantee the accuracy, relevance, timeliness or completeness of information contained on a linked website, or endorse the organizations sponsoring linked websites, the views they express, or the products/services they offer. The FRA cannot authorize the use of copyrighted materials contained in linked websites and is not responsible for transmissions users receive from linked websites.