This chapter describes the No Action and Action Alternatives considered in this Tier 1 Draft Environmental Impact Statement (Tier 1 Draft EIS). The Federal Railroad Administration (FRA) developed these alternatives through a comprehensive and collaborative alternatives development process to consider a broad array of distinct alternatives that address the program's Purpose and Need. This chapter summarizes that alternatives development process and presents the Action Alternatives assessed in the remainder of this Tier 1 Draft EIS. (Appendix B provides further details and supporting documentation related to this chapter.)
The assumptions made herein at the Tier 1 level are representative and illustrative to support analysis in both the alternatives development process and the Tier 1 Draft EIS. The service and infrastructure assumptions are not intended to be prescriptive.
The FRA has defined the No Action and Action Alternatives to a level of detail consistent with a programmatic EIS and sufficient to evaluate benefits and effects to both the built and natural environments. Characteristics for the No Action and Action Alternatives described in this Tier 1 Draft EIS include markets or cities served, service types, infrastructure improvements and routing, and costs. For each Action Alternative, the FRA defined the markets or city-pairs and representative routings linking those markets, but not specific alignments. This allows the FRA to better understand the regional benefits or impacts resulting from the proposed construction of required infrastructure, as well as the implementation of service. To facilitate the environmental assessment of the Action Alternatives, this chapter provides the physical description of the No Action and Action Alternatives from south to north by state and metropolitan area. This chapter presents some features of each Action Alternative-such as service characteristics, capital costs, and operations and maintenance (O&M) costs-corridor-wide rather than by geographic location. This chapter does not present the ways in which the No Action and Action Alternatives address the Purpose and Need (as described in Chapter 3); subsequent chapters (see Chapter 5, 6, and 7) provide more detail on the transportation, economic, and environmental benefits and effects.
A cornerstone for the alternatives development process was open and transparent engagement with a wide range of stakeholders, from rail passengers, agencies, and service operators on the NEC to the residents, travelers, businesses, and communities potentially affected by the outcomes of NEC FUTURE.
There are many possible futures for the NEC. Some involve significant changes in the way passenger service is provided, while others focus on modifications to the existing system, keeping service much as it is today. Some options focus improvements only on the existing NEC, while others include service to new locations or different types of service. Decisions about the future of the NEC affect a wide range of stakeholders and FRA's alternatives development process included extensive public involvement and agency consultation activities including Scoping, consultation meetings, briefings, workshops, and presentations.
Because of the unique geographic, technical, and institutional complexity of the program, the FRA took an innovative approach to developing the NEC FUTURE alternatives, organizing the process into three steps (Figure 4-1). The three-step process allowed for the preparation of corridor-wide service plans and infrastructure projects, and subsequent testing, refining, and optimizing of different service and geographic markets within the NEC. This process also provided the FRA with an understanding of how discrete elements perform relative to one another so that the strongest "package" of separate service, infrastructure, and route options could be crafted into different alternatives that meet the needs of various markets along the NEC.
Figure 4-1 : Alternatives Development Process
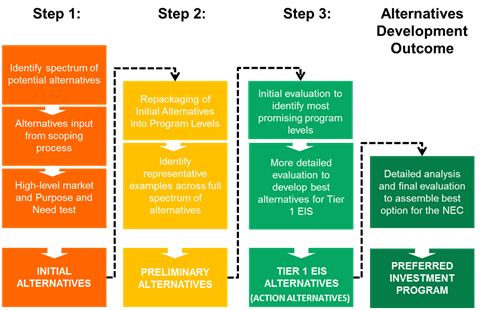
Source: NEC FUTURE team, 2015
In evaluating the alternatives, the FRA used a number of technical tools (as described in Appendix B) to assess engineering feasibility, ridership, operational impacts, capital and operating costs, environmental impacts, and public benefits. The level of technical analysis and associated tools to develop applicable data becomes more detailed as the alternatives advance through the development process. This approach was designed to allow for the refinement and re-packaging of elements of alternatives leading to FRA's identification of the Action Alternatives to be further analyzed and compared to a No Action Alternative.
The FRA defined and developed the Action Alternatives to a programmatic level, to focus on corridor-wide solutions within the Tier 1 Draft EIS. The FRA's approach to the alternatives development process allows for holistic solutions that meet the needs of the entire Study Area to be considered, free from constraints on existing physical assets and those imposed by institutional and jurisdictional operating agreements. These alternatives establish a comprehensive, long-term vision for the corridor's future development and are defined by (1) a range of corridor-wide service options (Service Plans) required to meet varying degrees of projected growth and demand and (2) broad infrastructure needs to accommodate the service. Assumptions made at the Tier 1 level are representative and illustrative, to support analysis in both the alternatives development process and the Tier 1 Draft EIS. These service and infrastructure assumptions are not intended to be prescriptive.
The Action Alternatives provide the FRA and other stakeholders with a range of options and information over the No Action Alternative to determine the appropriate role of rail within the region's future transportation network. While focused on rail solutions (addressing the Purpose and Need), the alternatives have different implications for other transportation modes, including the region's airports, highways, and transit networks. In this way, they provide important information for policymakers to make decisions with this broader transportation system in mind.
Developing a list of "Initial Alternatives" was the first step in the alternatives development process. To develop these alternatives, the FRA began with an analysis of Study Area travel demand and growth data to understand where people are traveling, where growth in population and employment is forecast to occur, and how travel patterns are likely to change in the coming decades. In addition, numerous route and service concepts were identified through input and data collected during Scoping. The FRA organized these ideas into a combination of "building blocks," including how trains will potentially access the markets (network/route), the amount of service to provide to each market (investment level), and the type of service to be provided (service). Mixing and matching these building blocks provided the basis for testing and comparing multiple market, investment, and service options. Table 4-1 describes these three building blocks.
| Building Blocks | Variations |
|---|---|
Network/Route
|
|
Investment Level
|
|
Service
|
|
Source: NEC FUTURE team, 2015
Using these three building blocks, the FRA identified approximately 100 Initial Alternatives to address a broad spectrum of opportunities to upgrade and expand the NEC, serve existing and new markets both on and off the corridor, provide better connectivity to other rail markets, transit, and airports, and develop new high-speed rail service.1 Some of the initial ideas proposed, such as modifying the existing NEC to serve markets off of the existing spine when those markets could be better served through existing and/or future connecting corridors2 did not advance. The FRA also dismissed less efficient routing options, such as New York City to Boston via Albany. Figure 4-2 provides a schematic representation of Initial Alternatives. (Appendix B, Initial Alternatives Report, provides additional documentation on the Initial Alternatives.)
Figure 4-2 : Initial Alternatives
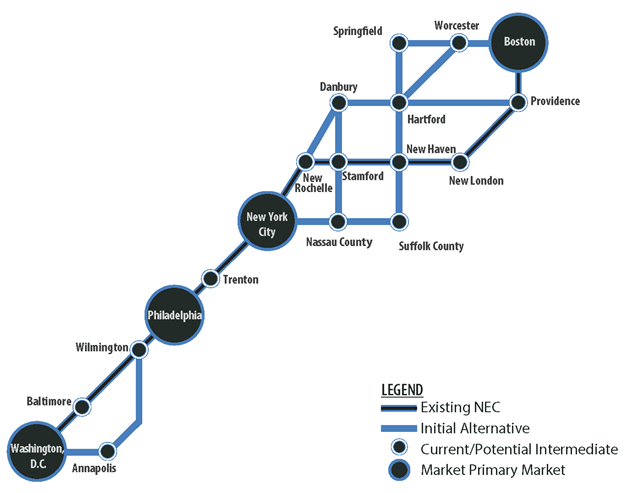
Source: NEC FUTURE team, 2015
In December 2012, the FRA hosted a set of regional workshops.3 These December Dialogues presented the market-based approach underpinning the alternatives development process, the results of Scoping, and the framework used to generate the Initial Alternatives. The feedback from participants at the December Dialogues underscored the importance of providing a range of investment scenarios for the NEC, as well as a flexible approach for the use of additional railroad capacity, allowing operators to respond to changing needs. More information on the December Dialogues is included in Chapter 10, Agency and Public Involvement.
For the next step of the alternatives development process, the FRA organized the Initial Alternatives into four program levels to facilitate a comparison of the benefits and impacts of distinct levels of investment in the NEC. Some Initial Alternatives were not advanced into Preliminary Alternatives, particularly those alternatives that included specific engineering and alignment solutions not germane to a corridor-wide, programmatic planning process.
The four program levels (Table 4-2) differed by the level and types of rail service they provided to the region and supported a broad range of options for the role that passenger rail could play on the NEC and in the Study Area, from upgrading the existing NEC to building a second-spine to support high-speed rail operations for existing and future markets. As program levels increase from A to D, larger investments in service and infrastructure are required.
| Program Level | Alt. | Service Objective | Possible Service Option |
|---|---|---|---|
| A | 1 | Addresses state of good repair and provides some increase in service and capacity along existing NEC | Standard (financially constrained) |
| 2 | Standard | ||
| 3 | Enhanced (mixture of services) | ||
| B | 4 | Substantially increases service to existing and connecting markets along existing NEC with high capacity operations | Standard |
| 5 | Enhanced: Maximum frequency of trains | ||
| 6 | Enhanced: Maximum trip time savings | ||
| 7 | Enhanced: Maximum service to connecting corridors | ||
| C | 8 | Targeted expansion of existing NEC to serve new markets, reduce trip time, and introduce robust Regional rail service | Standard |
| 9 | Enhanced: Maximum frequency of trains | ||
| 10 | Enhanced: Maximum trip time savings | ||
| 11 | Enhanced: Maximum service to connecting corridors | ||
| D | 12 | Achieves world-class high-speed rail potential through the addition of new spine | Second-spine generally parallel to existing NEC |
| 13 | Second-spine via Danbury-Hartford-Providence | ||
| 14 | Second-spine via Ronkonkoma-Hartford-Worcester | ||
| 15 | Second-spine via Delmarva and Nassau County-Stamford-Danbury-Springfield |
Source: NEC FUTURE Appendix B, Preliminary Alternatives Report, April 2013
Within each program level, the FRA developed multiple alternatives to better understand and quantify key market and service dynamics, such as the trade-offs between frequency of service, trip time, and the convenience of one-seat end-to-end service. This allowed the FRA to test and compare different operating scenarios, or, in the case of the second-spine, different route options. In all, the FRA defined 15 Preliminary Alternatives (Table 4-2). Within Program Levels A, B, and C, the FRA developed two different service scenarios for testing and comparison:
Because enhanced service, as defined, encompasses a broad range of potential new service options, the FRA developed separate alternatives in Program Levels B and C to focus on three different enhanced service objectives: maximizing the frequency of trains; providing the fastest express trip time; or maximizing service to connecting corridors. (See Appendix B for additional information.)
In April 2013, the FRA hosted a second set of regional workshops to present the Preliminary Alternatives to the general public. The feedback from participants at the April Dialogues confirmed the importance of preserving a range of program levels in the Tier 1 Draft EIS to reflect different visions for the future of the NEC. Participant feedback also highlighted the importance of evaluating multiple route options. More information on the April Dialogues is included in Chapter 11, Agency and Public Involvement.
In the final step of the alternatives development process, the FRA evaluated the 15 Preliminary Alternatives by comparing them to understand whether and how each met the Purpose and Need (Chapter 3), and analyzing their benefits in terms of ridership, travel time, and service quality. Similarly, among the different Program Level D second-spine route alternatives, the FRA compared performance (in terms of service and ridership) and environmental impacts.
To conduct the analyses of the 15 Preliminary Alternatives, the FRA developed evaluation criteria and associated performance measures derived from the Purpose and Need. This set of evaluation criteria is based on (i) best practices; (ii) results from models used in transportation investment programs of similar physical and programmatic magnitude, (iii) available data; and (iv) stakeholder input. Table 4-3 details the criteria and data used to evaluate the Preliminary Alternatives.
The FRA's key findings during this stage of the alternatives development process were related to 1) defining service dynamics-evaluating passenger preferences for frequency of service, trip time, and one-seat-ride services; and 2) defining the role that rail can play in transporting travelers across the NEC region. (Appendix B, Preliminary Alternatives Evaluation Report, provides additional details on this process.)
| Evaluation Criteria | Metrics |
|---|---|
| Growth and Capacity Expansion |
|
| Aging Infrastructure |
|
| Service Effectiveness and Performance |
|
| Connectivity |
|
| Environmental Consequences |
|
Source: NEC FUTURE team, 2015
* A screenline is an imaginary line used to count rail traffic at a specific location in the Study Area (e.g., the Hudson River, recognizing the capacity restrictions of the tunnels and/or to analyze certain defined types of service/markets).
The FRA used the metrics and data for each criterion (Table 4-3) to compare Program Levels A through D, as well as to compare the separate alternatives within each program level. After evaluating the environmental impacts of the Preliminary Alternatives, the FRA determined that each was likely to result in environmental effects. The FRA dismissed Preliminary Alternative 12 (which represented a second spine parallel to the entire existing NEC from Washington, D.C. to Boston) for service, cost, and constructability reasons. Based on feedback received during the April Dialogues, the FRA dismissed the Delmarva routing in Preliminary Alternative 15, because of public concerns that the route was not viable for a variety of reasons, including the potential for environmental impacts as well as from a growth and market perspective.
The FRA considered three route options for a second spine between New York City and Hartford, CT, and three new off-corridor routes for a second spine from Hartford, CT, to Boston. Based on an evaluation of service, ridership, and capital cost, the FRA narrowed the six route options to four. The Nassau Hub in Uniondale, NY, routing (between New York City and Hartford, CT), and the Springfield, MA, routing (between Hartford, CT and Boston) underperformed when compared to the other route options and were not advanced for further consideration in this Tier 1 Draft EIS. These route options could become part of a longer-term investment program to improve access to markets beyond the NEC or along connecting corridors. (Appendix B, Preliminary Alternatives Evaluation Report and Tier 1 EIS Alternatives Report provide additional information on the route options considered.)
The FRA re-packaged the Preliminary Alternatives into three distinct Action Alternatives that meet the Purpose and Need. Each Action Alternative includes the following:
The FRA also defined a No Action Alternative to establish a baseline for comparative purposes. The No Action Alternative represents a "snapshot in time," developed using current information regarding planning and funding for transportation projects within the Study Area. Refer to Section 4.3 and Appendix B, No Action Alternative Report, for additional information regarding the No Action Alternative.
The FRA compared the Action Alternatives to the No Action Alternative (see Sections 4.3 and 4.4), using ridership and service planning characteristics estimated with models4 created and customized for this effort. Chapters 5, 6, 7, and 8, present transportation effects, economic effects, environmental consequences, and construction effects, respectively, of the Action Alternatives.
Emerging and new technologies may be applicable to rail service on the NEC and other transportation needs across the Study Area. These technologies might include new information systems and services, new train propulsion and guideway systems, fare collection innovations, and safety enhancements. The FRA plays an important role in researching new rail transportation approaches and technologies, as well as demonstrating their specific capabilities and role in the broader multimodal transportation system. For example, the FRA sponsored development of next-generation propulsion systems for locomotives and has explored the potential use of magnetic levitation train technology.5
An advanced guideway system, such as magnetic levitation technology, could be used to develop a second spine or portions thereof. This system would require separate stations, and would not support run-through trains from connecting corridors nor offer proven integration efficiencies with today's NEC infrastructure and operators. Furthermore, these technologies remain under development, with few systems in operation internationally. For these reasons, the FRA did not incorporate advanced guideway or similar new technologies in the Action Alternatives. However, such technologies could be studied separately, and are not precluded as a future transformative investment in the regional transportation system. Other potential applications of new technology transportation systems could support the NEC passenger rail network by connecting off-corridor markets to the NEC, or a major market to the NEC.
There are several ongoing independent rail projects located within the Study Area that are not included in the No Action Alternative. Instead, these projects are referred to as "Related Projects" since they generally fall within one of the following three categories:
These Related Projects, such as the Southeast High Speed Rail Corridor - Washington, D.C., to Richmond, VA, have independent utility and many are currently undergoing their own separate NEPA processes. Other Related Projects, such as Boston South Station expansion, Portal Bridge replacement, and the B&P Tunnel replacement, are intended to address some of the NEC's most pressing reliability, safety, and capacity needs. As such, some of these projects or their components may be included in an Action Alternative.
The FRA has considered these reasonably foreseeable projects in the cumulative impact analysis (Chapter 7.20, Cumulative Effects), and is coordinating with Related Project sponsors to ensure that those projects remain compatible with, and do not preclude, the future design and construction of the NEC FUTURE No Action and Action Alternatives.
While NEC FUTURE uses 2040 as a horizon year for planning purposes, the Action Alternatives could take decades to fully implement. While considering a long-term vision, therefore, the immediate needs of the NEC in the near-term will need to be addressed in a manner consistent with that longer-term vision. In defining Action Alternatives, the FRA considered the importance of incremental implementation in phases, by multiple stakeholders, over many years, with specific timing dictated in part by availability of funding, local needs, and construction considerations. Therefore, the FRA designed each Action Alternative to be incrementally implemented. (Chapter 10, Phasing and Implementation, describes specific priorities for advancing projects.)
Challenges to project implementation, particularly in areas with known constraints, will be addressed during subsequent project-specific analyses.
At this point in the planning process, and given the significant backlog of need identified for the NEC, some near-term improvements would apply to all of the Action Alternatives. These improvements, known as the Universal First Phase, are a collection of projects that would support enhancements to service and address critical infrastructure improvements for further advancing whichever Action Alternative is recommended as the Preferred Alternative. These projects would not affect the outcome of the subsequent decisions about a Preferred Alternative. (Chapter 10, Phasing and Implementation, discusses additional information regarding the Universal First Phase.)
Beyond this initial set of improvements, decisions about priorities and phasing would vary depending on the Action Alternative and future vision. Public and stakeholder feedback on both near-term priorities and the longer-term vision are therefore key inputs to the FRA's decision-making process. A key element of the NEC FUTURE planning process is to ensure improvements to the NEC are prioritized, integrated, and packaged for optimal service benefits across the entire rail network.
Aging infrastructure, insufficient capacity, and gaps in connectivity with other transportation modes and between different rail services limit the current passenger rail network, resulting in congestion and delays on the NEC. The Action Alternatives address these needs, improving service to existing markets and providing service to new markets. The Action Alternatives represent a broad range of options and the FRA developed them with sufficient information to evaluate and make reliable, long-term decisions about the appropriate role of rail in the multimodal transportation system.
The FRA developed Action Alternatives to understand and quantify key rail market and service dynamics, such as the trade-offs between frequency of service, travel time, fares, and the convenience of one-seat service between markets. Action Alternatives are defined by markets, service and station types and infrastructure. Each Action Alternative represents a unique long-term vision for improving passenger rail service that will enhance mobility options, improve performance, and better serve existing and new markets to support future population and employment growth in the Study Area. Although the visions are unique, each Action Alternative shares the following attributes:
The focus of the Action Alternatives is passenger rail. However, the Action Alternatives would have different effects on the multimodal transportation system (air, highway, intercity bus, transit, and rail). The FRA evaluated the potential effects of the Action Alternatives on other modes, particularly if travelers are attracted to passenger rail from congested highways and airports, in Chapter 5, Transportation Effects, and Chapter 6, Economic Effects and Growth, and Indirect Effects. While focused on passenger rail, the FRA considered the overall effects on travel across the entire transportation system in evaluating the benefits and effects of each Action Alternative. Chapter 9, Evaluation of Alternatives, also presents these broader system-wide effects.
The FRA's market-based approach incorporated analysis of current travel demand, population growth projections, ridership projections, data from states and planning organizations, and public and agency comments.
For the NEC FUTURE alternatives development process, the FRA took a market-based approach, first identifying current travel patterns and how they have changed over the past three to four decades, and then identifying potential new rail markets. The FRA identified four primary markets-Washington, D.C., Philadelphia, New York City, and Boston-based on analysis of current travel demand and population growth projections, ridership projections, data from states and planning organizations, and public and agency comment during Scoping and other interactions. The data also show that there are other important rail markets within the Study Area, including smaller intermediate cities or urban and suburban areas. Some of these markets are located directly on the NEC, such as Baltimore, MD, Wilmington, DE, and New Haven, CT. Others markets are located away from the NEC, such as Hartford, CT, Ronkonkoma, NY, and Worcester, MA.7
The interregional travel market includes trips that start and end in different metropolitan areas (e.g., beginning in Philadelphia and ending in Boston). A significant number of interregional trips include travel from intermediate cities to a primary metropolitan area, or between two intermediate cities (e.g., beginning in Wilmington, DE, and ending in Stamford, CT). Interregional trips today are primarily served by Amtrak, the NEC's Intercity rail operator. Regional travel includes trips within a metropolitan area, such as journey-to-work trips (e.g., Canton, MA, to Boston). These trips are primarily served by commuter or Regional rail operators (e.g., Massachusetts Bay Transportation Authority).
For regional travel, demand exceeds capacity during peak periods in some locations, affecting system performance and often leading to delays and queuing at major stations or terminals and standing-room-only conditions on trains in certain areas of the existing NEC. For some regional markets such as northern New Jersey/New York, peak-period capacity constraints combined with growth in travel demand result in higher volumes of travel for extended periods of time. As demand for Regional rail services grows beyond the peak periods, railroads are left with only small windows of time within which to accomplish maintenance activities, or they become limited in their ability to respond to unforeseen events without service disruptions.
The term "Intercity" is defined as passenger rail service between metropolitan areas. The term "interregional" describes travel flows that start and end in a different metropolitan area. "Interregional" and "Intercity" may be used interchangeably when referring to markets, passengers, trips, and passenger rail service.
"Regional" describes travel within a metropolitan area. "Regional rail" is defined as passenger rail service within the travel shed of a metropolitan area. "Regional rail" provides local and commuter-focused service characterized by a high-percentage of regular travelers. Regional rail is a broad term that reflects the expanded role of commuter railroads to also serve metropolitan travel needs throughout the day and beyond the work week.
For NEC FUTURE, the FRA categorized passenger rail service into two types-Intercity and Regional. Intercity is passenger rail service between cities or metropolitan areas, operating at speeds and distances greater than that of Regional or commuter rail. Intercity serves large, midsize, and selected smaller markets, with station stops typically every 10 to 25 miles. Regional rail serves local markets, often within one metropolitan area, with station stops typically every 2 to 10 miles. Details on each of these passenger rail service types are outlined below:
Representative service plans for each Action Alternative are based on information and data gathered by the FRA or provided by rail operators along the NEC. The FRA developed the service plans to permit the comparison of alternatives and are not intended to be prescriptive.
To fully understand the dynamic operating environment in which passenger rail service on the NEC functions, the FRA explored the potential benefits of enhanced service concepts, aimed at increasing the efficiency of operations since the Action Alternatives would eliminate chokepoints and expand capacity. Enhanced services make efficient use of new rail infrastructure investments by enhancing the attractiveness and convenience of train services, increasing the efficiency of operations, and lowering the cost per capita of delivering rail service.
The Action Alternatives also incorporate the following representative operational improvements to better integrate train service across today's separate markets:
Appendix B, Tier 1 EIS Alternatives Report, provides more information on enhanced service concepts used in the Action Alternatives.
Transit-style Regional rail makes more intensive use of existing track capacity to significantly reduce the need for additional rail infrastructure, offering a simpler array of service patterns, dedicated to and optimized for each main track in the right-of-way. Transit-style service exists or has been operated in the past on various rail transit lines, notably in Chicago, New York City, and Philadelphia.
Representative service plans developed for the Action Alternatives11 incorporated various elements of the above service concepts and operating efficiencies. For example, the FRA evaluated an enhanced service concept to maximize benefits to targeted markets and minimize investment in infrastructure, referred to as transit-style service as an alternative to zone express service in areas of heavy demand. This concept is illustrative of the range of possible service concepts that could be operated with varying benefits to targeted markets. (Refer to Appendix B, Service Plans and Train Equipment Options Technical Memorandum, for additional information on transit-style services.)
Representational service plans evaluated for each Action Alternative also incorporated assumptions about fare policy, shared track use, rolling stock, and availability of connecting transit services. These assumptions are discussed below.
Fare Policy
The FRA derived Intercity rail pricing fares from existing Amtrak fare policy to estimate ridership and revenues but not as a fare-maximizing or ridership-maximizing analysis. The FRA considered changes to the existing Amtrak fare policy to understand the price-sensitivity of passengers, but established a threshold for analysis requiring that Intercity revenues cover operating expenses.
The FRA tested a range of fare discounts to establish a point in which revenues covered operating expenses. This analysis determined that a 30-percent discount from current fares on non-express services would attract additional riders and still cover operating expenses. The FRA used this fare policy assumption to estimate ridership, revenues, and O&M costs.
O&M costs and revenue estimates related to Regional rail operations depend more on localized choices and are less likely to be informative in the NEC FUTURE decision-making process. They are not included in this estimate. (Appendix B, Ridership Analysis Technical Memorandum, provides additional information on ridership and rail pricing fares.)
Shared Access and Consideration of Freight
The NEC FUTURE Scoping process, along with input received from freight rail operators and state and regional stakeholders, identified the preservation and enhancement of freight rail as an important concern, and the identification of opportunities to facilitate improved freight rail service as an important objective of NEC FUTURE.
In all Action Alternatives, the FRA assumes that the existing NEC would continue to operate as a shared-use corridor. Each Action Alternative preserves freight access and operations on the NEC and does not preclude future expansion opportunities. The FRA developed specific assumptions for the mixed operations of freight and passenger traffic on the same tracks and in the same right-of-way, consistent with the current FRA regulatory framework:
The FRA also considered opportunities to accommodate future growth and improvement of freight rail service within the Study Area when defining infrastructure requirements for passenger services. Additional infrastructure associated with the Action Alternatives could provide additional capacity to accommodate an increase in freight traffic at select locations.
In addition to preserving freight rail access to industries along the NEC and not precluding future expansion of freight rail service, the FRA reviewed the Action Alternatives with respect to their potential effects on four specific freight traffic growth opportunities:
Rolling Stock
The service plans for the Action Alternatives assume the use of high-performance trainsets, which is consistent with the projected pace of rolling stock technology development and which utilize rail infrastructure more efficiently by minimizing the variations in train performance (e.g., top speed, acceleration and braking rates). Table 4-4 identifies the various types and configurations of rolling stock.
| Rolling Stock | Tier | Locomotive Type/ Traction Power Type | Train Length (Locomotives + Coaches, ft) [2] | Seats/ Car | Off-Corridor Ops | Max. Speed on NEC (mph) |
|---|---|---|---|---|---|---|
| Intercity-Express High-Performance Trainset | III | Concentrated or distributed power w/Catenary | 595-1,190 | 50-60 | No | 220 |
| Intercity-Corridor Trainset | III | Concentrated or distributed power w/Catenary | 595-1,190 | 60-70 | No | 220 |
| III | Dual Power/Cat. + 3rd Rail | 1,020 | 60-70 | Yes | 160-220[3] | |
| III | High-Performance Dual Mode[3] | 1,020 | 60-70 | Yes | 160-220 | |
| III | Dual Mode/3rd Rail + Diesel | 1,020 | 60-70 | Yes | 160-220 | |
| Intercity-Corridor Train | I | High-Performance Dual Mode[3] | 1,000 | 60-70 | Yes | 125 |
| I | Diesel locomotive | 1,170 | 60-70 | Yes | 110 | |
| I | Electric locomotive/Catenary | 1,170 | 60-70 | Yes | 125 | |
| Regional rail Electric Multiple-Unit (EMU) [4] | I | EMU/Catenary or 3rd Rail | 1,020 | 105 | Yes | 100-125 |
| I | EMU/Catenary or 3rd Rail | 1,020 | 135 | Yes | 100-125 | |
| Regional rail Push-Pull, Single level or Bi-level[4] |
Electric, Diesel or Dual-Mode locomotive | 1,000 | 135 | Yes | 125/100 | |
| I | Electric, Diesel or Dual-Mode locomotive | 755 | 135 | Yes | 125/100 | |
| Intercity Long-Distance Train | I | Same locomotive options as Intercity-Corridor trains | 1,170 | n.a. | Yes | 125 |
Source: NEC FUTURE team, 2015
[1] Measured in equivalent 85-foot car lengths. Also can be operated in smaller consists as warranted by demand. High-performance equipment assumed to comprise one or two intact trainset modules.
[2] Based on 85-foot-long passenger cars and 75-foot-long locomotives, or the equivalent length of intact trainset modules.
[3] There is currently no high-performance trainset 220 mph-capable that has both overhead electrification and third-rail equipment. Also of note, this trainset would need to be compatible with the three types of AC power present on the existing NEC.
[4] Includes through-running services, assuming compatibility with traction power system (if any) on all lines served.
However, NEC FUTURE is not prescriptive with respect to the use of particular equipment types, and the Action Alternatives are flexible with respect to the mix of equipment that could be operated. In light of the individual fleet standards and requirements for the Regional rail operators, rolling stock assumptions for Action Alternatives are not prescriptive for Regional rail. The FRA considered, particularly in Alternative 1, the continued use of diesel-hauled trains for some Regional services as an alternative to converting to all-electric operations. It should be noted that there are consequences associated with decisions to utilize rolling stock with greater variability in performance. Consequences include reduced scheduling flexibility (i.e., the need to schedule around other trains in locations where tracks are shared), reduction in the number of train frequencies, particularly in the standard peak hour, and needs for additional infrastructure for trains with different operating characteristics to pass or overtake one another while en route. (Appendix B, Service Plans and Train Equipment Options Technical Memorandum, contains additional information regarding rolling stock assumptions.)
The FRA considered existing transit and passenger rail services at passenger rail stations in defining the Action Alternatives, particularly since they contribute to the attractiveness and connectivity of the passenger rail network with the overall transportation system. While the Action Alternatives do consider the range of available public transit services-local and intercity bus, light rail and urban rail transit, and passenger rail-at individual stations, resulting increases in service demands for these connecting transit services were not evaluated in this Tier 1 Draft EIS. However, the FRA generally considered improved connectivity at stations in the assessment of benefits and consequences of each Action Alternative. Chapter 5, Transportation Effects, and Chapter 6, Economic Effects and Growth, and Indirect Effects, discuss the range of possible effects on existing transit services. Of particular note are the indirect effects on Regional rail operator's branch lines and network of services beyond those on the NEC. These and related requirements for additional improvements to existing or planned connecting transit services would be considered in subsequent project-level assessments. Similarly, the improvements proposed with Action Alternatives extend to related projects (defined in Section 4.1.3.1), which provide connecting transit services and thereby expand the reach of the Action Alternatives.
Several NEC connecting corridors13 extend the passenger rail network to markets throughout the Northeast and to points in the mid-Atlantic and New England. NEC connecting corridors include the following:
South of Washington, D.C.
Connecting corridors south of Washington, D.C. provide intercity service to markets in Virginia (e.g., Lynchburg, Richmond, Newport News, Norfolk), North Carolina (e.g., Raleigh, Charlotte) and points south such as Atlanta, GA and Jacksonville, FL. Regional rail service operates between Fredericksburg, VA and Washington, D.C.; and between Bristow, VA and Washington, D.C. The connecting corridors south of Washington, D.C., are owned by CSX Transportation or Norfolk Southern.
The Southeast High Speed Rail (SEHSR) program is a series of improvement projects that would improve passenger rail service between Washington, D.C., south through Richmond, VA; Raleigh and Charlotte in North Carolina and as far south as Florida. The SEHSR network connects to the existing NEC and all Action Alternatives at Washington Union Station.
Multiple segments of the SEHSR network are going through the planning and environmental review process. The FRA also signed a Record of Decision on the segment between Richmond, VA and Hampton Roads, VA, in 2012. The Departments of Transportation for North Carolina and Virginia prepared a Tier 2 EIS for the segment between Petersburg, VA, and Raleigh, NC. The FRA signed the Final EIS in September 2015. The Virginia Department of Rail and Public Transportation (DRPT) is preparing a Tier 2 Draft EIS for the segment between Richmond, VA, and Washington, D.C., referred to as DC2RVA14. A Tier 2 Record of Decision is expected in 2017.
Keystone Corridor
Pennsylvania's Keystone Corridor connects Pittsburgh and Harrisburg, PA, to Philadelphia. Amtrak owns the Keystone Corridor between Harrisburg, PA, and Philadelphia. Norfolk Southern owns the corridor between Pittsburgh, PA, and Harrisburg, PA. Intercity service operates along the entire length of the corridor; with more frequent service between Harrisburg, PA, and Philadelphia 30th Station, with continuing service to New York City. Regional rail service operates between Thorndale, PA, and 30th Street Station, through to Center City Philadelphia. The Keystone Corridor Intercity service connects to the existing NEC at Philadelphia 30th Street Station.
Since 2000, over $400 million in infrastructure improvements have been made on the segment between Harrisburg, PA, and Philadelphia, resulting in more frequent service, reduced travel times and higher operating speeds15 along the corridor. The Pennsylvania Department of Transportation (Penn DOT) and the FRA studied options to reduce passenger rail travel times and increase trip frequency-without hindering the important freight service that runs on the same tracks-between Pittsburgh, PA and Harrisburg, PA. The study was completed in 2014.
Empire Corridor
The Empire Corridor connects Niagara Falls, and Albany, NY to New York City. Ownership of the corridor is shared between Amtrak, Metro-North Railroad, and CSX Transportation. Amtrak owns the territory between Penn Station New York and Bronx, NY. Metro-North Railroad owns the tracks between Bronx, NY, and Poughkeepsie, NY. CSX Transportation owns the territory between Poughkeepsie, NY, and Niagara Falls, NY.
Intercity service operates along the entire length of the corridor, providing service from New York City to markets in the Hudson River Valley and western New York. Regional rail service operates from New York City north to Poughkeepsie, however, service terminates at Grand Central Terminal in New York City, not Penn Station New York, which is the terminal for Intercity services. The Empire Corridor Intercity service connects to the existing NEC at Penn Station New York.
The FRA and the New York State Department of Transportation completed a draft Tier 1 EIS to evaluate proposed system improvements between Penn Station New York and Niagara Falls Station. A Public Comment period, which included public hearings, was held in 2014.16
New Haven-Hartford-Springfield Corridor
It is estimated that NHHS Rail Program improvements will result in 1.26 million new annual trips and divert 1.15 million car trips to rail by 2030.
The Amtrak-owned New Haven-Hartford-Springfield Corridor connects Springfield, MA, and Hartford, CT, to New Haven, CT. Intercity service operates between along the entire length of the corridor between Springfield, MA, and New Haven, CT; with some continuing service operating to New York City and Washington, D.C.; and north to St. Alban's, VT. Regional rail service currently does not operate on the corridor. The New Haven-Hartford-Springfield Corridor connects to the existing NEC at New Haven Station.
The New Haven-Hartford-Springfield (NHHS) Program,17 sponsored by the State of Connecticut, would add Regional rail service and improve Regional and Intercity service between Connecticut and western Massachusetts. With the No Action Alternative and Alternative 1 this connecting service would provide improved access to the NEC at New Haven. The new service is expected in be implemented in late 2016.
The Northern New England Intercity Rail Initiative (NNEIRI)18 is examining opportunities for more frequent and/or higher speed intercity passenger rail service on two major rail corridors that connect New Haven, CT, Springfield, MA, and Boston; and Springfield, MA, to Montreal, Canada, through northern Massachusetts and Vermont. NNEIRI would create connections in Springfield, MA, to the south and the west-south via the planned New Haven Hartford Springfield (NHHS) connecting corridor services; and east to Boston via the Inland Route.
In Alternatives 2 and 3 (which provide direct service to Hartford, CT), the opportunity exists for improved Intercity service connections with in Harford to/from Massachusetts (Springfield and the Knowledge Corridor) and Vermont. Additional services on the NHHS as well as the proposed Springfield to Vermont segment of NNEIRI would allow travelers from Massachusetts and Vermont to connect at Hartford for service to Boston along a new NEC Spine proposed in Alternatives 2 and 3. Additionally, Regional rail connections would be possible via Springfield in all Action Alternatives. The additional services on the NHHS connecting corridor and the proposed NNEIRI service to Vermont and points north also provide opportunities for connections to Bradley International Airport, located north of Hartford, CT; and Burlington International Airport in northern Vermont.
Figure 4-3 depicts the Study Area connecting corridors.
Figure 4-3 : Study Area Connecting Corridors
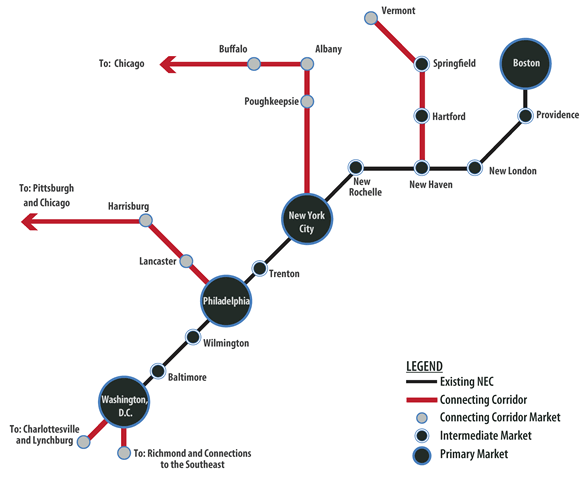
Source: NEC FUTURE team, 2015
The FRA developed a hierarchy of station types, based on market size, quantities of, and types of rail services offered. This typology applies to existing and future stations included in each of the Action Alternatives. (Appendix B, Stations Location and Access Analysis Technical Memorandum, further describes the station types for each alternative.) Stations are grouped into one of the following types:
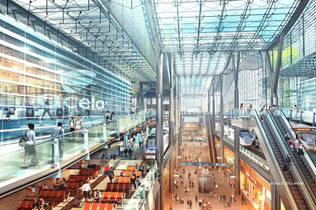
Source: Amtrak
Laying the groundwork for Union Station's second century, the Washington Union Station Master Plan envisions an expanded and modernized multimodal station that can accommodate three times as many passengers and twice as many trains.
The FRA evaluated both services provided at stations as well as physical improvements associated with station tracks, platforms, passenger waiting areas and facilities, access and parking, and ancillary buildings. Each Action Alternative defines the proposed types of service and levels of service for each station. Service type and frequency are the focus of the transportation analysis (see Chapter 5, Transportation Effects), in which the FRA evaluated connectivity, service frequency, travel times, and ridership. The FRA estimated the size of a station area footprint to capture the physical improvements associated with each station type as follows:
The station area footprint takes into consideration the types of service provided as well as adjacent land uses. Local and Major Hub stations (with the exception of Washington, D.C., Philadelphia, New York City, and Boston) have the same size footprint, but for different reasons. Local stations currently provide Regional rail services and would continue to do so. Local stations are usually smaller than those with multiple service types, requiring less space for parking, smaller waiting areas and associated facilities. Major Hub stations are served by both Regional and Intercity rail (both now and in the future), but are often located in urban areas where land availability is constrained and modal access to the station is more diverse, thus requiring a smaller footprint than other multi-service stations such as Hub stations.
Major Hub stations in Washington, D.C., Philadelphia, New York City, and Boston are each undergoing their own expansion plans. The FRA incorporated the assumptions in these expansion plans as inputs into the Action Alternative service plans, to determine whether the capacity needs of each Action Alternative are consistent with their respective expansion plans. (Appendix B, Service Plans and Train Equipment Options Technical Memorandum, contains additional assumptions regarding these Major Hub stations.)
Table 4-5 contains a complete list of stations, their locations, and the Action Alternative(s) in which each station appears. The FRA used the station ID (the third column of Table 4-5) to refer to each station in its assessment of station area Environmental Consequences for applicable resources. The station ID is also a reference for information displayed in Chapter 7.
| Geography | County | Station ID | Station Name | Station Type | Alt 1 | Alt 2 | Alternative 3 | |||
|---|---|---|---|---|---|---|---|---|---|---|
| Alt 3.1 | Alt 3.2 | Alt 3.3 | Alt 3.4 | |||||||
| D.C. | 1 | Washington Union | Existing | X | X | X | X | X | X | |
| MD | Prince George's | 2 | New Carrolton | Existing | X | X | X | X | X | X |
| 3 | Seabrook | X | X | X | X | X | X | |||
| 4 | Bowie State | X | X | X | X | X | X | |||
| Anne Arundel | 5 | Odenton | Existing | X | X | X | X | X | X | |
| 6 | BWI Airport | X | X | X | X | X | X | |||
| 6 | BWI Airport H.S. | New | X | X | X | X | ||||
| Baltimore County | 7 | Halethorpe | Existing | X | X | X | X | X | X | |
| 15 | Martin Airport | X | X | X | X | X | X | |||
| Baltimore City | 8 | West Baltimore | Existing | X | X | X | X | X | X | |
| 9 | Upton | New | X | X | X | X | X | X | ||
| 10 | Baltimore Penn Station | Existing | X | X | X | X | X | X | ||
| 11 | Baltimore Downtown | New | X | X | X | X | ||||
| 12 | Broadway | X | X | X | X | X | X | |||
| 13 | Bayview | X | X | X | X | X | X | |||
| 14 | Bayview H.S. | X | X | X | X | |||||
| Harford | 16 | Edgewood | Existing | X | X | X | X | X | X | |
| 17 | Aberdeen (NEC) | X | X | X | X | X | X | |||
| Cecil | 22 | Perryville | Existing | X | X | X | X | X | X | |
| 23 | Elkton | New | X | X | X | X | X | X | ||
| DE | New Castle | 24 | Newark, DE | Existing | X | X | X | X | X | X |
| 25 | Churchman's Crossing | X | X | X | X | X | X | |||
| 26 | Newport | New | X | X | X | X | X | X | ||
| 27 | Wilmington Station | Existing | X | X | X | X | X | X | ||
| 28 | Edgemoor | New | X | X | X | X | X | X | ||
| 29 | Claymont | Existing | X | X | X | X | X | X | ||
| PA | Delaware | 30 | Marcus Hook | Existing | X | X | X | X | X | X |
| 31 | Highland Avenue | X | X | X | X | X | X | |||
| 32 | Chester | X | X | X | X | X | X | |||
| 33 | Eddystone | X | X | X | X | X | X | |||
| 34 | Baldwin | New | X | X | X | X | X | X | ||
| 35 | Crum Lynne | Existing | X | X | X | X | X | X | ||
| 36 | Ridley Park | X | X | X | X | X | X | |||
| 37 | Prospect Park | X | X | X | X | X | X | |||
| 38 | Norwood | X | X | X | X | X | X | |||
| 39 | Glenolden | X | X | X | X | X | X | |||
| 40 | Folcroft | X | X | X | X | X | X | |||
| 41 | Sharon Hill | X | X | X | X | X | X | |||
| 42 | Curtis Park | X | X | X | X | X | X | |||
| 43 | Darby | X | X | X | X | X | X | |||
| Philadelphia | 44 | Philadelphia Airport* | New | X | X | X | X | X | ||
| 45 | Philadelphia 30th St | Existing | X | X | X | X | X | X | ||
| 46 | Philadelphia Market East | X | X | X | X | |||||
| 47 | North Philadelphia | X | X | X | X | X | X | |||
| 48 | Bridesburg | X | X | X | X | X | X | |||
| 49 | Wissinoming | X | X | X | X | X | X | |||
| 50 | Tacony | X | X | X | X | X | X | |||
| 51 | Holmesburg Junction | X | X | X | X | X | X | |||
| 52 | Torresdale | X | X | X | X | X | X | |||
| Bucks | 53 | Cornwells Heights | Existing | X | X | X | X | X | X | |
| 54 | Eddington | X | X | X | X | X | X | |||
| 55 | Croyton | X | X | X | X | X | X | |||
| 56 | Bristol | X | X | X | X | X | X | |||
| 57 | Levittown | X | X | X | X | X | X | |||
| NJ | Mercer | 58 | Trenton | Existing | X | X | X | X | X | X |
| 60 | Hamilton | X | X | X | X | X | X | |||
| 61 | Princeton Junction | X | X | X | X | X | X | |||
| Middlesex | 62 | North Brunswick | New | X | X | X | X | X | X | |
| 63 | Jersey Avenue | Existing | X | X | X | X | X | X | ||
| 64 | New Brunswick | X | X | X | X | X | X | |||
| 65 | Edison | X | X | X | X | |||||
| 66 | Metuchen | X | X | X | X | X | X | |||
| 67 | Metropark | X | X | X | X | X | X | |||
| 68 | Metropark H.S. | New | X | X | X | X | ||||
| Union | 69 | Rahway | Existing | X | X | X | X | X | X | |
| 70 | Linden | X | X | X | X | X | X | |||
| 71 | Elizabeth | X | X | X | X | X | X | |||
| 72 | North Elizabeth | X | X | X | X | X | X | |||
| Essex | 73 | Newark Airport | Existing | X | X | X | X | X | ||
| 74 | Newark Penn Station | X | X | X | X | X | X | |||
| 75 | Newark Penn Station H.S. | New | X | X | X | X | ||||
| Hudson | 76 | Secaucus | Existing | X | X | X | X | X | X | |
| NY | New York | 77 | Penn Station New York | Existing | X | X | X | X | X | X |
| 9993 | Grand Central Terminal | X | X | |||||||
| Queens | 144 | Jamaica | Existing | X | X | |||||
| 145 | Jamaica H.S. | New | X | X | ||||||
| Bronx | 78 | Hunts Point | New | X | X | X | X | X | X | |
| 79 | Parkchester | X | X | X | X | X | X | |||
| 80 | Morris Park | X | X | X | X | X | X | |||
| 81 | Co-op City | X | X | X | X | X | X | |||
| Westchester | 82 | New Rochelle | Existing | X | X | X | X | X | X | |
| 83 | Larchmont | X | X | X | X | X | X | |||
| 84 | Mamaroneck | X | X | X | X | X | X | |||
| 85 | Harrison | X | X | X | X | X | X | |||
| 86 | Rye | X | X | X | X | X | X | |||
| 87 | Cross-Westchester | New | X | X | X | X | X | X | ||
| 88 | Port Chester | Existing | X | X | X | X | X | X | ||
| 151 | White Plains East | New | X | X | ||||||
| Putnam | 153 | Brewster-Katonah | New | X | X | |||||
| Nassau | 146 | Nassau Hub | New | X | X | |||||
| Suffolk | 148 | Suffolk Hub | New | X | X | |||||
| 149 | Ronkonkoma | Existing | X | X | ||||||
| CT | Fairfield | 89 | Greenwich | Existing | X | X | X | X | X | X |
| 90 | Cos Cob | X | X | X | X | X | X | |||
| 91 | Riverside | X | X | X | X | X | X | |||
| 92 | Old Greenwich | X | X | X | X | X | X | |||
| 93 | Stamford | X | X | X | X | X | X | |||
| 94 | Stamford H.S. | New | X | |||||||
| 95 | Noroton Heights | Existing | X | X | X | X | X | X | ||
| 96 | Darien | X | X | X | X | X | X | |||
| 97 | Rowayton | X | X | X | X | X | X | |||
| 98 | South Norwalk | X | X | X | X | X | X | |||
| 99 | East Norwalk | X | X | X | X | X | X | |||
| 100 | Westport | X | X | X | X | X | X | |||
| 101 | Greens Farms | X | X | X | X | X | X | |||
| 102 | Southport | X | X | X | X | X | X | |||
| 103 | Fairfield | X | X | X | X | X | X | |||
| 104 | Fairfield Metro | X | X | X | X | X | X | |||
| 105 | Bridgeport | X | X | X | X | X | X | |||
| 107 | East Bridgeport | New | X | X | X | X | X | X | ||
| 108 | Stratford | Existing | X | X | X | X | X | X | ||
| 154 | Danbury | New | X | X | ||||||
| New Haven | 109 | Milford | Existing | X | X | X | X | X | X | |
| 110 | West Haven | X | X | X | X | X | X | |||
| 111 | New Haven Station | X | X | X | X | X | X | |||
| 112 | New Haven Station H.S. | New | X | X | X | |||||
| 113 | New Haven State Street | Existing | X | X | X | X | X | X | ||
| 156 | Meriden H.S. | New | X | X | X | |||||
| 114 | Branford | Existing | X | X | X | X | X | X | ||
| 115 | Guilford | X | X | X | X | X | X | |||
| 116 | Madison | X | X | X | X | X | X | |||
| 155 | Waterbury South | New | X | X | ||||||
| Middlesex | 117 | Clinton | Existing | X | X | X | X | X | X | |
| 118 | Westbrook | X | X | X | X | X | X | |||
| 119 | Old Saybrook | X | X | X | X | X | X | |||
| 120 | Old Saybrook H.S. | New | X | |||||||
| New London | 121 | New London | Existing | X | X | X | X | X | X | |
| 124 | Mystic/New London H.S. | New | X | |||||||
| 122 | Mystic | Existing | X | X | X | X | X | X | ||
| Hartford | 160 | West Hartford | New | X | ||||||
| 160 | Berlin | Existing | X | |||||||
| 161 | Newington | New | X | |||||||
| 164 | Hartford (New) | X | X | X | X | X | ||||
| Tolland | 165 | Willimantic/Storrs | New | X | X | X | ||||
| 166 | Tolland/Storrs | X | X | |||||||
| RI | Washington | 123 | Westerly | Existing | X | X | X | X | X | X |
| 125 | Kingston | X | X | X | X | X | X | |||
| 126 | Wickford Junction | X | X | X | X | X | X | |||
| Kent | 127 | T.F. Green | Existing | X | X | X | X | X | X | |
| Providence | 128 | Providence Station | Existing | X | X | X | X | X | X | |
| 129 | Providence Station H.S. | New | X | X | X | X | X | |||
| 130 | Pawtucket | X | X | X | X | X | X | |||
| MA | Bristol | 131 | South Attleboro | Existing | X | X | X | X | X | X |
| 132 | Attleboro | X | X | X | X | X | X | |||
| 133 | Mansfield | X | X | X | X | X | X | |||
| Worcester | 172 | Worcester | Existing | X | X | |||||
| 173 | Grafton-Shrewsbury | New | X | X | ||||||
| 174 | Westborough | X | X | |||||||
| 175 | Blue Star Hwy (I-495) | X | X | |||||||
| Middlesex | 176 | Southborough/Ashland | New | X | X | |||||
| 178 | Framingham | X | X | |||||||
| 181 | Riverside (I-95) | X | X | |||||||
| Suffolk | 182 | Beacon Park | New | X | X | |||||
| Norfolk | 134 | Sharon | Existing | X | X | X | X | X | X | |
| 135 | Canton Junction | X | X | X | X | X | X | |||
| 136 | Rte 128 | X | X | X | X | X | X | |||
| Suffolk | 137 | Readville | Existing | X | X | X | X | X | X | |
| 138 | Hyde Park | X | X | X | X | X | X | |||
| 139 | Forest Hills | X | X | X | X | X | X | |||
| 140 | Ruggles Street | X | X | X | X | X | X | |||
| 141 | Back Bay | X | X | X | X | X | X | |||
| 142 | Back Bay H.S. | New | X | X | X | X | ||||
| 143 | Boston South Station | Existing | X | X | X | X | X | X | ||
Source: NEC FUTURE team, 2015
* The airport is currently served by Regional rail service located off the existing NEC. The Philadelphia International Airport Station identified in the Action Alternatives would be built as part of the NEC FUTURE. The station area is co-located in Delaware County, PA.
H.S. = high speed
Individual infrastructure elements comprise an Action Alternative's path or horizontal location. The FRA developed the geographic extent of each linear element using aerial photography, taking into consideration topography and known areas of environmental sensitivity. These elements describe the proposed physical infrastructure relative to the existing NEC. The four infrastructure elements are:
The term Representative Route is intentionally used to capture the highly conceptual and representative nature of a proposed route for an Action Alternative. At this Tier 1 level, the FRA has not defined specific alignments.
The FRA linked infrastructure elements together to create a two-dimensional Representative Route for the purposes of conducting the environmental review. The term Representative Route is intentionally used to capture the highly conceptual and representative nature of a proposed route for an Action Alternative. At this Tier 1 level, the FRA has not defined specific alignments. The Representative Route provides a basis for programmatic evaluation of the environmental effects of each Action Alternative. Consistent with the overall intended outcome of the Tier 1 EIS, the Representative Route establishes the markets to be served and the "corridor" or "envelope" within which the improvements would occur. It is not the intent of this Tier 1 Draft EIS to select a site-specific alignment.
The Representative Route includes the physical footprint of the improvements associated with the Action Alternatives. The dimensions of the footprint of the Representative Route are based on cross sections identifying construction type (e.g., tunnel, viaduct, bridge, embankment, at-grade) that are applied to topography or land use type, stations supporting facilities, and right-of-way requirements. The footprints associated with the Representative Route range from 150 feet to 300 feet wide. Improvements associated with stations and supporting facilities (e.g., tracks, platforms, parking) could flare out beyond the dimensions of the Representative Route. The width of the Representative Route for an Action Alternative includes the existing NEC and any new segment(s), where applicable. The FRA standardized the width of the existing NEC to 150 feet, conservatively accounting for a four-track right-of-way between Washington, D.C., and Boston.
For some areas of the Representative Route, both the existing NEC and new segments are adjacent to each other. In these cases, where footprint dimensions vary by more than 100 feet because of off-corridor segments or typical cross section requirements, the FRA adjusted the Representative Route width. For example, Alternative 2 includes additional tracks along the NEC between New Haven and Hartford, CT, and therefore flares out to 250 feet for that segment; the Representative Route then returns to 150 feet where a new two-track configuration is proposed between Hartford, CT, and Providence, RI. Similarly, the current track configuration of the existing NEC between Washington, D.C., and New York City varies between two and six tracks. The Representative Route width of Alternative 3 in this area is 300 feet, for two tracks designed for speeds up to 220 mph adjacent to an existing, six-track right-of-way. Although the existing NEC configuration varies, a 300-foot-wide Representative Route is a conservative envelope and provides a smooth, encompassing footprint over a longer stretch of the Study Area in which to conduct the environmental review. Table 4-6 describes the dimensions of the Representative Route of the No Action and Action Alternatives.
The FRA prepared the environmental effects assessment, presented in Chapter 7, using the Representative Route, and in some cases, the construction type, of the Action Alternatives, categorizing potential effects by both geography and construction type. (Appendix A, Mapping Atlas, provides a graphical depiction of the Representative Routes of the Action Alternatives relative to environmental features analyzed in Chapter 7.)
| Alternative | From | To | Width (feet) | Representative Typical Cross Section |
|---|---|---|---|---|
| Alternative 1 | Washington, D.C. | Boston | 150 | 150 feet existing NEC |
| Alternative 2 | Washington, D.C. | New Haven | 150 | 150 feet existing NEC |
| New Haven | Providence | 150 | 150 feet existing NEC | |
| New Haven | Hartford | 250 | New tracks in center of existing, At-grade, existing track centers | |
| Hartford | Providence | 150 | Two-track typical - At-grade | |
| Providence | Boston | 150 | 150 feet existing NEC + New Segments + Curve Modifications | |
| Alternative 3 | Washington, D.C. to New York City | |||
| Washington, D.C. | Penn Station | 280 | New tracks adjacent to Existing, 6-Track At-grade | |
| New York City to Hartford, CT | ||||
| Penn Station New York | Hartford | 150 | Two-track typical - At-grade | |
| Penn Station New York | Ronkonkoma | 250 | New tracks adjacent 2 Exist At-grade 100 feet | |
| Ronkonkoma | Centereach | 150 | Two-track typical - At-grade | |
| New Haven | Hartford | 250 | New tracks adjacent 2 Exist At-grade 100 feet | |
| Hartford to Boston | ||||
| Hartford | Providence | 150 | Two-track typical - At-grade | |
| Providence | Boston | 250 | New tracks adjacent to Existing, 2-Track At-grade | |
| Hartford | Worcester | 150 | Two-track typical - At-grade | |
| Worcester | Boston | 150 | Two-track typical - At-grade | |
Source: NEC FUTURE team, 2015
Defining construction types allowed the FRA to highlight effects on resources based on Representative Route widths, as well as, sensitivity to construction-specific methods. For example, the climate change environmental effects assessment includes analysis specific to at-grade and trench construction types, as these types would be more vulnerable to flood risk than other methods not constructed at the surface (e.g., tunnel, aerial, embankment and major bridge). (Chapter 8, Construction Effects, contains additional information on construction methods and effects.) The FRA is considering the following six construction types:
The FRA developed a set of typical cross sections to understand the physical footprint associated with the possible combinations of construction type and required track configuration. Track configurations describe the number of tracks, structures, ancillary facilities, or station areas associated with proposed service and infrastructure improvements. The FRA considered three possible track configuration templates for NEC FUTURE:
The FRA customized the physical dimensions of these track configurations for construction type and mix of services. As such, the FRA developed 46 possible combinations of six different construction types and track configurations both on and off the existing NEC. For example, tunnel construction types are represented in two typical cross sections: 1) tunnel, which is applied to tunnel lengths less than or equal to 10 miles; and 2) long tunnel, which is applied to tunnels greater than 10 miles in length. The FRA used these typical cross sections to develop capital costs.23
Section 4.7 describes the geographic location and orientation of the Representative Route of each Action Alternative. The description highlights key environmental features, including existing rail stations, interstate and county roadways, parks, water features, and political boundaries (i.e., state, county, major metropolitan areas, etc.). The descriptions orient the reader to recognizable features along the path and are referenced throughout this Tier 1 Draft EIS to facilitate review of the No Action and Action Alternatives. (Section 4.6 provides additional details regarding the infrastructure requirements associated with the Action Alternatives.)
The FRA did not evaluate the physical footprint or service-related effects associated with ancillary facilities and supporting structures for storage and maintenance facilities, train control systems, and communication and signal systems in this Tier 1 Draft EIS. The specific geographic placement of these features would depend on further more-detailed analysis. From a programmatic perspective, the FRA identified the overall requirements, possible features, and potential locations. The assumptions for how the FRA considered each of these facilities or supporting structures are described below.
The FRA considered existing storage and maintenance facility locations where capacity could be added to accommodate the rolling stock requirements of the Action Alternatives. Potential sites could be located within, or could flare out beyond, the dimensions of the Representative Route. The potential locations, summarized in Table 4-7, are representative of the types of locations where storage and maintenance facilities would be located, and take into consideration the functional requirements of each Action Alternative.
| Intercity Facility Location | Current Principal Functions | NEC FUTURE assumptions |
|---|---|---|
| Washington, D.C. | Ivy City Facility: storage and maintenance of Acela Express, NE Regional, off-corridor and Long-Distance equipment | Yard expansion for growth; shop expansion for longer high-performance trainsets; new site required to accommodate full growth; storage and servicing of Metropolitan trainsets in northern VA (Alts. 2 & 3) |
| Philadelphia | Philadelphia Coach Yard: storage and maintenance of Keystone Corridor equipment | Expanded storage, servicing and inspection of NEC equipment required for peak service |
| New York City | Sunnyside Yard: storage and maintenance of Acela Express, NE Regional and Long-Distance equipment | Yard expansion for growth; shop expansion for longer high-performance trainsets; new site in northern NJ may be required for full growth |
| New Haven, CT | New Haven Yard: storage and maintenance of Hartford Line equipment, including diesel engines | Expanded storage, servicing and inspection of NEC equipment required for peak service |
| Boston | Southampton Street Yard: storage and maintenance of Acela Express and NE Regional equipment | Yard expansion for growth; shop expansion for longer high-performance trainsets; new site required to accommodate full growth |
Source: NEC FUTURE, 2015
Note: The location and principle functions of each location are applicable to all Action Alternatives.
The Action Alternatives would continue to use facilities in or near Washington, D.C., New York City, and Boston, where most trains would start and end service. Additional facilities could be located in Philadelphia and New Haven, CT, which are considered the "quarter points" of the existing NEC, and would support the beginning and end of the service day and tapering of the peak-period services.
The FRA did not consider footprint- and service-based environmental effects from storage and maintenance facilities for the Action Alternatives. The programming requirements and their potential effects on the local environment would be considered in subsequent project-level assessments. Specific locations for new facilities would consider, to the extent practical, the compatibility of adjacent land uses (e.g., industrial, consistent with manufacturing or warehouse uses) and resources considered in an effects assessment would include the possibility of existing hazardous materials, noise and vibration effects associated with overnight storage and layover of equipment, and visual effects of storage and maintenance facilities. As noted, to the extent possible, existing storage and maintenance facilities would be used and expanded as necessary to accommodate additional trainsets and service.
The potential sites are representative of future locations. They are included as placeholders and are based on current available information and a scan of potential locations with sufficient size and access to accommodate storage and maintenance requirements. (Appendix B, Service Plans and Train Equipment Options Technical Memorandum, provides additional details regarding representative Intercity and Regional rail storage and maintenance facilities.)
The FRA did not identify Regional rail storage and maintenance facilities requirements. Similar to Intercity service, storage and maintenance facilities would be located at the end points of the Regional rail network, where most trains would start and end service. However, the location and requirements for storage and maintenance facilities would depend on the specific operating patterns identified by individual Regional rail operators and how those services were integrated with each Regional rail operator's system, including branch line services not on the NEC. The requirements for additional Regional rail storage and maintenance facilities would be considered in subsequent project-level analyses.
Positive Train Control (PTC) is a control technology used to improve safety conditions on the railroad by preventing or avoiding train collisions and derailments due to excessive speeding. The purpose of PTC is to slow or stop a train that is operating at an excessive speed or operating in a manner inconsistent with the section of track it is traversing. The Rail Safety Improvement Act of 2008 (RISA) requires that PTC is implemented over much of the passenger and freight rail network by December 31, 2015.24
Although no specific specifications for PTC are provided in NEC FUTURE, it is assumed that the concept of PTC would be implemented in the No Action and Action Alternatives and the railroad network would be compliant with all FRA safety regulations.
The existing NEC signaling system would be upgraded where needed to permit the higher-density operations called for in the service plans. Service planning specifications include a fixed block (cab, no wayside) signal system and an overlay PTC system. Shorter block signal lengths provide for higher-density operation at shorter headways than the existing signal system.
Moving block technology was not assumed for the NEC or connecting corridors in the NEC FUTURE analysis. (Appendix B, Service Plans and Train Equipment Options Technical Memorandum, provides additional information.)
As a baseline for comparison, consistent with NEPA requirements, the FRA defined a No Action Alternative that identifies improvements to highway, freight rail, transit, air, and maritime modes that will occur by 2040 regardless of NEC FUTURE. The No Action Alternative represents a "snapshot in time" of reasonably foreseeable future transportation conditions in the Study Area while avoiding being speculative, since there is uncertainty in economic conditions, available funding, and political support for transportation projects.
The No Action Alternative is used to understand the consequences of continuing to invest in and operate the NEC as it operates today, particularly in comparison with the Action Alternatives. Given the growing population and economy of the Northeast region, operating the NEC at these current services levels in the year 2040 will mean more people riding the same number of trains, resulting in overcrowded trains and stations and a general worsening of train performance. (Appendix B, No Action Alternative Report, provides additional information on the No Action Alternative.)
The No Action includes both funded and unfunded improvements necessary to continue operations on the NEC. It provides a baseline for understanding the consequences of continuing to invest in and operate the NEC as it operates today.
The No Action Alternative continues today's service levels in the peak hours of operation-defined as the number of trains per hour by operator and type of service. The No Action Alternative assumes annual investments in programmed and funded major projects and in maintaining existing infrastructure sufficient to operate today's level of rail service. The capital cost of the No Action Alternative establishes a baseline from which to compare the incremental effects of the Action Alternatives. The capital cost estimate for the No Action Alternative is approximately $20 billion ($2014) and includes the estimated costs for planned rail projects grouped into three categories:
This cost estimate represents a reasonable best-case approximation for the amount of capital spending required to continue current NEC services. Examples of funded projects (Category 1) that are included in the No Action Alternative include NJ TRANSIT's Mid-Line Loop project, MTA-LIRR's East Side Access, MTA-MNR's Penn Station Access Improvements (initial funded phase); Connecticut DOT's Norwalk River Bridge Replacement, NJ TRANSIT/Amtrak's Raceway project, and various fleet acquisition programs (including Amtrak, Connecticut, and Massachusetts). Even when considered together with the other unfunded improvements (Categories 2 and 3), the No Action Alternative will fall short of bringing the NEC to a state of good repair. Therefore, in the No Action Alternative, the existing NEC will remain at heightened risk of service disruption due to infrastructure failures or external impacts, such as severe weather events. Unpredictable failures of antiquated system components and major structures are likely to remain under this alternative, but the specific scope or scale of cost impacts from these failures is highly uncertain. Nonetheless, additional capital costs will result from emergency or unplanned repairs, and substantial impacts to ongoing operations will be likely as well. (Appendix B, No Action Alternative Report, contains additional details regarding the rail project selection process.)
The FRA assumes that the No Action Alternative continues current service levels provided on the NEC, and-because the implications of continuing current funding levels on service are hard to predict-that sufficient funding will be made available. However, even with sufficient funding available to continue service levels, the No Action Alternative will not achieve a corridor-wide state of good repair or meet the needs of the Study Area, including addressing existing capacity constraints, gaps in connectivity, or expansion to markets that are underserved by rail.
The No Action Alternative will require annual funding levels in excess of current or historical funding trends of averaged approximately $600 million per year over the last 10 years.25 At an estimated cost of approximately $20 billion, the No Action Alternative will require an additional $200 million per year (in today's dollars)26 above these historical levels and in excess of capital funding from federal, state, and local sources. Even at this level of investment, the No Action Alternative will fall short of bringing the existing NEC to a state of good repair.
The FRA also considered defining a disinvestment scenario in which the current funding levels are maintained (but are not increased to allow for the maintenance of the current service levels as described in Section 4.3). Forecasting the implications of insufficient funding on the performance of the eight commuter railroads and Amtrak is difficult because of the uncertainty of what improvements would be funded and the related performance implications. However, given the condition of the aging infrastructure on the NEC, it is likely that the NEC's reliability, capacity, and services levels will decline under any scenario in which the current funding levels are not increased.
It remains uncertain if sufficient funding will be provided to sustain the increasing level of investment necessary to support the No Action Alternative. If sufficient funding is not made available, the NEC's reliability, capacity, and service levels will continue to degrade with the possible following repercussions:
However, as mentioned earlier, the FRA has decided that, for the purposes of providing a baseline for comparison against the Action Alternatives, the No Action Alternative assumes sufficient funding to maintain current service levels. In this way, the FRA can separate the discussion of historical or future funding trends from the assessment of positive and negative impacts of the Action Alternatives.
The FRA developed three distinct Action Alternatives for detailed study in this Tier 1 Draft EIS, drawing from the evaluation of the Preliminary Alternatives, interim analysis, and public and stakeholder outreach. These Action Alternatives are presented in the following sections.
The Action Alternatives represent a range of possible future visions for the Study Area, each intended to capture a different role for passenger rail in the future. The descriptions of the Action Alternatives are intended to represent what the NEC could be (but not prescribe) and would be influenced by many variables. The naming (to maintain, grow, or transform) captures the intent of each Action Alternative in describing a different vision for the future of passenger rail; however, the terminology is not intended to be a measurable outcome of the Action Alternatives but an organizing principle. The specific features of each Action Alternative represent the service and investment necessary to achieve three separate visions for passenger rail on the NEC.
Alternative 1 maintains the role of rail as it is today in the region, with the level of rail service keeping pace with the growth in population in the Study Area. Alternative 1 includes new rail services and commensurate investment in the NEC to expand capacity, add tracks, and relieve key chokepoints. Alternative 1 would bring the existing NEC to a state of good repair.
Alternative 2 grows the role of rail, expanding rail service at a rate greater than the proportional growth in regional population and employment. Alternative 2 maximizes capacity of the existing NEC and removes speed restrictions where practical and safe. Alternative 2 would bring the existing NEC to a state of good repair. Alternative 2 provides a new segment between New Haven and Hartford, CT, and Providence, RI, improving performance between New York City and Boston while connecting to new markets in the Connecticut River Valley.
Alternative 3 transforms the role of rail, supporting trips over longer distances and to places not currently well connected by passenger rail, positioning rail as the dominant mode for interregional travel to urban centers along the NEC. Alternative 3 includes a continuous second spine operating between Washington, D.C., and Boston. The second spine would be separate from the existing NEC, but connected to and integrated with services offered on the existing NEC at designated Major Hub and Hub stations. The second spine would support speeds up to 220 mph between major NEC markets and provide additional capacity for Intercity and Regional rail services throughout the Study Area. Alternative 3 would also include service and infrastructure improvements on the existing NEC to increase capacity, eliminate chokepoints, and bring the existing NEC to a state of good repair.
Between Washington, D.C., and New York City, Alternative 3 includes a single route for the second spine, located parallel to the existing NEC. This section of the second spine would connect to the existing NEC at several Major Hub stations, including Washington, D.C.; Baltimore-Washington International (BWI) Airport; Wilmington, DE; and Newark Penn Station, NJ.
Between New York City and Boston, Alternative 3 includes four "route options," all of which connect through Hartford, CT. The four route options give the FRA flexibility to consider different intermediate markets north of New York City should Alternative 3 be selected as the Preferred Alternative. There are two options for connecting New York City to Hartford and two options for connecting Hartford to Boston. These options include:
To measure the corridor-wide effects, the four route options between New York City and Boston were combined with the single Washington, D.C., to Boston section into four end-to-end versions of Alternative 3 as follows:
Section 4.7.4 explains the Alternative 3 routing options and their relationship to the existing NEC.
The No Action Alternative operates similarly to and at the same approximate level as today's service in the peak hours. The No Action Alternative serves the same stations and market areas along the NEC that are served today with one exception: East Side Access, a project currently under construction and thus part of the No Action Alternative, which will provide new LIRR service into Grand Central Terminal in New York City.
The Action Alternatives each offer the same service types: Intercity-Express, Intercity-Corridor, and Regional rail. Action Alternatives also incorporate enhanced service concepts (see Section 4.2.2.1).
The differences between the No Action and Action Alternatives are measured in the total number of trains, travel times, and passenger and train capacities for existing and new markets. (Table 4-8 and Table 4-9 describe the service for the No Action and Action Alternatives by service type and train frequency at selected screenlines27 along the NEC). Screenlines are used to capture the volume of passenger rail traffic at key locations along the NEC, particularly where capacity or utilization might change. The following screenlines along the NEC express the volume of passenger rail traffic as trains per hour per direction by service type:
Service types are summarized by Intercity, which includes Intercity-Express and Intercity-Corridor, and Regional rail service. Existing (2012) service levels are compared to services levels under the No Action Alternative and Action Alternatives (2040) for the peak-hour peak direction.28
The No Action Alternative assumes the same types of Amtrak interregional services, including Intercity-Express (Acela), Intercity-Corridor (Regional), and connecting corridors (i.e., to Springfield, MA; Harrisburg, PA; Albany, NY; or Richmond, VA). The No Action Alternative also assumes the same types of Regional rail services offered by the eight commuter railroads currently operating on the NEC. The No Action Alternative service levels for the peak hour, in the peak direction are the same as existing (2012) service levels as shown in Table 4-8.
| Screenline | Existing | No Action | Alternative 1 | Alternative 2 | Alternative 3 (range) |
|---|---|---|---|---|---|
| Washington, D.C. (north of Washington, D.C., at Anacostia River) | |||||
| Intercity | 2 | 2 | 6 | 10 | 12 |
| Regional rail | 4 | 4 | 6 | 10 | 12 |
| TOTAL | 6 | 6 | 12 | 20 | 24 |
| Philadelphia South (Chester, Pennsylvania) | |||||
| Intercity | 2 | 2 | 6 | 10 | 12 |
| Regional rail | 3 | 3 | 6 | 8 | 8 |
| TOTAL | 5 | 5 | 12 | 18 | 20 |
| Hudson River (between New Jersey and New York) | |||||
| Intercity | 3 | 3 | 7 | 10 | 16 |
| Regional rail | 21 | 21 | 30 | 42 | 54 |
| TOTAL | 24 | 24 | 37 | 52 | 70 |
| East River(between Manhattan and Queens) | |||||
| Intercity | 2 | 2 | 6 | 10 | 8-16 |
| Regional rail | 36 | 36 | 42 | 50 | 52-58 |
| TOTAL | 38 | 38 | 48 | 60 | 60-74 |
| New Rochelle (near New Rochelle Station) | |||||
| Intercity | 0 | 0 | 6 | 10 | 8-16 |
| Regional rail | 21 | 21 | 26 | 32 | 36-42 |
| TOTAL | 21 | 21 | 32 | 42 | 44-58 |
| Boston (south of Back Bay Station) | |||||
| Intercity | 1 | 1 | 5 | 8 | 4-12 |
| Regional rail | 9 | 9 | 12 | 14 | 20 |
| TOTAL | 10 | 10 | 17 | 22 | 24-32 |
Source: NEC FUTURE, 2015
Note: Where all Alternative 3 route options are the same, a single number is used.
* Connecting corridors include Springfield, Empire, Keystone, and Virginia service south of Washington Union Station.
** Only includes service to stations on the existing NEC; excludes new LIRR service to Grand Central Terminal with the East Side Access project.
| Screenline | Alternative 3 | |||
|---|---|---|---|---|
| Central CT/ Providence | Long Island/ Providence | Long Island/ Worcester | Central CT/ Worcester | |
| Washington, D.C. (north of Washington, D.C., at Anacostia River) | ||||
| Intercity | 12 | 12 | 12 | 12 |
| Regional rail | 12 | 12 | 12 | 12 |
| TOTAL | 24 | 24 | 24 | 24 |
| Philadelphia South (Chester, Pennsylvania) | ||||
| Intercity | 16 | 16 | 16 | 16 |
| Regional rail | 8 | 8 | 8 | 8 |
| TOTAL | 24 | 24 | 24 | 24 |
| Hudson River (between New Jersey and New York) | ||||
| Intercity | 16 | 16 | 16 | 16 |
| Regional rail | 54 | 54 | 54 | 54 |
| TOTAL | 70 | 70 | 70 | 70 |
| East River (between Manhattan and Queens) | ||||
| Intercity | 8 | 16 | 16 | 8 |
| Regional rail | 52 | 58 | 58 | 52 |
| TOTAL | 60 | 74 | 74 | 60 |
| New Rochelle (between Shell Junction and New Rochelle Station) | ||||
| Intercity | 12 | 12 | 4 | 4 |
| Regional rail | 42 | 36 | 36 | 42 |
| TOTAL | 58 | 44 | 44 | 58 |
| Boston (south of Back Bay Station) | ||||
| Intercity | 14 | 14 | 6 | 6 |
| Regional rail | 20 | 20 | 20 | 20 |
| TOTAL | 34 | 34 | 26 | 26 |
Source: NEC FUTURE Intercity Travel Demand Model outputs, April 2015; Regional Travel Demand Model outputs, April 2015
Note: Intercity-Corridor service includes Metropolitan and Intercity-Corridor-Other (off-corridor and long-distance services).
Under Alternative 1, Intercity service would increase two to threefold for markets between Washington, D.C., and New York. In markets from New York City to Boston where Intercity service today is 1 or less than 1 train per hour, service increases would be more dramatic with an increase from 1 to 8 trains an hour at the Boston screenline and an increase from 0 to 6 trains an hour at the New Rochelle, NY, screenline.
Intercity-Express travel times29 , representing the fastest travel times, between representative city-pairs are:
Alternative 1 provides opportunities for improvements for through trips on connecting corridor services in Washington, D.C., Philadelphia, New York City, New Haven, CT, and Boston. Connecting corridor services would benefit from Action Alternative 1 travel time savings for those trips continuing on to the NEC.
Regional rail service to existing NEC markets increases to meet demand but varies by market within the Study Area. Peak-hour Regional rail service in markets from Washington, D.C., to New York City would more than double. Increases in peak-hour trains along with expansion of trainset lengths, where possible, would meet the forecasted increase in ridership and maintain the Regional rail share of journey-to-work trips to and from the major metropolitan central business districts. Reverse-peak and off-peak service continues to be operated where it is provided today.
Intercity peak-hour service would be five times that available in the No Action Alternative at some screenlines with Alternative 2. Peak service would be greatest south of New York City, but the increase from the No Action Alternative would be most dramatic between New York City and Boston, with increases up to eight- or tenfold at New Rochelle, NY and Boston screenlines.
Intercity-Express travel times, representing the fastest travel times, between representative city-pairs are:
As with Alternative 1, Alternative 2 provides opportunities for improvement to through trips with connecting corridor services in Washington, D.C., Philadelphia, New York City, New Haven, CT, and Boston. Connecting corridor services would benefit from Action Alternative 2 travel time savings for those trips continuing on to the NEC.
Regional rail peak-hour service would more than double in Alternative 2. At heavily traveled screenlines, such as the Hudson River, Regional rail service would increase from 21 trains per hour to 42. Alternative 2 also includes additional service zones to increase peak zone express service and reduce average trip times. In addition, Alternative 2 increases service to Regional branch lines where sufficient capacity exists.
Under Alternative 3, Intercity peak hour service would be six times greater than the No Action Alternative service. For screenlines north of New York City, service would increase to 8 to 10 peak-hour trains where No Action Alternative frequency is 1 or less than 1 train per hour. In Alternative 3, these service increases would be distributed to both the existing NEC and the new second spine route option.
Intercity-Express travel times, representing the fastest travel times, between representative city-pairs are:
As with Alternatives 1 and 2, Alternative 3 provides opportunities for improvement to through trips with connecting corridor services in Washington, D.C., Philadelphia, New York City, New Haven, CT, and Boston. Connecting corridor services would benefit from Action Alternative 3 travel time savings for those trips continuing on to the NEC.
Regional rail service would increase nearly three times the peak-hour service in the No Action Alternative for many screenlines south of New York City. Regional service north of New York City would be nearly double the No Action Alternative's peak-hour trains per hour. Alternative 3 also includes additional service zones that would be created to increase peak zone express service and reduce average trip times. Service to branch lines would increase and more through service would be available where transfers are required in the No Action Alternative. Regional rail service would share the new second spine tracks with Intercity trains, offering significantly reduced trip times for long-distance commuters. In areas with the heaviest demand, more than 130 Regional rail trains per hour operate into Penn Station New York, during the peak period.
The No Action Alternative will continue to serve the same 110 stations that exist on the NEC today. Table 4-10 identifies the stations that will be served under the No Action Alternative. Regional rail serves all stations unless noted.
| Geography | Total | NEC Stations (excluding Connecting Corridors) |
|---|---|---|
| Washington, D.C. | 1 | Washington Union Station* |
| Maryland | 12 | New Carrollton*, Seabrook, Bowie State, Odenton, BWI Airport*, Halethorpe, West Baltimore, Baltimore Penn Station*, Martin Airport, Edgewood, Aberdeen*, Perryville |
| Delaware | 4 | Newark, DE*, Churchman's Crossing, Wilmington Station*, Claymont |
| Pennsylvania | 25 | Marcus Hook, Highland Ave, Chester, Eddystone, Crum Lynne, Ridley Park, Prospect Park, Norwood, Glenolden, Folcroft, Sharon Hill, Curtis Park, Darby, Philadelphia 30th St*, North Philadelphia*, Bridesburg, Wissinoming, Tacony, Holmesburg Junction, Torresdale, Cornwells Heights*, Eddington, Croydon, Bristol, Levittown |
| New Jersey | 15 | Trenton*, Hamilton, Princeton Junction*, Jersey Avenue, New Brunswick*, Edison, Metuchen, Metropark*, Rahway, Linden, Elizabeth, North Elizabeth, Newark Airport*, Newark Penn Station*, Secaucus |
| New York | 7 | Penn Station New York*, New Rochelle*, Larchmont, Mamaroneck, Harrison, Rye, Port Chester |
| Connecticut | 29 | Greenwich, Cos Cob, Riverside, Old Greenwich, Stamford*, Noroton Heights, Darien, Rowayton, South Norwalk, East Norwalk, Westport, Green's Farms, Southport, Fairfield, Fairfield Metro, Bridgeport*, Stratford, Milford, West Haven, New Haven Union Station*, New Haven State Street, Branford, Guilford, Madison, Clinton, Westbrook, Old Saybrook*, New London*, Mystic** |
| Rhode Island | 5 | Westerly**, Kingston*, Wickford Junction, T.F. Green, Providence Station* |
| Massachusetts | 12 | South Attleboro, Attleboro, Mansfield, Sharon, Canton Junction, Route 128*, Readville, Hyde Park, Forest Hills, Ruggles, Back Bay*, Boston South Station* |
Source: NEC FUTURE team, 2015
Note: Stations that do not have an asterisk are served by Regional rail only.
* Serves Intercity and Regional rail services
** Serves Intercity services only
Alternative 1 adds 19 new stations for a total of 129 stations. Five new stations are located in New York, the most of any state within the Study Area. Four stations each are added in both Maryland and Connecticut. The following five Local Hub stations would be upgraded to Hub stations to accommodate new service types and improve gaps in connectivity:
Alternative 2 includes 134 stations: 24 are new, including 6 in Connecticut and 5 in New York. A new station at Philadelphia International Airport would serve Intercity services.
Alternative 3 brings the most change to the Study Area, with 141-151 stations. Most of the stations would continue to operate as they do today with some improvements to keep up with increased local demand. Between 4 and 7 stations would be upgraded to Hub stations to accommodate new service types. Hartford Station would be upgraded from Hub to Major Hub to accommodate Intercity-Express service.
The remaining new stations would serve new or underserved markets (such as Long Island and Central Connecticut) or stations with highway access to the NEC (such as Baldwin Station near Chester, PA) or are adjacent to existing stations and designed to accommodate multiple service types with multiple levels of tracks and platforms and convenient passenger connections to the existing station. Table 4-11 lists the quantities of stations, by type, for the No Action and Action Alternatives.
| Station Type | Existing NEC | No Action | Alternative 1 | Alternative 2 | Alternative 3 (range) |
|---|---|---|---|---|---|
| Major Hub | 14 | 14 | 17 | 18 | 22-24 |
| Hub | 16 | 19 | 25 | 27 | 30-36 |
| Local | 80 | 77 | 87 | 89 | 88-92 |
| TOTAL | 110 | 110 | 129 | 134 | 141-151 |
Source: NEC FUTURE team, 2015
Note: Table 4-5 provides a complete list of stations, their locations, and the Action Alternative(s) in which each station appears. Appendix B, Stations Location and Access Analysis Technical Memorandum, further describes the selection of specific station types for each alternative.
Individual infrastructure elements identify the construction type and physical improvement associated with the Representative Route of the Action Alternatives. The FRA organized infrastructure elements by their functionality: chokepoint relief projects, new track, or new segment (see Section 4.2.5). Sections 4.6.1 through 4.6.3 describe the infrastructure elements for each Action Alternative. Consideration of service plans consistent with the vision of the Action Alternatives when determining the appropriate infrastructure allows improvements to be considered across different NEC markets and provides a framework for considering incremental or alternative combinations, but still within the long-term vision for a system-wide integrated passenger rail network.
The Action Alternatives use existing and proposed infrastructure to support the operations necessary to meet market growth. All Action Alternatives accommodate different types of trains; however, some segments in Alternatives 2 and 3 are dedicated to high-performance trainsets. This integration of service, performance, and infrastructure allows for a smaller infrastructure footprint, compared to a more typical approach where infrastructure is designed to accommodate shared use by a variety of operators with different operating requirements. (Appendix B, Tier 1 EIS Alternatives Report, contains further information on the location of selected infrastructure elements for the Action Alternatives.)
Alternative 1 would support increases in Intercity and Regional rail services, eliminating key chokepoints along the corridor, and increasing capacity at selected locations by adding additional track within the existing NEC and new segments parallel to and outside the existing NEC right-of-way.
Alternative 1 contains 11 chokepoint relief projects. Eight are located south of New York City in Maryland, Delaware, Pennsylvania, and New Jersey. Two projects north of New York City would address conflicting train movements near the New Rochelle station and South Norwalk and Bridgeport, CT. The FRA identified chokepoint projects at the following locations, which are keyed to Figure 4-4:
Alternative 1 includes five new track projects (Figure 4-4). Of the three located south of Midtown Manhattan, two are in Maryland where the existing NEC is currently a two- and three-track railroad. There are two new track projects north of Midtown Manhattan. Two tracks are included on the Hell Gate Line in Queens, NY and Bronx, NY, and one or two additional tracks are included near Route 128 station in Westwood, MA. New track projects, identified from junction to junction, are listed below:
Alternative 1 has three new segments30 parallel to and outside of the existing NEC right-of-way. Two new segments are located south of New York City: a new tunnel near Baltimore Penn Station and a third and fourth tunnel under the Hudson River between New Jersey and New York. New segments are listed below (approximate length in parentheses):
All of these new segments are locations where the railroad is capacity-constrained, where expanding capacity within the existing right-of-way is difficult or impractical, or, in the case of the New Baltimore Tunnel, where existing facilities require life-cycle replacement.
Alternative 1 includes the Old Saybrook-Kenyon new segment, between Old Saybrook, CT, and Kenyon, RI. This new segment would provide a more direct and faster route and would circumvent the existing movable bridges over navigable waterways connected to Long Island Sound, over which daily train movements are capped by current agreements and where approval for significant increases in future train traffic could be difficult to obtain. The new segment would save approximately 30 minutes of travel time compared to the existing Shore Line route and would free capacity on the existing Shore Line route.
Figure 4-4 depicts the chokepoint, new track, and new segment locations in Alternative 1.
Figure 4-4 : Alternative 1 (Chokepoint, New Track, and New Segment Locations)
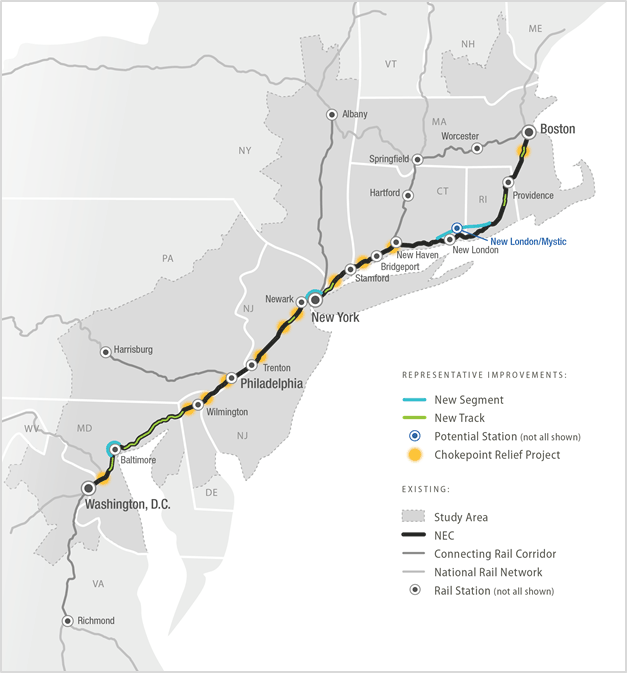
Source: NEC FUTURE team, 2015
Alternative 2 enhances the capacity of the existing NEC. Alternative 2 includes chokepoint relief projects, new track projects, and new segments to improve travel times in and around the major urban areas, on antiquated bridges, and in southeast Connecticut.
Most of the chokepoint projects in Alternative 2 are the same as those identified for Alternative 1, addressing chokepoints near stations, at railroad junctions, and at yard locations where trains lay over and change direction. The inclusion of new segments or new tracks at certain locations obviates the need for a separate chokepoint project. The FRA identified chokepoint projects at the following locations, which are keyed to Figure 4-5:
Alternative 2 includes the construction of several new track projects. Three are located in Maryland where the existing NEC is currently a two- and three-track railroad. One project is located north of Midtown Manhattan, adding two tracks to the Hell Gate Line in Bronx, NY.
Alternative 2 includes 11 new segments, parallel to and outside of the existing NEC right-of-way, at the following locations (approximate length in parentheses):
The biggest change in the Representative Route between the No Action Alternative and Alternative 2 is in eastern Connecticut and western Rhode Island. Alternative 2 includes a New Haven-Hartford-Providence new segment, providing a second route between New Haven, CT, and Providence, RI. The new segment would supplement service on the existing NEC between New Haven, CT, and Providence, RI, which has capacity-limited movable bridges, in addition to regional rail and freight services, allowing for increased Intercity-Corridor and Metropolitan services at hub stations located along the Connecticut and Rhode Island shoreline. Figure 4-5 depicts the chokepoint, new track, and new segment locations in Alternative 2.
Figure 4-5 : Alternative 2 (Chokepoint, New Track, and New Segment Locations)
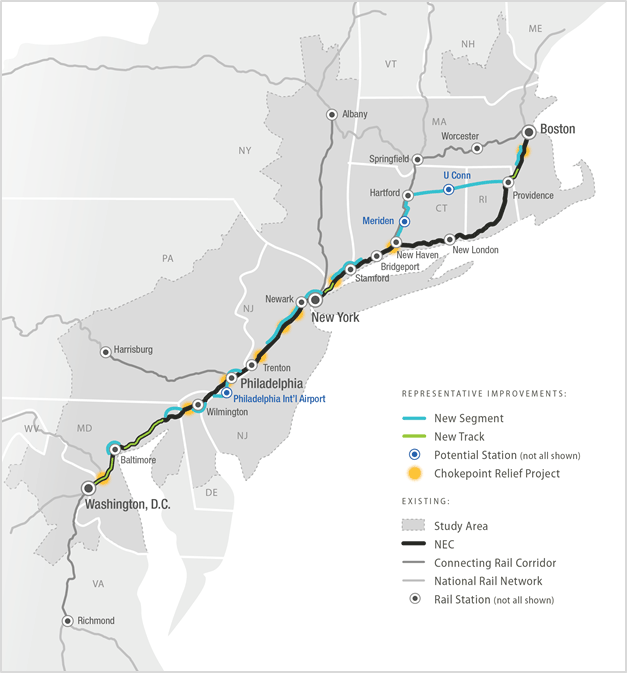
Source: NEC FUTURE team, 2015
Alternative 3 provides major new rail capacity throughout the entire NEC with two new tracks between Washington, D.C., and Boston, as well as upgrades to the existing NEC similar to Alternative 1, which would bring the existing NEC to a state of good repair and would provide capacity and chokepoint relief along the corridor.
These projects address chokepoints near stations, at railroad junctions, and at yard locations where trains lay over and change direction. The FRA identified chokepoint projects at the following locations, which are keyed to Figure 4-6:
There are fewer new track projects on the existing NEC in Alternative 3 since the need for additional tracks on the existing NEC is reduced with the construction of new high-speed tracks along the entire corridor. The locations of the most prominent new track projects are:
Alternative 3 includes new segments parallel to and outside of the existing NEC right-of-way, providing a second spine route between Washington, D.C., and Boston, MA.31. Alternative 3 also increases the capacity of the existing NEC with the Baltimore and Potomac Tunnel and new segments parallel to the existing NEC between New Rochelle, NY, and Stamford, CT.
Alternative 3 includes a new route through New York City, resulting in six tracks in tunnels beneath the Hudson and East Rivers, along with station facilities for all service types, which would address the most critical capacity issues within the Study Area. Additional infrastructure improvements in Alternative 3 include downtown routing in Baltimore and Philadelphia and terminal capacity expansion in Washington, D.C., New York City, and Boston. Alternative 3 includes new stations in downtown Baltimore, Philadelphia International Airport, and Center City Philadelphia. North of New York, new stations are specific to each routing option, as shown below.
There are several new six-track sections of railroad, locations where there is a new, two-track segment adjacent to a four-track NEC Spine, south of New York in Alternative 3. Six-track segments extend from Washington, D.C., to Baltimore, MD, and Philadelphia to New York City. Six-track sections are also located in coastal Fairfield County.
Figure 4-6 depicts the chokepoint, new track, and new segment locations included in Alternative 3.
Figure 4-6 : Alternative 3 (Chokepoint, New Track, and New Segment Locations)
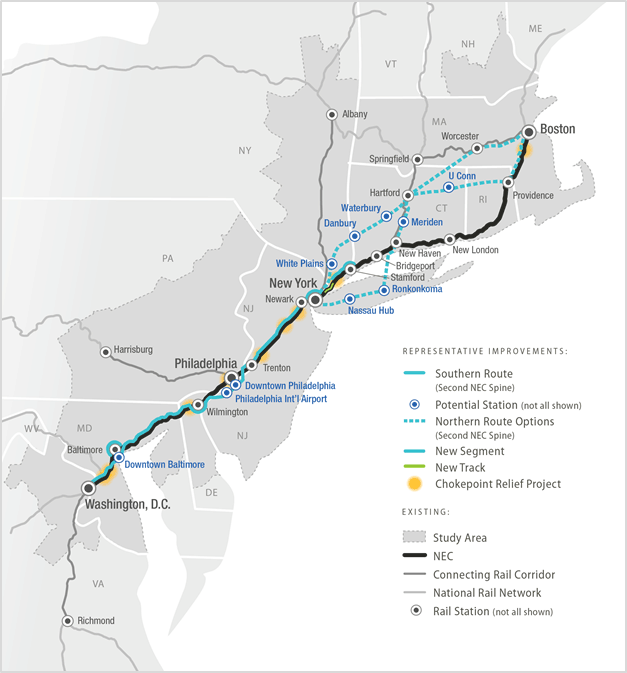
This section provides a state-by-state description of the Representative Route for each of the alternatives. The descriptions highlight key geographic features of the built and natural environments, how the alternative is positioned relative to the existing NEC, and the typical construction type. Where Action Alternatives have similar features, those features are described when they are first introduced and then referenced in subsequent alternative descriptions. Descriptions of the routes are organized south to north (or west to east) by state, metropolitan area or construction type being assigned-beginning in Washington, D.C., and ending in Boston. Appendix A, Mapping Atlas, provides the spatial location of each Representative Route relative to the general location of selected environmental resources. Table 4-12 provides a reference table to the map sheet(s) relative to the following subsection(s).
The rail component of the No Action Alternative includes the existing NEC between Washington Union Station in Washington, D.C., and Boston South Station in Boston, and the MTA-LIRR East Side Access project (currently under construction). The Representative Route of the existing NEC is described for each state the corridor passes through.32 The East Side Access project is described in New York only since the project extent is entirely within that state.
The existing NEC exits Washington Union Station in Washington, D.C., at-grade or on embankment and parallel to U.S. Route 50. The railroad is on embankment through the National Arboretum before crossing the Anacostia River into Prince George's County, Maryland.
The existing NEC is usually at-grade or on embankment, parallel to U.S. Route 50 through New Carrollton, crossing under Interstate 495 (I-495) at-grade near the suburban town of Seabrook and Bowie State University. The railroad crosses the Patuxent River into Anne Arundel County on embankment adjacent to the Patuxent Research Refuge before transitioning at-grade near Odenton and continuing north near BWI Rail Station and BWI Airport. The railroad is at-grade near State Route (S.R.) 295 and Patapsco Valley State Park crossing the Patapsco River into Baltimore County near I-895.
| Sheet #1 | Existing NEC | Alt 1 | Alt 2 | Alternative 3 | Regional Coverage (State and County) | ||||
|---|---|---|---|---|---|---|---|---|---|
| D.C. to NYC | New York City to Hartford | Hartford to Boston | |||||||
| via Central CT | via LI | via PVD | via WOR | ||||||
| 1 | X | X | X | X | Washington D.C.; Prince George's County, MD | ||||
| 2 | X | X | X | X | Anne Arundel, Baltimore County, Baltimore City, MD | ||||
| 3 | X | X | X | X | Baltimore City, Baltimore County, MD | ||||
| 4 | X | X | X | X | Harford County, MD | ||||
| 5 | X | X | X | X | Cecil County, MD | ||||
| 6 | X | X | X | X | New Castle County, DE | ||||
| 7 | X | X | X | X | Delaware County, PA | ||||
| 8 | X | X | X | X | Philadelphia County, PA | ||||
| 9 | X | X | X | X | Bucks County, PA | ||||
| 10 | X | X | X | X | Mercer, Middlesex County, NJ | ||||
| 11 | X | X | X | X | Union, Essex, Hudson County, NJ; New York County, NY | ||||
| 12 | X | X | X | X | X | X | New York, Bronx County, NY | ||
| 13 | X | X | X | X | X | X | Westchester County, NY; Fairfield County, CT | ||
| 14 | X | X | X | X | Mercer, Middlesex County, NJ | ||||
| 15 | X | X | X | X | Fairfield County, CT | ||||
| 16 | X | X | X | X | New Haven County, CT | ||||
| 17 | X | X | X | X | X | New Haven County, CT | |||
| 18 | X | X | X | X | X | X | New York, Kings, Queens County, NY | ||
| 19 | X | Nassau, Suffolk County, NY | |||||||
| 20 | X | Suffolk County, NY | |||||||
| 21 | X | X | Suffolk County, NY; Long Island Sound | ||||||
| 22 | X | X | X | Westchester County, NY | |||||
| 23 | X | Westchester County, NY | |||||||
| 24 | X | Fairfield County, CT | |||||||
| 25 | X | New Haven County, CT | |||||||
| 26 | X | X | X | X | X | Hartford County, CT | |||
| 27 | X | X | X | X | X | Hartford County, CT | |||
| 28 | X | X | X | Tolland County, CT | |||||
| 29 | X | X | Windham County, CT | ||||||
| 30 | X | X | X | X | Providence County, RI | ||||
| 31 | X | X | X | New Haven County, CT | |||||
| 32 | X | X | Middlesex, New London County, CT | ||||||
| 33 | X | X | New London County, CT | ||||||
| 34 | X | X | Washington County, RI | ||||||
| 35 | Washington, Kent County, RI | ||||||||
| 36 | X | X | Providence County, RI; Bristol County, MA | ||||||
| 37 | X | X | X | Norfolk County, MA | |||||
| 38 | X | X | X | Tolland County, CT | |||||
| 39 | X | Worcester County, MA | |||||||
| 40 | X | Worcester, Middlesex County, MA | |||||||
| 41 | X | X | X | X | Middlesex, Norfolk, Suffolk County, MA | ||||
Source: NEC FUTURE team, 2015
1 Sheet # refers to Map Sheet in Appendix A, Mapping Atlas.
The existing NEC is at-grade adjacent to U.S. Route 1 crossing into the city of Baltimore (Baltimore); shifting northeast on embankment and crossing Gwynns Falls on the west side of the Baltimore. The railroad shifts northeast in tunnel and trench system known as the Baltimore and Potomac Tunnels before crossing under I-83 and shifting southeast at-grade east of Baltimore Penn Station. The railroad is on embankment and aerial structure east of Baltimore Penn Station, transitioning to at-grade west of I-895, reentering Baltimore County near I-95 (Figure 4-7). The railroad is at-grade or on embankment, adjacent to Martin State Airport, between U.S. Route 40 and the Chesapeake Bay, crossing the Gunpowder River into Harford County. The existing NEC is at-grade or on embankment through Harford County, crossing the Bush River in Aberdeen, north of Aberdeen Proving Ground. The corridor crosses the Susquehanna River into suburban Cecil County, shifting at-grade to the north side of U.S. Route 40 and I-95, before entering New Castle County, DE, just east of Newark.
Figure 4-7 : No Action Alternative (Existing NEC through Baltimore)
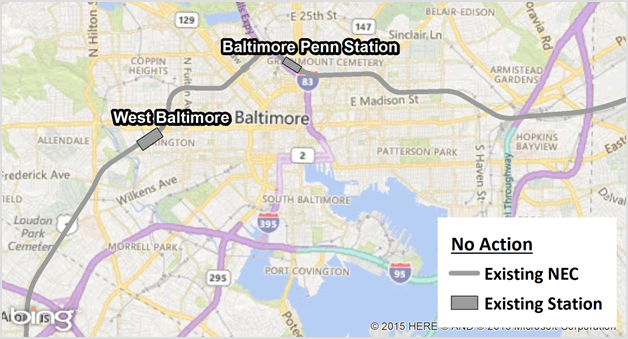
Source: NEC FUTURE team, 2015
Background Image Source: Microsoft Bing Maps, Accessed July 2015
The existing NEC is at-grade on the north side of I-95 through Newark, Stanton, and Newport, shifting east under I-95 on embankment and aerial structure through Wilmington's Central Business District on the north side of the Christina River. The railroad shifts north, crossing the Brandywine River, continuing at-grade between I-495 and the Delaware River through Edgemoor and Claymont into Delaware County, PA.
The existing NEC is at-grade or on embankment between I-95 and the Delaware River through the industrial towns of Marcus Hook and Trainer in southern Delaware County. The railroad transitions to a series of embankments and aerial structures through Chester, shifting north and crossing I-95 east of I-476 in Crum Lynne. The railroad continues at-grade or on embankment northeast through suburban Ridley Park, Glenolden, and Sharon Hill, crossing Cobbs Creek near Colwyn into the City of Philadelphia near I-76 and the Schuylkill River. The existing NEC follows the contour of the Schuylkill River north through Philadelphia 30th Street Station in University City, crossing the Schuylkill River near the Philadelphia Zoo, and continuing on embankment through the Bridesburg, Tacony, and Holmesburg sections of Philadelphia, before crossing Poquessing Creek into Bucks County, at-grade and parallel to I-95 and the Delaware River. The railroad is at-grade through Cornwells Heights, crossing the Neshaminy Creek into Croydon and transitioning to embankment, then shifting east and transitioning back to grade near U.S. Route 13 in Bristol. The existing NEC crosses at-grade under I-276 through northern Bucks County, crossing the Delaware River into Mercer County, NJ.
The existing NEC crosses the Delaware River into the City of Trenton, Hamilton, and West Windsor. The railroad crosses the Millstone River on aerial structure into Middlesex County, continuing north parallel to U.S. Route 1 and the New Jersey Turnpike. The existing NEC transitions mostly at-grade from an urban setting in Trenton, to a suburban setting in Monmouth Junction, back to an urban setting in the City of New Brunswick. The railroad crosses the Raritan River into Highland Park and continues usually on embankment through northern Middlesex County, Elizabeth in Union County, and Newark in Essex County. The existing NEC crosses the Passaic River into Hudson County northeast usually on embankment through Secaucus, before shifting east and in tunnel under the New Jersey Palisades and Hudson River into Midtown Manhattan.
The existing NEC remains in tunnel under Midtown Manhattan and the East River, transitioning at-grade near Hunters Point Avenue and I-495 in Queens County. The railroad shifts north onto embankment and again onto an aerial structure known as the Hell Gate Viaduct in Astoria, Queens (Figure 4-8). The railroad crosses the East River, Wards and Randalls Island, and Bronx Kill into Bronx County, continuing at-grade near I-278 in the Hunts Point section of the Bronx. The railroad is at-grade, parallel to I-278, shifting east near Bronx River Parkway, through the Parkchester, Morris Park, and Co-Op City sections of the Bronx. The existing NEC shifts north at-grade through Pelham Bay Park, entering Westchester County parallel to I-95. The railroad continues at-grade through New Rochelle, Mamaroneck, Rye, and Port Chester, crossing the Byram River into Fairfield County, CT.
As noted earlier, East Side Access, currently under construction, is also part of the No Action Alternative. That project will provide new LIRR service into Grand Central Terminal in New York. The rail infrastructure, described from east to west, consists of new tracks aboveground in Sunnyside Yard in Queens, extending north and connecting to the east side of the existing 63rd Street Tunnel near 43rd Avenue in Long Island City section of Queens. A new tunnel will connect to the 63rd Street Tunnel on the west side in Manhattan under Second Avenue, shifting south under Park Avenue and terminating under Grand Central Terminal on the east side of Manhattan.
Figure 4-8 : No Action Alternative (Existing NEC through New York City)
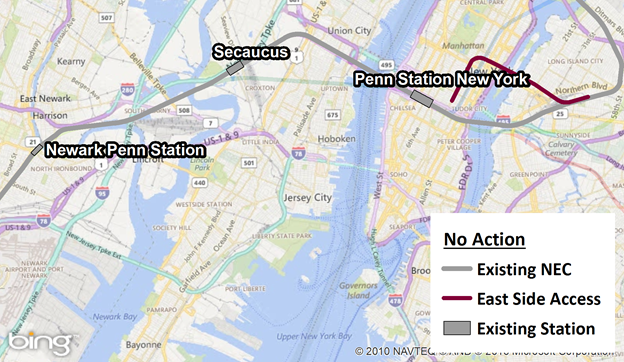
Source: NEC FUTURE team, 2015
Background Image Source: Microsoft Bing Maps, Accessed July 2015
The existing NEC is at-grade on the north side of I-95 in western Fairfield County, shifting at-grade to the south side of I-95 in Cos Cob, crossing the Mianus River and continuing east between I-95 and the Long Island Sound. The railroad is on embankment through Stamford on the north side of I-95, shifting back to the south side in Darien. The existing NEC enters the City of Norwalk at-grade, before crossing the Norwalk and Saugatuck Rivers. The railroad continues at-grade or on embankment east through Fairfield and Bridgeport, crossing the Housatonic River into New Haven County.
The existing NEC is at-grade or on embankment through Milford and the City of New Haven, shifting northeast, adjacent to I-91 before crossing the Quinnipiac River and shifting toward the Long Island Sound. The railroad continues at-grade or on embankment south of I-95 through Branford, Guilford and Madison along coastal New Haven County. The existing NEC crosses the Hammonasset River into Middlesex County and continues east through Clinton, Westbrook, and Old Saybrook usually at-grade or on embankment. The railroad crosses the Connecticut River into New London County, continuing east at-grade or on embankment through Old Lyme, Niantic, and New London, crossing the Thames River and continuing at-grade or on embankment east along the Long Island Sound through Mystic and Stonington. The railroad crosses the Pawcatuck River on aerial structure into Westerly, RI.
The existing NEC is usually at-grade or on embankment through Westerly, Hopkinton, Charlestown, and Richmond in southern Washington County, shifting northeast near South Kingston, and north in Exeter. The railroad continues at-grade or on embankment through North Kingston, crossing the Huet River into Kent County, continuing north through East Greenwich and Warwick, before crossing the Pawtuxet River into Providence County. The existing NEC is adjacent to I-95 through Cranston, entering the City of Providence at-grade and parallel to S.R. 10 before shifting east through downtown Providence. The railroad shifts north again near the Rhode Island State House and the Moshassuck River, and continues at-grade adjacent to I-95 through Pawtucket and Central Falls, crossing the Seekonk River into Bristol County, MA (Figure 4-9).
Figure 4-9 : No Action Alternative (Existing NEC through Providence)
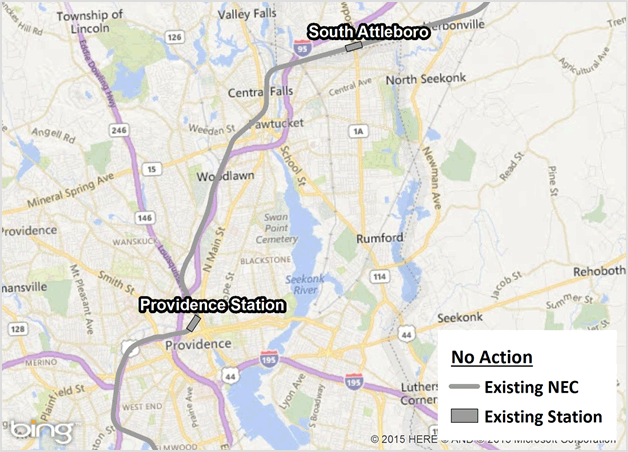
Source: NEC FUTURE team, 2015
Background Image Source: Microsoft Bing Maps, Accessed July 2015
The existing NEC continues east, parallel to I-95 in Attleboro, shifting north near Ten Mile River, usually at-grade or on embankment, through Attleboro and Mansfield. The railroad crosses I-495 at-grade in northern Mansfield, entering Norfolk County near the Rumford River. The railroad continues north through Foxborough, entering Sharon near the Canoe River and continuing north at-grade or on embankment through Canton. The existing NEC crosses the Neponset River and I-95 into Westwood near Route 128 Rail Station and continues north on embankment through Neponset River State Reservation in Dedham. The railroad enters the City of Boston near Sprague Street and continues usually at-grade north, parallel to Hyde Park Avenue. The existing NEC shifts northeast entering a series of trenches and tunnels near S.R. 203 near Columbus Avenue and Northeastern University, shifting east to the south side of I-90, and continuing at-grade east of Boston Back Bay Station. The railroad shifts north near I-93 and terminates at Boston South Station near Fort Point Channel (Figure 4-10).
Figure 4-10 : No Action Alternative (Existing NEC near Boston)
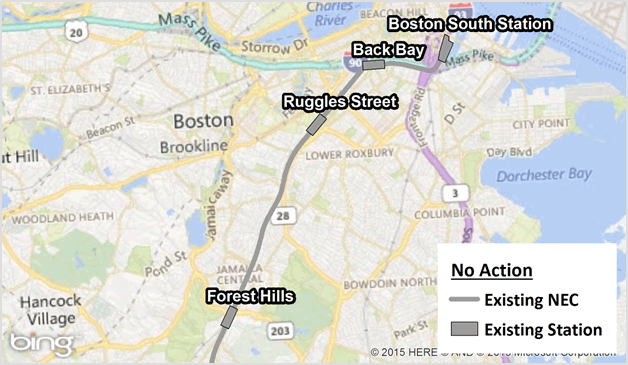
Source: NEC FUTURE team, 2015
Background Image Source: Microsoft Bing Maps, Accessed July 2015
As mentioned in Chapter 3, ownership of the NEC is divided among Amtrak, MTA-Metro-North Railroad, Connecticut Department of Transportation, and Massachusetts. Amtrak owns the existing NEC extending from Washington Union Station to New Rochelle, NY; and from Mill River, located east of New Haven, CT, to the Rhode Island/Massachusetts state border. Metro-North Railroad owns the existing NEC from New Rochelle, NY to the New York/Connecticut state border. The Connecticut Department of Transportation owns the existing NEC extending from the New York/Connecticut state border to Mill River. Massachusetts owns the existing NEC from the Rhode Island/Massachusetts state border to Boston South Station. A graphic depiction of ownership along the existing NEC is located in Appendix A, Mapping Atlas (Part 2). 33
The Representative Route of Alternative 1 is largely confined to the existing NEC between Washington, D.C., and Boston, except in locations where infrastructure is added to provide chokepoint relief or add capacity.
The following describes the locations where Alternative 1 differs or varies from the Representative Route of the No Action Alternative described previously. The bulleted details highlight adjacent environmental features, metropolitan areas and major passenger rail stations and their location relative to the existing NEC.
Figure 4-11 : Alternative 1 (Existing NEC and New Segment through Baltimore)
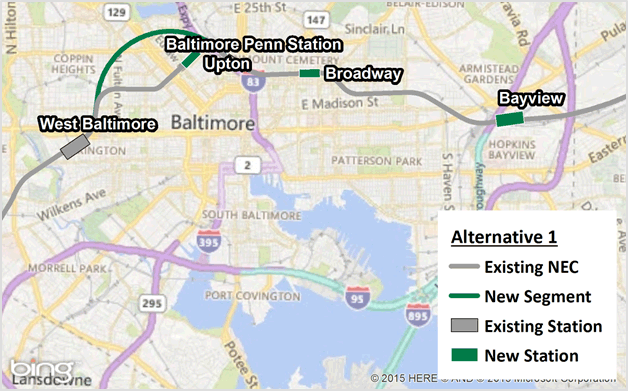
Source: NEC FUTURE team, 2015
Background Image Source: Microsoft Bing Maps, Accessed July 2015
Figure 4-12 : Alternative 1 (Existing NEC and New Segment through New York City Metropolitan Area)
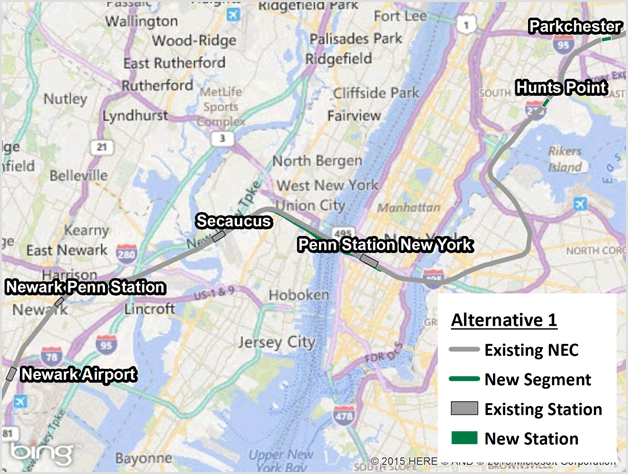
Source: NEC FUTURE team, 2015
Background Image Source: Microsoft Bing Maps, Accessed July 2015
Figure 4-13 : Alternative 1 (Existing NEC and New Segment near Old Saybrook, CT and Kenyon, RI)
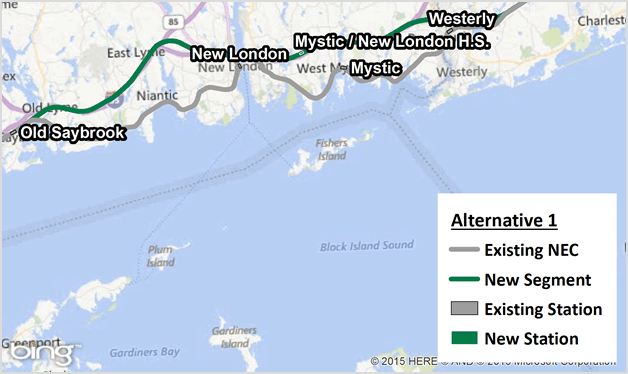
Source: NEC FUTURE team, 2015
Background Image Source: Microsoft Bing Maps, Accessed July 2015
Much of the Representative Route of Alternative 2 is identical to the No Action Alternative between Washington, D.C., and New Haven, CT, with some exceptions where infrastructure is added or modified to provide chokepoint relief, add capacity, or improve performance. Alternative 2 includes curve modifications-sections of the existing NEC that would be shifted to increase operating speeds and reduce travel times, as identified below. Section 4.7.1 describes the Representative Route for the No Action Alternative.
The following describes locations where Alternative 2 is different or varies from the No Action Alternative. Following the pattern of the No Action Alternative description, adjacent environmental features, metropolitan areas and major passenger rail stations and their location relative to the existing NEC or new segments are identified.
Figure 4-14 : Alternative 2 (Existing NEC and New Segment through Maryland and Delaware)
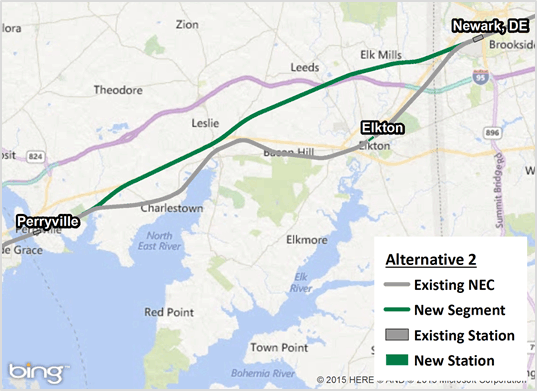
Source: NEC FUTURE team, 2015
Background Image Source: Microsoft Bing Maps, Accessed July 2015
Figure 4-15: Alternative 2 (Existing NEC and New Segment through Philadelphia)
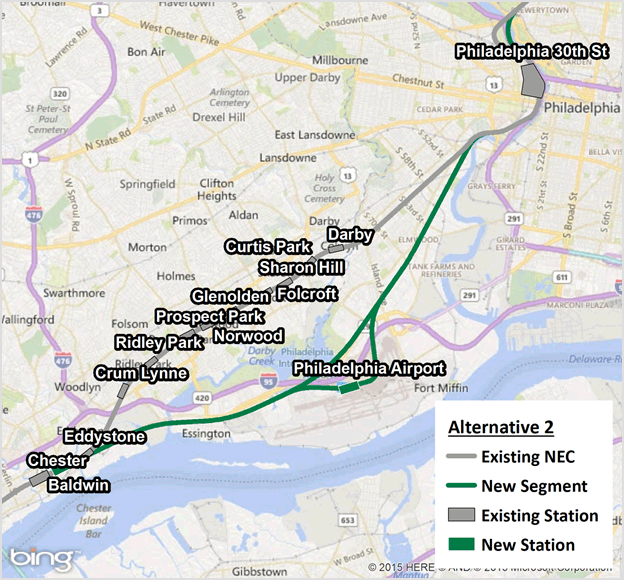
Source: NEC FUTURE team, 2015
Background Image Source: Microsoft Bing Maps, Accessed July 2015
Figure 4-16 : Alternative 2 (Existing NEC and New Segment through New York City Metropolitan Area)
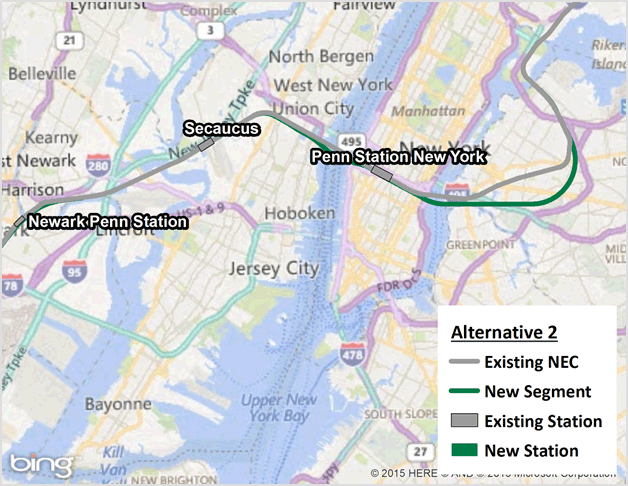
Source: NEC FUTURE team, 2015
Background Image Source: Microsoft Bing Maps, Accessed July 2015
The following describes the Representative Route of Alternative 3, highlighting the location of the second spine relative to the existing NEC, environmental features, metropolitan areas, and major passenger rail stations.
Alternative 3 is organized into three segments with routing options in two of the three segments as described in Section 4.4.3, providing the FRA with the flexibility to analyze options that would serve various intermediate markets north of New York should the FRA select Alternative 3 as the Preferred Alternative. Section 4.7.2 describes improvements to the existing NEC under Alternative 3. Only the second spine separate from the existing NEC is described below. Section 4.7.1 describes the Representative Route for the existing NEC.
Washington, D.C.
Alternative 3 connects with existing NEC Intercity and Regional rail services at Washington Union Station in Washington, D.C., and exits Washington Union Station in tunnel adjacent to the existing NEC. The alternative emerges from tunnel east of Bladensburg Road, NE and continues northeast on embankment through the National Arboretum, crossing the Anacostia River into Prince George's County, MD.
Maryland
Alternative 3 continues at-grade or on embankment, through suburban Prince George's County before crossing the Patuxent River and Patuxent Research Refuge into Anne Arundel County, continuing at-grade or on embankment northeast through Maryland, shifting approximately 1,000 feet from the existing NEC for short distances near Odenton and BWI Rail Stations. North of BWI Rail Station, Alternative 3 is adjacent to the existing NEC, crossing the Patapsco River on an aerial structure, returning to at-grade or on embankment through Patapsco Valley State Park into Baltimore County. Alternative 3 continues adjacent to the existing NEC and U.S. Route 1 (Figure 4-17) into Baltimore City where it shifts east of the existing NEC in tunnel through downtown Baltimore and north of the Inner Harbor. The alternative continues at-grade near I-895 on the west side of Baltimore, continuing in the same general northeast direction, but not adjacent to, the existing NEC through Rossville and White Marsh in suburban Baltimore County. Alternative 3 continues northeast, parallel to U.S. Route 40 through Edgewood and Riverside in Harford County before shifting closer to the existing NEC near Aberdeen Proving Ground and Aberdeen Station in northern Harford County.
Alternative 3 crosses the Susquehanna River on an aerial structure parallel to the existing NEC into Cecil County, where it shifts away from the existing NEC near Perryville and continues parallel to U.S. Route 40 through rural Cecil County and into New Castle County, DE, north of the West Branch of the Christina River.
Figure 4-17 : Alternative 3 (Existing NEC and New Segments through Baltimore)
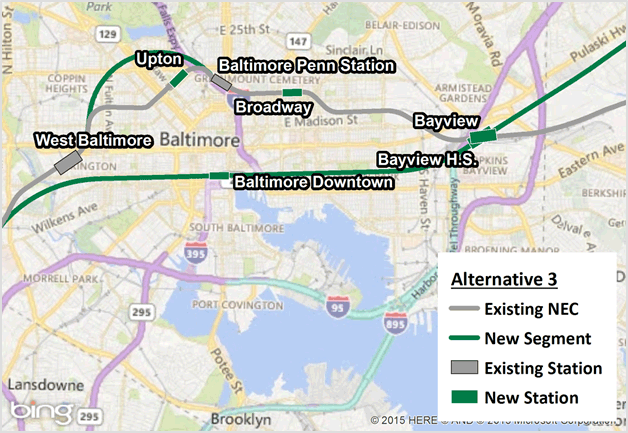
Source: NEC FUTURE team, 2015
Background Image Source: Microsoft Bing Maps, Accessed July 2015
Delaware
Alternative 3 continues northeast into Delaware, adjacent to the existing NEC between Newark and Wilmington, typically at-grade or on an aerial structure. The alternative shifts approximately one-mile south of the existing NEC near Wilmington Station, where it crosses the Christina and Brandywine Rivers on an aerial structure through an industrial section of the city. Alternative 3 continues north adjacent to the existing NEC east of I-495, and the Delaware River and Fox Point Park in Edgemoor, and continues north, adjacent to the existing NEC into Pennsylvania.
Pennsylvania
Alternative 3 continues north, adjacent to the existing NEC in southern Delaware County to Chester, where the alternative shifts three-miles south of the existing NEC in tunnel under the Philadelphia International Airport, where a new station would be built under the airport. The alternative continues in tunnel under the Schuylkill River, Philadelphia Navy Yard, and Center City section of Philadelphia near Market Street Station (Figure 4-18). Alternative 3 is at-grade or on embankment adjacent to the existing NEC east of Frankford Creek through northeast Philadelphia, crossing Poquessing Creek on an aerial structure into Bucks County. Alternative 3 continues adjacent to the existing NEC through Cornwells Heights, Bristol, and Morrisville before crossing the Delaware River into Mercer County, NJ.
Figure 4-18 : Alternative 3 (Existing NEC and New Segments through Philadelphia)
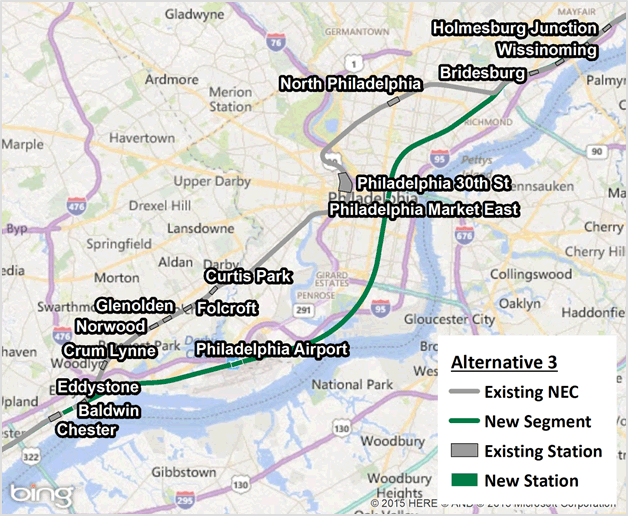
Source: NEC FUTURE team, 2015
Background Image Source: Microsoft Bing Maps, Accessed July 2015
New Jersey
Alternative 3 is typically at-grade or on embankment adjacent to the existing NEC from Trenton Station north through rural sections of northern Mercer County and southern Middlesex County. The alternative is in tunnel under the Raritan River through New Brunswick. Proceeding north, the route shifts from the existing NEC and is in short tunnel segments near Metuchen in Middlesex County, Elizabeth in Union County, and Newark in Essex County. Alternative 3 is above grade across Hackensack River, shifting south of the existing NEC in tunnel east of the Hackensack River and continuing through Jersey City, Union City, and Hoboken in Hudson County.
New York
Alternative 3 includes six tracks under the Hudson River: two existing tunnels (North River Tunnels), two new tracks in one or two tunnels as described in Alternative 1, and two new tracks in one or two tunnels in Alternative 3 (Figure 4-19). The alternative continues in tunnel east under Midtown Manhattan entering Penn Station New York.
Figure 4-19 : Alternative 3 (Existing NEC and New Segments through New York City Metropolitan Area)
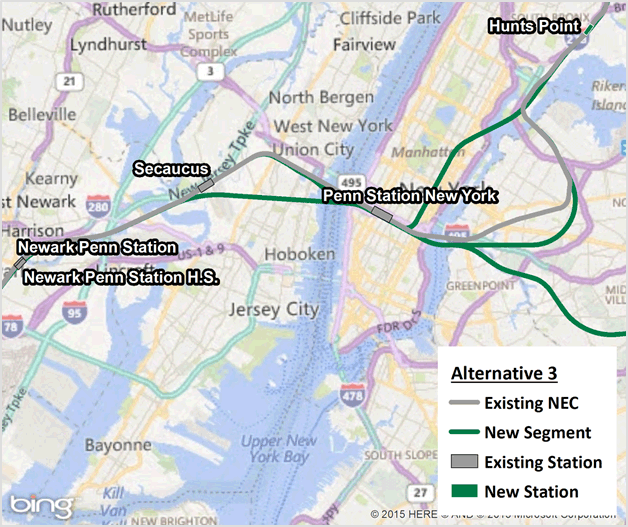
Source: NEC FUTURE team, 2015
Note: All Alternative 3 route options shown.
Background Image Source: Microsoft Bing Maps, Accessed February 2015
New York (via Central Connecticut)
East of Penn Station New York, the six-track configuration for Alternative 3 continues east under the East River (four existing East River tunnels and two new tracks in one or two tunnels under the East River), and continues in tunnel south of the existing NEC through Woodside Queens, where the two tracks rise to connect with the Hell Gate Viaduct in Astoria. At Third Avenue, two tracks in one or two tunnels split from the six-track railroad headed east, continuing north along the east side of Manhattan in tunnel(s) under the East River, Wards Island, and Randall's Island, continuing at-grade near the Bruckner and Sheridan Expressways in Bronx County at which point the two new tracks join and continue parallel to the existing NEC, generally at-grade or on embankment through Pelham Bay Park, entering Westchester County along the Long Island Sound.
In Mamaroneck, Westchester County, Alternative 3 veers north of the existing NEC near Mamaroneck Avenue and continues north primarily in tunnel or aerial structure through Scarsdale and White Plains, where the new White Plains East station is proposed. Alternative 3 continues northwest, adjacent to Westchester County Airport in Harrison, crossing into Connecticut for a short distance before reentering Westchester County and continuing north through northern Westchester County and southern Putnam County parallel to I-684 in tunnel, on embankment or aerial structure. Alternative 3 crosses the Connecticut state line again north of I-84.
Connecticut (via Central Connecticut)
Alternative 3 is in tunnel parallel to I-84, through northern Fairfield County to north of Danbury. The alternative crosses the Housatonic River via aerial structure into New Haven County and continues east in tunnel south of Waterbury. Alternative 3 crosses into Hartford County near I-691 and I-84 and continues northeast in tunnel to New Britain in the same general direction as I-84. In New Britain, Alternative 3 shifts north toward Hartford, entering downtown Hartford in tunnel.
New York City (via Long Island)
Alternative 3 continues east in six tracks under the East River (four existing East River tunnels and two new tracks in one or two tunnels under the East River), and continues in tunnel south of the existing NEC through Woodside Queens. At Woodside, the Representative Route splits into two; one segment rising to connect with the Hell Gate Viaduct in Astoria Queens. The other segment continues as Alternative 3, diverging south in one or two tunnels and continues south and east through Queens County, near the LIRR Montauk Branch. Alternative 3 continues on aerial structure or embankment east from I-678 to Floral Park in Nassau County, east of the Cross Island Parkway. The alternative shifts in tunnel south adjacent to the LIRR Hempstead Branch, continuing east in trench through Garden City. Alternative 3 continues in trench east parallel to Stewart Avenue, through Eisenhower Park and the village of Levittown. The alternative continues in trench east, reconnecting with the LIRR Main Line in Farmingdale, and continues east, crossing in the Suffolk County, adjacent to the Main Line through Wyandanch, Brentwood, and Ronkonkoma. Alternative 3 shifts north near Long Island MacArthur Airport, crossing I-495 in tunnel and continuing typically on embankment or aerial structure north to Stony Brook. Alternative 3 transitions to trench and then into tunnel near Port Jefferson where the alternative continues across the Long Island Sound in tunnel, emerging in New Haven County, Connecticut.
Connecticut (via Long Island)
At New Haven Rail Station, Alternative 3 travels north, inland between New Haven and Hartford, CT, on new infrastructure. Alternative 3 continues north at-grade or embankment, crossing I-91 and the Quinnipiac River through North Haven. Alternative 3 continues north, at-grade or on embankment, parallel to I-91 through Wallingford and Meriden entering Hartford County near U.S. Route 5. The alternative continues north through New Britain and Newington. In New Britain, Alternative 3 shifts east toward the city of Hartford, entering downtown Hartford in tunnel.
Connecticut (via Providence)
Alternative 3 continues east in tunnel in downtown Hartford under the Connecticut River to East Hartford. The alternative continues east into Tolland County, shifting northeast, usually in tunnel or on embankment, continuing south of Storrs in to Windham County, and crossing the Rhode Island state line in central Providence County.
Rhode Island (via Providence)
New, two-track infrastructure continues east from Windham County, CT, through rural western Providence County, usually on embankment. The infrastructure continues in tunnel beginning east of I-295, under the city of Providence, intersecting with the existing NEC at Providence Rail Station. Alternative 3 continues in tunnel under the Seekonk River into East Providence and comes to grade in Rumford, east of the Ten Mile River, where the infrastructure continues at-grade north before entering Bristol County, MA. (Figure 4-20)
Massachusetts (via Providence)
Alternative 3 continues north through Bristol County, usually at-grade, shifting adjacent to the existing NEC south of Attleboro Rail Station. Alternative 3 continues parallel to the existing NEC, usually at-grade or on embankment, deviating near Forest Hills, before it reaches its eastern terminus in Boston near Fort Point Channel.
Connecticut (via Worcester)
Alternative 3 via Worcester from downtown Hartford is in trench through East Hartford, east of the Connecticut River. The alternative diverges north near Long Hill Road, continuing in a northwest direction parallel to I-84 through Tolland and Windham Counties entering Massachusetts in Worcester County.
Massachusetts (via Worcester)
Alternative 3 continues north, parallel to I-84, before veering east near I-90 in Sturbridge. The alternative continues east, parallel to I-90 (Figure 4-21), consisting of a mix of construction types through Charlton and Oxford, keeping north of I-90 and west of I-290.
Figure 4-20 : Alternative 3 (Existing NEC and New Segments through Providence)
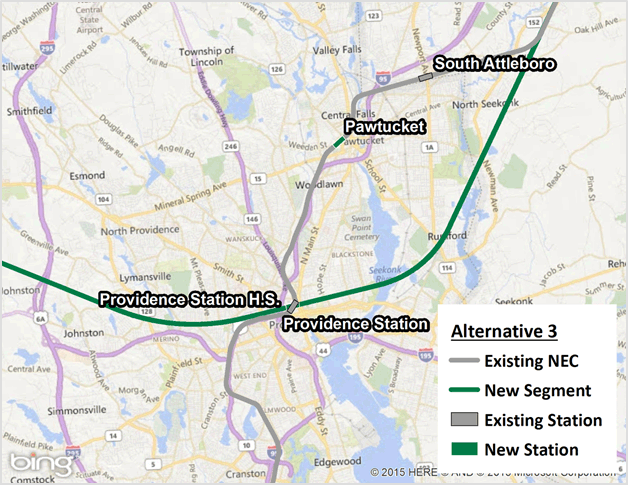
Source: NEC FUTURE team, 2015
Background Image Source: Microsoft Bing Maps, Accessed February 2015
Figure 4-21 : Alternative 3 (Existing NEC and New Segments though Boston)
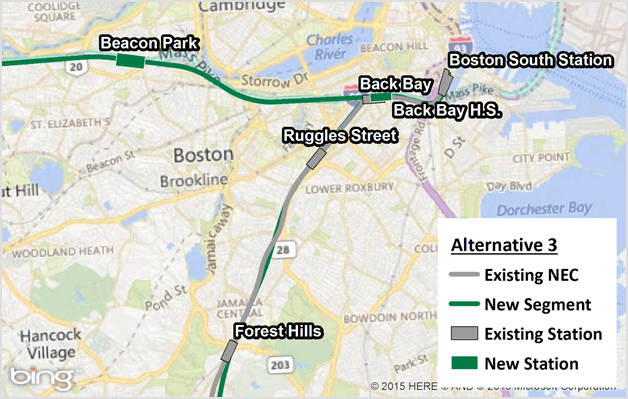
Source: NEC FUTURE team, 2015
Background Image Source: Microsoft Bing Maps, Accessed February 2015
Refer to Appendix A, Mapping Atlas (Part 2) for a depiction of the Representative Route, by construction type, for each Action Alternatives.
The FRA estimated capital and O&M costs for the No Action and Action Alternatives to better understand the associated costs of constructing, operating, and maintaining each Action Alternative relative to the amount of travel benefits each would provide. Section 4.3 provides the No Action Alternative capital cost estimating methodology and capital cost estimate. Cost estimates are high-level, order-of-magnitude estimates, based on a set of reasonable assumptions related to railroad infrastructure, equipment, service plans, and fare policies. The FRA will use the capital and O&M cost estimates to evaluate the No Action and Action Alternatives (see Chapter 9, Evaluation of Alternatives).
The FRA based the capital cost estimates for the Action Alternatives on infrastructure element quantities. Key elements include stations, shops, and lengths of infrastructure by construction type (e.g., tunnel, aerial, embankment), and rail systems. The FRA based vehicle costs on fleet requirements for the representative service plans and assumed vehicle performance specifications (e.g., speed, seating capacity and configuration, amenities). Rolling stock requirements were estimated for Intercity rail service only. Capital cost estimates include storage and maintenance facilities used for Intercity rail operations. Capital costs for these yards are non-site specific, and do not include acquisition costs for yard right-of-way.
Capital cost estimates are summarized for infrastructure, rolling stock and No Action Alternative projects or programs, as described in Section 4.3. Action Alternative costs include only No Action Alternative Categories 1 and 2 (defined in Section 4.3). No Action Alternative Category 3 costs are eliminated in the Action Alternatives because they include the capital cost to replace or rehabilitate obsolete assets. (Appendix B, Capital Costs Technical Memorandum, details the methodology used to estimate capital costs.)
Table 4-13 presents the estimated costs of the Action Alternatives. Capital costs for Alternatives 1 and 2 represent a range based on low to high allocated contingency rates34. An average capital cost estimate for the four Alternative 3 route options is presented as a range of lowest to highest values across all options. Table 4-14 presents a breakdown of capital costs for the individual Alternative 3 route options.
| Category | Alternative 1 (range) | Alternative 2 (range) | Alternative 3 (range) |
|---|---|---|---|
| Infrastructure | $52-54 | $116-$121 | $252-$293 |
| Vehicles | $3 | $5 | $6 |
| Subtotal | $54-$57 | $122-$127 | $257-$299 |
| No Action Alternative Projects | $9 | $9 | $9 |
| Total | $64-$66 | $131-$136 | $267-$308 |
Source: NEC FUTURE team, 2015
Notes: Infrastructure costs include professional services; costs do not include property acquisition costs for yards or stations.
| Category | Central Connecticut/ via Providence |
Long Island/ via Providence |
Long Island/ via Worcester |
Central Connecticut/ via Worcester |
|---|---|---|---|---|
| Infrastructure | $267-$279 | $252-$262 | $265-$276 | $281-$293 |
| Vehicles | $6 | $6 | $6 | $6 |
| Subtotal | $273-$285 | $257-$268 | $271-$281 | $286-$299 |
| No Action Alternative Projects | $9 | $9 | $9 | $9 |
| Total | $283-$294 | $267-$277 | $280-$291 | $296-$308 |
Source: NEC FUTURE team, 2015
Notes: Infrastructure costs include professional services; costs do not include property acquisition costs for yards or stations.
The FRA estimated NEC FUTURE O&M costs based on existing Intercity and Regional railroad operating costs for typical cost categories such as labor (e.g., train and maintenance crews), power and fuel, and management and administrative costs. The FRA developed the O&M cost estimates for the Action Alternatives through an iterative process, balancing operating costs with ridership and revenues. This process included cycles of review and validation and determining how the changes in service and operations, resulting from an Action Alternative, would require adjustments to estimated future costs since some services would be different than what is operated today. For Intercity services, the FRA assessed service plans to determine if operating revenues were likely to exceed operating costs. Table 4-15 and Table 4-16 present the O&M cost estimates for Intercity services only. (Appendix B, Operations & Maintenance Cost Technical Memorandum, details the O&M cost methodology.)
| No Action Alternative | Alternative 1 | Alternative 2 | Alternative 3 (average) | |
|---|---|---|---|---|
| Revenue | $1,900 | $2,175 | $2,485 | $2,730 |
| Cost | $905 | $1,325 | $1,840 | $2,240 |
| Operating Profit (Loss) | $995 | $8405 | $645 | $490 |
Source: NEC FUTURE, 2015
Note: Numbers may not add due to rounding.
| Central Connecticut/ via Providence |
Long Island/ via Providence | Long Island/ via Worcester | Central Connecticut/ via Worcester | |
|---|---|---|---|---|
| Revenue | $2,785 | $2,720 | $2,760 | $2,650 |
| Cost | $2,320 | $2,230 | $2,230 | $2,185 |
| Operating Profit (Loss) | $465 | $490 | $530 | $470 |
Source: NEC FUTURE, 2015
Note: Numbers may not add due to rounding.
The No Action Alternative did not undergo this iterative balancing process due to the expectation that its service plan will continue current service levels and fares on the NEC as a baseline. Fares per passenger are therefore higher in the No Action Alternative than in each of the Action Alternatives. The significant expansion in total intercity seats offered in the Action Alternatives allows an intercity operator to generate substantial revenue through higher passenger volumes at lower per-passenger costs. The No Action Alternative may also incur additional operating costs due to the higher risk of unplanned service disruptions resulting from infrastructure that is not in a state of good repair, or due to increased costs caused by operating in a highly constrained environment with many chokepoints that limit operational flexibility and the ability to recover from service issues.
The FRA analyzes the No Action and Action Alternatives presented in this chapter in subsequent chapters of this Tier 1 Draft EIS.
The FRA defined each Action Alternative as an end-to-end routing with associated service plans, infrastructure requirements, and costs, at a level of detail consistent with the programmatic nature of the decisions to be made through this Tier 1 Draft EIS.
While the FRA analyzed and considered the Action Alternatives in the context of corridor-wide benefits and consequences, it also evaluated the Action Alternatives in the context of varying regional and/or local needs, perspectives, and estimated demand for services. This layered approach builds in flexibility to customize the elements of a preferred investment program from across the full range of Action Alternative elements considered. Depending on the qualities or requirements of each subject area, analyses are organized around the following perspectives:
Following from this layered structure, the analyses and findings presented in Chapters 5 through 9 of the Tier 1 Draft EIS are organized around one or more of these five perspectives, depending on the resource-specific requirements.
The FRA intends to select a Preferred Alternative based on the analysis of benefits and consequences for the No Action and Action Alternatives presented in this Tier 1 Draft EIS. The Preferred Alternative will be one that reflects stakeholder and public input, but that allows elements of all Action Alternatives to be considered to reflect regional and local priorities. This approach to analysis, evaluation, and presentation of findings allows the FRA to refine the Preferred Alternative using the full range of components for the Action Alternatives considered in this Tier 1 Draft EIS. It is possible that the Preferred Alternative may involve a re-packaging of elements of the Action Alternatives to best meet the service needs of specific markets.
Although the Preferred Alternative will articulate a long-term vision for the role of rail on the NEC, the timing for incrementally implementing infrastructure and service in particular markets could vary, depending on how growth is expected to occur. Improvements required to meet rail demand in specific NEC markets would be added only as required, all within the framework of a consistent, comprehensive, long-term vision for a system-wide integrated passenger rail network.
1 The definition of high-speed rail varies depending on context and purpose. For NEC FUTURE, high-speed rail consists of service provided by Intercity-Express trains operating at a range of speeds from 150 to 220 mph.
2 In NEC FUTURE, a connecting corridor is defined as a passenger rail corridor that connects directly to another rail corridor (in this instance, the NEC) via a station transfer or through-train service.
3 A summary of this meeting is available on the NEC FUTURE website: http://necfuture.com/get_involved/public_meetings.aspx
4 Additional documentation regarding specific models created for NEC FUTURE is located in the technical memorandum specific to that subject. Appendix B contains these technical memorandums.
5 Magnetic levitation is an advanced transportation technology in which magnetic forces lift, propel, and guide a vehicle over a specially designed guideway. For more information on magnetic levitation technology, see Federal Railroad Administration, Magnetic Levitation Transportation Technology Deployment Program. 49 CFR Part 268. [FRA Docket No. FRA-98-4545; Notice No.3]. RIN 2130-AB29.
6 State of good repair: A condition in which assets are fit for the purpose for which they were intended. American Public Transportation Association. (2013). Defining a Transit Asset Management Framework to Achieve a State of Good Repair. Washington, D.C.: American Public Transportation Association. The FTA is required to establish "a definition of the term state of good repair (SGR) that includes objective standards for measuring the condition of capital assets of recipients, including equipment, rolling stock, infrastructure, and facilities." (Section 20008(b) of MAP-21). The definition is currently under development.
7 Intercity travel between these geographic market areas generally is assigned to stations or groups of stations.
8 "High-performance trainsets" refers to new state-of-the-art rolling stock consisting of electric multiple units (EMU) cars with high rates of acceleration and deceleration and capable of operating at speeds of 160 mph or greater. An EMU is a multiple unit train consisting of self-propelled carriages, using electricity as the motive power. An EMU requires no separate locomotive since electric traction motors are incorporated within one or a number of the carriages.
9 Acela Express service is considered Intercity-Express service because it provides higher onboard amenities and premium price points.
10 Operating speeds of Intercity-Corridor service is determined by the type of equipment being used and whether the service is operating on the existing NEC or a connecting corridor.
11 The representative service and infrastructure assumptions are not intended to be prescriptive.
12 Appendix B, Tier 1 EIS Alternatives Report, describes more fully the railroad operating characteristics and limitations on permissible maximum speeds and the mixing of freight and passenger traffic.
13 In NEC FUTURE, a connecting corridor is defined as a passenger rail corridor that connects directly to another rail corridor (in this instance, the NEC) via a station transfer or through-train service.
14 D.C. to Richmond Southeast High Speed Rail. http://www.dc2rvarail.com/ (accessed September, 28 2015)
15 Plan the Keystone. http://www.planthekeystone.com. (accessed September 28, 2015)
16 Empire Corridor Tier 1 EIS. https://www.dot.ny.gov/empire-corridor (accessed September 28, 2015)
17 Additional information regarding the NHHS Rail Program can be found in the FRA's Environmental Assessment/Environmental Impact Evaluation for the New Haven-Hartford-Springfield High-Speed Intercity Rail Program (2012).
18 The Northern New England Intercity Rail Initiative (NNEIRI) is being conducted by the Massachusetts Department of Transportation (MassDOT) and the Vermont Agency of Transportation (VTRANS), in collaboration with the Connecticut Department of Transportation and the Federal Railroad Administration. The Inland Route corridor runs between South Station in Boston and western Massachusetts via Worcester and Springfield, MA and southerly from Springfield to New Haven, CT for connections to the Northeast Corridor.
19 The FRA determined the station areas for Washington, D.C., Philadelphia, New York City, and Boston on a case-by-case basis, relying on previous planning and programming efforts by other agencies.
20 Interlockings are locations on multi-track rail lines where lines join or where crossovers between tracks are placed to permit trains to change from one track to another. They are part of the signaling and train control system and are centrally controlled by train dispatchers on the NEC.
21 The desired maximum grade for high-speed track is 2.5% with 3.0% permitted in limited situations. The maximum length of continuous run at the maximum grade should be less than 10,000 feet. In order to comply with these criteria, the contours of the existing terrain may require tunneling or viaducts to meet these conditions. Vertical alignment guidelines are based on American Railway Engineering and Maintenance of Way Association (AREMA) design criteria used on recent high-speed rail studies, including the California High-Speed Train Project (California high-Speed Rail Authority, Alignment Design Standards for High-Speed Train Operation TM 2.1.2. (2009, April 4). Retrieved August 17, 2015.
22 Minimum vertical distance required for marine vessels traveling under a major bridge at Mean Higher High Water (MHHW) levels
23 Refer to Appendix B, Capital Cost Technical Memorandum, for more information on typical cross sections.
24 U.S. Rail Safety Improvement Act of 2008, Pub.L. 110-432, 122 Stat. 4848, 49 U.S.C. § 20101. Approved 2008-10-16
25 Northeast Corridor Infrastructure and Operations Advisory Commission. (2014). Northeast Corridor Five-Year Capital Needs Assessment: Fiscal Years 2015 to 2019.
26 Assumes $20 billion cost of the No Action Alternative spent evenly over a 25-year timeframe.
27 Screenlines are imaginary lines across which rail and passenger traffic can be counted or measured.
28 "Peak hour" refers to when demand for transportation services is greatest. Peak direction refers to the direction of travel within the peak hour. In the morning, the peak direction is often toward metropolitan centers. In the evening, the peak direction is often away from metropolitan centers. Transit Cooperative Research Program. (2003). TCRP Report 100, Transit Capacity and Quality of Service Manual. Washington, D.C.: Transportation Research Board.
29 Travel Times are rounded. Refer to Chapter 5 and Chapter 9 for exact travel times between selected city pairs.
30 New segments contribute to the representative route of an alternative and are described in greater detail in Section 4.2.4.
31 Alternative 3 does not include the Old Saybrook-Kenyon new segment.
32 The Representative Route of the Action Alternatives is described relative to the Representative Route of the No Action Alternative.
33 Various states, cities, and agencies own stations along the existing NEC. For example, NJ TRANSIT owns 14 stations along the NEC.
34 The low allocated contingency rate is based on typical historical project values. The high allocated contingency is 50 percent greater than the low allocated contingency rates to reflect unknown risk
The information posted on this website includes hypertext links or pointers to information created and maintained by other public and/or private organizations. The FRA provides these links and pointers solely for information and convenience. When users select a link to an outside website, they are leaving the NEC FUTURE website and are subject to the privacy and security policies of the owners/sponsors of the outside website. The FRA does not control or guarantee the accuracy, relevance, timeliness or completeness of information contained on a linked website, or endorse the organizations sponsoring linked websites, the views they express, or the products/services they offer. The FRA cannot authorize the use of copyrighted materials contained in linked websites and is not responsible for transmissions users receive from linked websites.