Chapter 7 presents the environmental and socioeconomic effects of the Action Alternatives considered in the NEC FUTURE Tier 1 Draft Environmental Impact Statement (Tier 1 Draft EIS). As described in Chapter 2, Readers' Guide, the Study Area includes a broad geographic area, extending 457 miles from Washington, D.C. (in the south) to Boston, MA (in the north), and covering over 50,000 square miles. The Federal Railroad Administration (FRA) developed an approach to defining Action Alternatives and their Representative Routes in a way that allows for a meaningful assessment of potential Environmental Consequences. For each resource, the Affected Environment discussion documents existing conditions and sets the geographic boundaries where effects would occur and the Representative Route establishes a physical footprint for conducting Environmental Consequences assessments. The Context Area is a wider buffer around the Affected Environment that identifies adjacent or nearby environmental features potentially affected by the Action Alternatives should the Representative Route shift. The FRA applies this approach throughout the environmental effects assessment presented in this chapter.
Analysis in this chapter also reflects input from a variety of resource and regulatory agencies at the federal and state level obtained during a series of agency coordination meetings. These efforts included meetings about specific resource topics, Technical Working Groups, webinars, and mailings. The various agencies have reviewed and commented on the effects-assessment methodologies, data, and preliminary Tier 1 Draft EIS findings as are relevant to their agencies jurisdiction or specialty. The FRA used this input to develop the Tier 1 Draft EIS.
The FRA uses the following concepts and terminology (first defined in Chapter 2, Readers' Guide) in the effects assessment for each resource:
| Resource | Description of Resource | Affected Environment |
|---|---|---|
| Land Cover | Land cover within the Affected Environment | ½-mile-wide swath centered on the Representative Route for each Action Alternative |
| Agricultural Lands (Prime Farmlands and Timberlands) | Prime farmland and timberlands | 2,000-foot-wide swath centered along Representative Route for each Action Alternative |
| Parklands and Wild and Scenic Rivers | Publicly owned parklands; parklands receiving funding from the Land and Water Conservation Fund Act; Rivers identified as Wild and Scenic by the National Rivers Inventory within the Affected Environment | 2,000-foot-wide swath centered along Representative Route for each Action Alternative |
| Hydrologic / Water Resources | Coastal zones and saltwater wetlands, freshwater resources (including wetlands), and floodplains | 2,000-foot-wide swath centered on the Representative Route |
| Ecological Resources | Critical habitats and federally listed Threatened & Endangered Species | 3,000-foot-wide swath centered along Representative Route for each Action Alternative |
| Geologic Resources | Soil, geological, groundwater and topographic resources | 3,000-foot-wide swath centered along Representative Route for each Action Alternative |
| Hazardous Waste and Contaminated Material Sites | Known sources and potential suspected sources of contaminated and hazardous materials | 2-mile-wide swath centered along Representative Route for each Action Alternative |
| Cultural Resources and Historic Properties | Resources listed in or eligible for listing in the National Register of Historic Places within the Affected Environment or identified as significant by Indian Tribes | 1-mile-wide swath centered along Representative Route for each Action Alternative |
| Visual and Aesthetic Resources | Prominent visual resources and aesthetic qualities within the Affected Environment | 1-mile-wide swath centered along Representative Route for each Action Alternative |
| Environmental Justice | Minority and low-income populations within the Affected Environment | 1-mile-wide swath centered along Representative Route for each Action Alternative |
| Noise and Vibration | Ambient noise and vibration conditions, and noise-sensitive land cover categories | 5,000-foot-wide swath centered along Representative Route for each Action Alternative |
| Air Quality (including greenhouse gas emissions) | Current attainment status for criteria pollutants established by the U.S. Environmental Protection Agency for air-sheds within the Study Area | Determined by metropolitan planning organization by state within the Study Area |
| Energy | Energy consumed, particularly by the transportation sector | Entire Study Area |
| Climate Change and Adaptation (excluding greenhouse gas emissions) | Identification of areas susceptible to the impacts of climate change (sea-level rise, storm surge and/or extreme heat and cold events) | For flood hazards: 2,000-foot-wide swath |
| For extreme heat and cold events: Entire Study Area | ||
| Section 4(f) and Section 6(f) Resources | Parklands converted to transportation use, including publicly owned public parks, recreation areas, and wildlife/waterfowl refuges | 2,000-foot-wide swath centered along Representative Route for each Action Alternative |
| Converted lands or facilities that were acquired with Land and Water Conservation Fund Act funds | ||
| Historic resources converted to transportation use, including historic sites of local, state or national significance (eligible or listed) | 1-mile-wide swath centered along Representative Route for each Action Alternative | |
| Electromagnetic Fields and Electromagnetic Interference | Electromagnetic Fields (EMF) associated with electric conventional or high-speed train operations and electromagnetic interference that occurs when EMFs are produced | 2,000-foot-wide swath centered on Representative Route for each Action Alternatives |
| Safety | Operational, infrastructure and overall modal safety | Entire Study Area |
| Public Health | Potential public health-related effects for each of the relevant Tier 1 Draft EIS resource areas | As per the resource areas |
| Cumulative Effects | Combined result of the incremental direct and indirect effects of the Tier 1 Draft EIS Action Alternatives as well as the effects of other past, present, and reasonably foreseeable future actions, regardless of agency, on key resources | Study Area, expanded to include connecting corridors |
1. Chapter 5 addresses transportation effects and Chapter 6 addresses economic effects and growth.
Figure 7-1 shows the relationship among the Representative Route, Affected Environment, and Context Area. These areas are all within the broader Study Area.
Figure 7-1 : Representative Route, Affected Environment, and Context Area
The FRA describes the Environmental Consequences of Action Alternatives either quantitatively or qualitatively, depending on the resource. Quantitative analyses rely on geographic information system data and mapping to calculate the effects of the footprint of the Action Alternatives, or rely on service data to calculate the effects of the service proposed by the Action Alternatives. Qualitative analysis may consider information from other sources, such as existing reports and studies, to assess potential effects. The FRA attributes Environmental Consequences to one or both of the following:
Each of the resource-specific sections presents direct effects. Direct effects include effects related to encroachment (even if separated by space or time) or specific impacts that result from an action affecting a particular resource. Chapter 6 presents indirect effects related to induced growth and development resulting from construction and operation of the Action Alternatives.
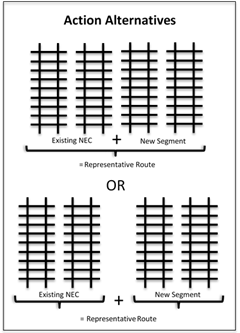
Alternative 3 includes improvements to the existing NEC plus the creation of a new two-track, high-speed route from Washington, D.C., to Boston. The FRA considered several possible routing options during the alternatives development process (Chapter 4, Alternatives Development). Based on this analysis, the FRA selected a single route between Washington, D.C., and New York City; however, the FRA identified two route options between New York City and Hartford, CT, and two route options between Hartford and Boston for further consideration in this Tier 1 Draft EIS. The route south of New York City and route options north of New York City include the following:
As a result, the FRA presents the findings for Alternative 3 as a range of values representative of the entire route between Washington, D.C., and New York City as well as the four route options north of New York City. The FRA usually presents the effects that would occur specifically under the portion of Alternative 3 between Washington, D.C., and New York City and the different route options in separate tables within the environmental resource sections of this chapter. In some sections of this Tier 1 Draft EIS, Alternative 3 is represented as Alternative 3.1 (Central CT/Providence), Alternative 3.2 (Long Island/Providence), Alternative 3.3 (Long Island/Worcester) and Alternative 3.4 (Central CT/Worcester). The FRA considers these as the representative end-to-end options for service-related analysis specific to Alternative 3. (Appendix B presents additional details about the Alternative 3 route options considered and their evaluation.)
Analysis of the No Action Alternative:
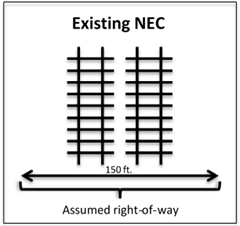
The No Action Alternative incorporates improvements such as track and signal upgrades within the existing NEC right-of-way. It also includes projects that may extend beyond the existing right-of-way, such as bridge and station rehabilitation or expansion projects, and other non-rail transportation projects. Because some of the projects included within the No Action Alternative are still in the planning stages of development, the physical limits of the No Action Alternative are not well defined. As a result, calculating the footprint-related Environmental Consequences for the No Action Alternative was not possible. However, for the purposes of comparison against the Action Alternatives, the FRA used the existing NEC as a proxy for understanding potential footprint-related effects of the rail projects included in the No Action Alternative because the physical footprint of improvements associated with rail projects included in the No Action Alternative would occur primarily within the physical footprint of the existing NEC.2 As stated earlier in this section, the FRA assumed the footprint associated with the existing NEC to be 150 feet wide, which conservatively covers the width of a four-track railroad. Each of the Action Alternatives also includes the improvements that the No Action Alternative will undertake.
Therefore, in Chapter 7 of this Tier 1 Draft EIS:
This approach to the analysis of the No Action Alternative is consistent with the following:
Level of Detail:
The interaction of resource-specific data (e.g., land cover, demographics, and ecological resources), service data, and information about the Action Alternatives drives the Affected Environment and Environmental Consequences analyses of resources evaluated in Chapter 7. As described in Chapter 2, Readers' Guide, the FRA analyzed readily available secondary source data (e.g., geographic information system [GIS]-based, published reports, technical analyses), and did not conduct fieldwork or subsurface testing of any kind as part of this Tier 1 Draft EIS. The FRA reviewed the data carefully to ensure a uniform level of detail since the data were collected from a variety of sources. For the Tier 1 Draft EIS resources assessed in Chapter 7, the FRA collected data for each resource in 2012 for the latest year in which a complete year of data was available, depending on the resource and availability of data. For a list of data sources used for each resource, refer to Appendix E for the individual resource methodologies. For the Tier 1 Final EIS, the FRA will update information for the Preferred Alternative as available and as appropriate to inform the decision to be made.
Data Considerations:
Chapter 7 presents data as totals for each of the affected states and Washington, D.C. Areas of interest and corresponding data are called out by county as needed in each resource section of Chapter 7. The highest level of detail collected and presented is at the county level; data were collected for each county for each resource and is presented in Appendix E.
Impacts to the resources listed in Table 7-2 are analyzed in this chapter in accordance with NEPA and FRA's Procedures for Considering Environmental Impacts (64 Fed. Reg. 28545). Other resources evaluated in this Tier 1 Draft EIS, including Transportation Effects, Economic Effects and Growth and Indirect Effects, and Construction Effects are addressed in Chapters 5, 6, and 8, respectively. Table 7-2 also identifies the key resources identified by the FRA.
| Chapter | Resource | Key Resource |
|---|---|---|
| 7.2 | Land Cover | X |
| 7.3 | Agricultural Lands (Prime Farmland and Timberlands) | |
| 7.4 | Parklands and Wild And Scenic Rivers | X |
| 7.5 | Hydrologic / Water Resources | X |
| 7.6 | Ecological Resources | X |
| 7.7 | Geologic Resources | |
| 7.8 | Hazardous Waste and Contaminated Material Sites | |
| 7.9 | Cultural Resources and Historic Properties | X |
| 7.10 | Visual and Aesthetic Resources | |
| 7.11 | Environmental Justice | X |
| 7.12 | Noise and Vibration | |
| 7.13 | Air Quality | |
| 7.14 | Energy | |
| 7.15 | Climate Change and Adaptation | X |
| 7.16 | Section 4(f) and Section 6(f) Resources | X |
| 7.17 | Electromagnetic Fields and Electromagnetic Interference | |
| 7.18 | Safety | |
| 7.19 | Public Health | |
| 7.20 | Cumulative Effects | |
| 7.21 | Irreversible and Irretrievable Commitment of Resources |
X = Key Resource. While all environmental factors are important, some have greater potential to influence the identification of a Preferred Alternative since they are tied to Executive Orders, environmental laws, regulations and regulatory requirements, including but not limited to Executive Order 12898 (Federal Actions to Address Environmental Justice in Minority Populations and Low-income Populations), Section 404 of the Clean Water Act, Section 106 of the National Historic Preservation Act, Section 7 of the Endangered Species, and Section 4(f) of the U.S. Department of Transportation Act. Some of these laws require avoidance of impacts or selection of an alternative that has the least environmental impact.
Table 7-3 summarizes the organization of this chapter. It also references appendices containing additional technical methodologies and analysis (Appendix E) and mapping (Appendix A). For each resource area, the FRA generally presents the Affected Environment and Environmental Consequences from south to north following the NEC or the Representative Route of each Action Alternative. This Tier 1 Draft EIS presents the findings by state; related appendices provide details for each state by county. Appendix A, Mapping Atlas, presents all resource mapping.
| Effects-Assessment Methodology | Affected Environment and Environmental Consequences | Potential Mitigation and Subsequent Tier 2 Analyses | |
|---|---|---|---|
| In Each Chapter 7 Resource Area: | A definition of the resource and summary of the methodology used to evaluate that particular resource | An overview of the character of the resource throughout the Study Area and within the Context Area, and identification of resources within the Affected Environment and effects on that resource by Action Alternative | A list of potential mitigation strategies and best practices appropriate to be identified at the Tier 1 level and acknowledgement of where additional and more detailed analyses would be needed at the project level (Tier 2) evaluation |
| Visit Appendix E, Technical Resource Documentation, for: | A complete effects-assessment methodology, defining the resource and data sources, and explaining how the Affected Environment was defined and established, and how the effects on each resource were evaluated and reported | Detailed data outputs, additional assumptions, and criteria used to focus presentation of environmental findings in each resource area of Chapter 7 | |
| Visit Appendix A, Mapping Atlas, for: |
|
1 The FRA did not evaluate other ancillary facilities, such as maintenance and storage yards, traction power substations, etc. in this Tier 1 Draft EIS. The FRA did not identify specific locations of these facilities as part of the development of alternatives (see Chapter 4, Alternatives Considered).
2 Most rail improvement projects included in the No Action Alternative will take place within the existing NEC right-of-way, except for some projects underway such as East Side Access in New York City.
The information posted on this website includes hypertext links or pointers to information created and maintained by other public and/or private organizations. The FRA provides these links and pointers solely for information and convenience. When users select a link to an outside website, they are leaving the NEC FUTURE website and are subject to the privacy and security policies of the owners/sponsors of the outside website. The FRA does not control or guarantee the accuracy, relevance, timeliness or completeness of information contained on a linked website, or endorse the organizations sponsoring linked websites, the views they express, or the products/services they offer. The FRA cannot authorize the use of copyrighted materials contained in linked websites and is not responsible for transmissions users receive from linked websites.