This section provides an overview of the Environmental Consequences and benefits documented in Chapters 7.2-7.21. It also includes an overview of the effects and benefits identified in Chapter 5, Transportation, and Chapter 6, Economic Effects and Growth, and Indirect Effects, since the findings in these chapters also influence the analyses conducted for some of the resources presented in Chapter 7. Appendix E provides detailed information for each Action Alternative, by state and by county. Appendix A, Mapping Atlas, provides a visual overview of where resources are located in relation to the existing Northeast Corridor (NEC) and Action Alternatives. Appendix A also provides mapping that shows the Representative Route of each Action Alternative.
In general, impacts on environmental resources would be greatest in areas where the Action Alternatives go off of the existing NEC into less developed areas in a new right-of-way. However, some impacts do exist on resources located along and within the existing NEC right-of-way. This Tier 1 Draft Environmental Impact Statement (Tier 1 Draft EIS) presents a conservative assessment of potential environmental consequences because the analytical approach is based on conceptual engineering and a qualitative level of detail.
The No Action Alternative represents the Study Area in 2040 regardless of NEC FUTURE. It includes reasonably foreseeable future projects and transportation improvements to highway, freight rail, transit, air, and maritime modes that will occur by 2040 that range in scope and complexity. Most of the projects and activities included as part of the No Action Alternative occur within the existing NEC right-of-way. Under the No Action Alternative, passenger rail service along the NEC operates and provides approximately the same level of service as provided today. As a result, "service-related" effects on noise and vibration are unlikely. However, service-related effects on air quality could result due to increased congestion within the overall transportation network. "Footprint" effects on environmental resources under the No Action Alternative vary, depending on the scope of the project being implemented. Examples of the types of activities occurring under the No Action Alternative include, but are not limited to the following:
In some cases projects that are part of the No Action Alternative have footprints and effects that extend beyond the existing NEC right-of-way. Those types of projects, depending on the scope and complexity, have a greater potential to affect environmental resources than those activities occurring within the existing NEC right-of-way.
Table 7.1-1 summarizes the likely effects, by resource, for activities occurring under the No Action Alternative. The extent of likely effects are unknown and not quantified as part of this Tier 1 Draft EIS.
While effects resulting from the No Action Alternative are not quantified (see Chapter 7, Introduction, for an explanation of the approach to identifying effects associated with the No Action Alternative), effects are likely to occur to various resources that exist within and adjacent to the existing NEC right-of-way. Benefits resulting from the Action Alternatives, such as increased mobility, accessibility and connectivity would not occur under the No Action Alternative. In some cases, the No Action Alternative would result in adverse effects on some populations, including Environmental Justice communities, because capacity is unmet and does not keep pace with population and employment growth, thereby negatively affecting mobility, accessibility, and connectivity. Furthermore, unmet capacity will require travelers to continue to rely on automobiles, air, and intercity bus for travel in the corridor as they do today. Under the No Action Alternative, transportation congestion would increase due to projected population growth and continued reliance on automobiles. As a result, the increased congestion would result in negative effects on energy consumption and air quality.
Improvements under the No Action Alternative are subject to varying levels of environmental review and permitting (federal, state, local), depending on the activity and funding source(s). The evaluation of resource impacts and required permits associated with those activities are the responsibility of the implementing agency and project sponsor.
A range of benefits and impacts occur with each of the Action Alternatives since each proposes varying degrees of investment from both a service and infrastructure perspective. As such, benefits and impacts associated with each Action Alternative differ due to the level of service provided and infrastructure proposed.
Each Action Alternative has the potential to change how people travel across the Study Area and reduce the number of non-rail trips as travelers switch to passenger rail service. More passenger rail stations are added, connecting more people to more places. Train services become more frequent providing more flexibility and more options for travelers. Each Action Alternative provides improved capacity, mobility, and connectivity. These transportation benefits result in economic benefits to regions served by the NEC. The additional capacity enables greater accessibility for workers and employers, allows major economies to grow larger and be more productive, and increases development around stations due to travel times savings and greater accessibility with more connections, services to new locations and prices available to travelers. The improved reliability and mobility of service provided contributes to an improved quality of life for people living and working within the region; attracts businesses and employees to the region; and in turn supports economic growth and development.
| Resource | Environmental/Transportation/Economic Direct Effects* |
|---|---|
| Transportation (Chapter 5) |
|
| Economic Effects, Growth, and Indirect Effects (Chapter 6) |
|
| Land Cover (Chapter 7.2) |
|
| Agricultural Lands (Chapter 7.3) |
|
| Parklands and Wild and Scenic Rivers (Chapter 7.4) |
|
| Hydrologic/Water Resources (Chapter .5) |
|
| Ecological Resources (Chapter 7.6) |
|
| Geologic Resources (Chapter 7.7) |
|
| Hazardous Waste and Contaminated Materials Sites (Chapter 7.8) |
|
| Cultural Resources and Historic Properties (Chapter 7.9) |
|
| Visual and Aesthetic Resources (Chapter 7.10) |
|
| Environmental Justice (EJ) (Chapter 7.11) |
|
| Noise and Vibration (Chapter 7.12) |
|
| Air Quality (Chapter 7.13) |
|
| Energy (Chapter 7.14) |
|
| Climate Change and Adaptation (Chapter 7.15) |
|
| Section 4(f)/6(f) Resources (Chapter 7.16) |
|
| EMF/EMI (Chapter 7.17) |
|
| Safety (Chapter 7.18) |
|
| Public Health (Chapter 7.19) |
|
| Cumulative Effects (Chapter 7.20) |
|
Source: NEC FUTURE team, 2015
*Effects noted are general. If an improvement under the No Action Alternatives requires additional right-of-way, effects may occur to a greater degree for any resource.
Under the Action Alternatives, modeling predicts a decrease in regional pollutant burdens and greenhouse gases (GHG) (in terms of carbon dioxide equivalent) from roadways caused by the expected decrease in roadway vehicle-miles traveled (VMT). Likewise, there would be an increase in regional pollutant burdens and GHGs from power sources (diesel fuel and electric) because of increased train service under the Action Alternatives. The combined effect of these changes is predicted to be a reduction in emissions of all criteria pollutant burdens, with the exception of nitrogen oxides (NOx) under Alternative 3 and sulfur dioxide (SO2), under all Action Alternatives. GHG emissions would decrease under all Action Alternatives in the year 2040 due to predicted shifts in mode choice as a result of implementing any of the Action Alternatives and predicted changes in renewable energy usage.
Changes in criteria pollutants and GHGs due to bus and aircraft travel would decrease under all Action Alternatives because of the expected mode shift from aircraft and bus travel to passenger rail. Construction would result in temporary emissions of criteria pollutants and GHGs associated with construction equipment and activities.
In terms of energy usage, modeling predicts the Action Alternatives result in a decrease in energy use from roadways caused by the expected decrease in roadway VMT. Likewise, there would be an increase in energy use from power sources (e.g. diesel fuel and electric) because of increased train service under the Action Alternatives. The combined effect of these elements is predicted to reduce total energy use under all alternatives, with Alternative 3 showing the greatest decrease in energy use from the reductions in roadway VMT.
Energy use associated with bus and aircraft travel decreases under all Action Alternatives due to the mode shift from aircraft and bus travel to passenger rail. Construction of the Action Alternatives would result in non-recoverable uses of energy associated with construction equipment and activities.
Another benefit of the additional capacity, mobility, and connectivity associated with the Action Alternatives is improved access to Environmental Justice (EJ) communities along the NEC. Increased train frequencies, more connections, new locations and pricing available to travelers would provide more choices enabling people to have a greater selection and availability of jobs and services.
From a public health perspective, these improvements to air quality, energy use, and community access add up to an overall better quality of life for persons living and commuting throughout the Study Area. The temporary effects of future construction activities vary depending on the construction methods used. For example, construction activities may result in increased fugitive dust emissions, noise and vibration or light pollution that could have temporary effects on the human and natural environment. However, appropriate best management practices and mitigation measures would be employed to reduce the effects of construction.
Each Action Alternative has the potential to contribute to cumulative effects on various resources. Cumulative benefits generally include an overall improved transportation network, improved opportunities for economic development, reductions in regional pollutant burdens, increased resiliency, focused development around station areas that may limit sprawl in some areas, and benefits to EJ communities. The Action Alternatives offer benefits to freight movement by easing select chokepoints in the corridor. Cumulative impacts related to physical improvements associated with each of the Action Alternatives include contributing to dredge and fill of wetlands, habitat fragmentation, loss of forested areas, conversion of land cover from non-transportation to transportation uses, and potential effects on cultural resources and historic properties.
Table 7.1-2 provides a summary and comparison of the quantitative environmental effects identified for each of the Action Alternatives. The table identifies that total quantities of a resource potentially affected for each Action Alternative. It also shows the quantities of a resource associated with the existing NEC for context since each of these Action Alternatives includes improvements to the existing NEC. This table also presents the information for each Action Alternative between Washington, D.C., and New York City, and New York City and Boston. It does not include transportation, economic effects, air quality, energy, public health, construction, or cumulative effects since the FRA qualitatively described those effects above.
Each of the Action Alternatives also includes various improvements such as curve modifications, new segments, new track, junctions, and station areas. Generally, those improvements that are concentrated on the existing NEC, such as new track, junctions, and minor curve modifications would have similar footprint-related effects as described for the No Action Alternative in Table 7.1-1. As such, these effects do not necessarily help to differentiate the alternatives because these types of improvements would be similar across all alternatives. However, where the Action Alternatives include new segments or new stations off of the existing NEC in a new right-of-way, there would be different effects to footprint-related environmental resources, which would help to differentiate the Action Alternatives. (Chapter 4, Alternatives Considered, and Appendix A, Mapping Atlas, provide the locations of these new segments and stations.) The discussion that follows seeks to highlight the differences among the Action Alternatives, in terms of environmental impacts, by focusing on effects of new segments and new station locations for each Action Alternative since the greatest potential for effects are likely associated with those types of improvements.
| Resource | Environmental Consequences | |||||||
|---|---|---|---|---|---|---|---|---|
| Washington, D.C. to New York City | New York City to Boston | |||||||
| Existing NEC | Alt. 1 | Alt. 2 | Alt. 3 | Existing NEC | Alt. 1 | Alt. 2 | Alt. 3 | |
| Land Cover - Potential Conversion - Developed (acres) | 3,510 | 3,510 | 3,985 | 8,175 | 2,965 | 3,365 | 4,485 | 4,215-6,005 |
| Land Cover - Potential Conversion - Undeveloped (acres) | 405 | 415 | 610 | 1,675 | 1,085 | 1,390 | 2,010 | 1,525-2,440 |
| Land Cover - Potential Acquisitions - Developed (Existing NEC removed from Alts) (acres)* | - | 65 | 900 | 3,995 | - | 520 | 1,760 | 1,880-4,360 |
| Land Cover - Potential Acquisitions - Undeveloped (Existing NEC removed from Alts) (acres)* | - | 5 | 245 | 1,215 | - | 400 | 1,245 | 890-2,110 |
| Prime Farmland (acres) | 75 | 75 | 140 | 395 | 145 | 205 | 290 | 270-415 |
| Prime Timberland (acres) | 325 | 325 | 480 | 1,290 | 860 | 1,265 | 2,020 | 1,695-2,895 |
| Parklands (acres) | 45 | 45 | 95 | 295 | 390 | 480 | 525 | 470-605 |
| Wild & Scenic Rivers (acres) | 1 | 1 | 1 | 2 | 0 | 0 | 0 | 0 |
| Freshwater Wetlands (acres) | 90 | 90 | 150 | 545 | 140 | 195 | 310 | 185-425 |
| Floodplains (acres) | 450 | 455 | 680 | 1420 | 610 | 680 | 840 | 805-850 |
| Saltwater Wetlands (acres) | 55 | 75 | 100 | 190 | 145 | 180 | 195 | 205-570 |
| Coastal Zone (route miles) | 55 | 55 | 70 | 115 | 130 | 170 | 160 | 160-185 |
| ESH Terrestrial (acres) | 320 | 320 | 510 | 1,530 | 650 | 990 | 1,700 | 1,810-2,590 |
| ESH Aquatic Freshwater (acres) | 25 | 25 | 40 | 110 | 20 | 35 | 55 | 70-100 |
| ESH Aquatic Saltwater (acres) | 19 | 25 | 48 | 106 | 88 | 99 | 107 | 102-124 |
| T&E (# species in AE) | 20 | 20 | 20 | 20 | 15 | 20 | 15 | 15-24 |
| EFH (# species) | 10 | 10 | 10 | 10 | 35 | 35 | 40 | 35-40 |
| EFH (# crossings) | 5 | 10 | 10 | 10 | 30 | 35 | 40 | 35-40 |
Note: Effects shown represent the areas/number of a given resource identified within the Representative Route unless otherwise noted to be associated with the Affected Environment (AE).
* Acquisitions could result in future displacements; those displacements would be quantified only as part of a Tier 2 studies.
ESH = Ecologically Sensitive Habitat; T&E = Threatened and Endangered Species; EFH = Essential Fish Habita
| Resource | Environmental Consequences | |||||||
|---|---|---|---|---|---|---|---|---|
| Washington, D.C. to New York City | New York City to Boston | |||||||
| Existing NEC | Alt. 1 | Alt. 2 | Alt. 3 | Existing NEC | Alt. 1 | Alt. 2 | Alt. 3 | |
| Seismic Hazards (presence # counties) | 7 | 7 | 7 | 7 | 8 | 8 | 9 | 10-13 |
| Sole Source Aquifers (presence # counties) | 6 | 6 | 6 | 6 | 5 | 5 | 6 | 6-8 |
| Karst Terrain (presence # counties) | 0 | 0 | 0 | 1 | 0 | 0 | 0 | 0 |
| Naturally Occurring Asbestos (presence # counties) | 0 | 0 | 0 | 0 | 0 | 0 | 0 | 0 |
| Acid Producing Soils (presence # counties) | 13 | 13 | 13 | 13 | 1 | 1 | 1 | 1-4 |
| Landslide Susceptibility (presence # counties) | 6 | 6 | 8 | 8 | 1 | 1 | 2 | 2-4 |
| Mineral Resources - Producer (#) | 0 | 0 | 0 | 1 | 0 | 0 | 0 | 0-1 |
| Mineral Resources - Occurrence (#) | 0 | 0 | 0 | 1 | 0 | 0 | 0 | 0 |
| Mineral Resources - Plant (#) | 2 | 2 | 2 | 8 | 0 | 0 | 1 | 1 |
| Mineral Resources - Inactive Producer (#) | 0 | 0 | 1 | 2 | 2 | 2 | 4 | 2-4 |
| Active Mines (#) | 0 | 0 | 0 | 0 | 0 | 0 | 0 | 0 |
| NPL Superfund (# sites) | 0 | 0 | 0 | 0 | 0 | 0 | 0 | 0-1 |
| Brownfields (# sites) | 20 | 20 | 25 | 60 | 4 | 5 | 10 | 5-10 |
| RCRA CORRACTS (# sites) | 0 | 0 | 0 | 0 | 1 | 1 | 1 | 1 |
| RCRA Info (# sites) | 2 | 2 | 4 | 15 | 5 | 5 | 10 | 15-20 |
| RCRA TSDF (# sites) | 0 | 0 | 0 | 1 | 3 | 3 | 3 | 3 |
| State (# sites) | 25 | 25 | 40 | 85 | 30 | 35 | 50 | 50-75 |
Note: Effects shown represent the areas/number of a given resource identified within the Representative Route unless otherwise noted to be associated with the Affected Environment (AE).
NPL Superfund = National Priority List
RCRA CORRACTS = Resource Conservation and Recovery Act Corrective Actions
RCRA Info = Resource Conservation and Recovery Act Information Systems
RCRA TSDF = Resource Conservation and Recovery Act Treatment, Storage, and Disposal Facilities
State = State Databases
| Resource | Environmental Consequences | |||||||
|---|---|---|---|---|---|---|---|---|
| Washington, D.C. to New York City | New York City to Boston | |||||||
| Existing NEC | Alt. 1 | Alt. 2 | Alt. 3 | Existing NEC | Alt. 1 | Alt. 2 | Alt. 3 | |
| NHL (#) | 1 | 2 | 3 | 3 | 0 | 0 | 0 | 0-1 |
| NRHP (#) | 10 | 45 | 45 | 50 | 20 | 95 | 125 | 75-110 |
| Total Population (AE) | 2,163,341 | 2,189,633 | 2,115,989 | 2,597,112 | 2,343,994 | 2,380,100 | 2,875,380 | 3,430,234-4,059,222 |
| Minority Population (AE) | 1,301,791 | 1,323,288 | 1,277,151 | 1,505,900 | 1,154,108 | 1,161,758 | 1,337,865 | 1,493,611-1,939,703 |
| Low Income Population (AE) | 389,006 | 393,826 | 373,869 | 465,288 | 356,038 | 357,307 | 414,835 | 455,386-534,027 |
| Percent Minority (AE) | 60% | 60% | 60% | 58% | 49% | 49% | 47% | 43%-49% |
| Percent Low Income (AE) | 19% | 19% | 19% | 19% | 16% | 16% | 15% | 14% |
| EJ Tracts (AE) | 378 | 384 | 373 | 442 | 298 | 299 | 351 | 380-519 |
| Noise - severe or moderate (# counties) | N/A | 16 | 16 | 16 | N/A | 14 | 15 | 20 |
| Vibration Impact (# counties) | N/A | 1 | 5 | 9 | N/A | 2 | 8 | 19 |
| Climate Change - Total Area at Risk of Inundation (Acres)/% of total Representative Routes) | ||||||||
| Sea Level Rise (Current Climate Conditions) | 45/< 1% | 50/<1% | 105/<1% | 180/1% | 50/<1% | 90/1% | 90/<1% | 90-115/<1% |
| Storm Surge (Current Climate Conditions) | 210/< 1% | 230/3% | 460/4% | 875/5% | 470/7% | 530/7% | 550/5% | 560-620/3%-4% |
| Riverine (Current Climate Conditions) | 460/ <1% | 475/7% | 755/7% | 1,665/10% | 650/10% | 730/10% | 940/9% | 1,030-1,060/6%-7% |
| Section 6(f) (acres) | 15 | 15 | 25 | 170 | 35 | 45 | 70 | 65-75 |
Note: Effects shown represent the areas/number of a given resource identified within the Representative Route unless otherwise noted to be associated with the Affected Environment (AE).
NHL = National Historic Landmark
NRHP = National Register of Historic Places
AE = Affected Environment
EJ = Environmental Justice
Alternative 1 provides improvements focused on the existing NEC that result in greater capacity, thus benefitting the transportation network as a whole along the entirety of the existing NEC. The total number of rail passenger trips increases by approximately 16 percent under Alternative 1 over the No Action.
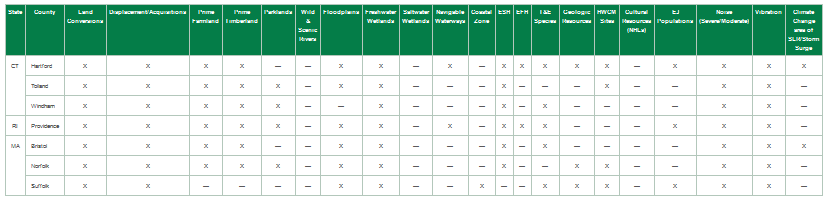
Many of the improvements associated with Alternative 1 would have similar types of effects as described for the No Action Alternative. However, Alternative 1 proposes four new segments parallel to and outside of the existing NEC right-of-way. Table 7.1-3 summarizes the effects associated with those improvements. (Appendix E provides additional detail on all effects by state and county identified for Alternative 1 under the various resource sections.)
Connecticut and Rhode Island would bear the greatest negative environmental effects under Alternative 1. This is due to the Stamford and Old Saybrook-Kenyon segments. The Old Saybrook-Kenyon segment is approximately 50 miles in length and traverses New London County, CT, and Washington County, RI. Improvements along this segment would result in notable effects, including impacts to numerous water resources, ecological resources, prime farmland soils, and prime timberlands; additionally, these effects would occur in the coastal area, which could be inconsistent with policies that support adherence to the Coastal Zone Management Act. More than 250 acres of floodplain impacts and more than 60 acres of saltwater wetland impacts would occur in New London County. New London County has the greatest potential for acquisitions and displacements. Approximately 60 acres of freshwater wetland impacts would occur in Washington County, RI. The climate change analysis indicates that both New London and Washington Counties are subject to increased risk of inundation for the near-term (mid-century) climate conditions. New London County in particular is subject to an increased risk of sea level rise flooding, coastal storm surge flooding and riverine flooding. Washington County, RI, is primarily at risk for riverine flooding. However, when compared to the equivalent portion of the existing NEC, the Old Saybrook-Kenyon segment provides for redundancy and adds resiliency benefits from risks associated with coastal storm surge and riverine flooding.
The Stamford segment also occurs in Connecticut. This segment is considerably shorter than the Old Saybrook-Kenyon segment and is primarily located in Fairfield County. Fairfield County has concentrations of water and ecological resources. Fairfield County also has a high potential for acquisitions and displacements. Of particular note is that Fairfield County has Environmental Justice (EJ) populations. Finally, this segment is in an area faced with a risk of inundation for the near-term (mid-century) climate scenario for sea level rise, coastal storm surge, and riverine flooding.
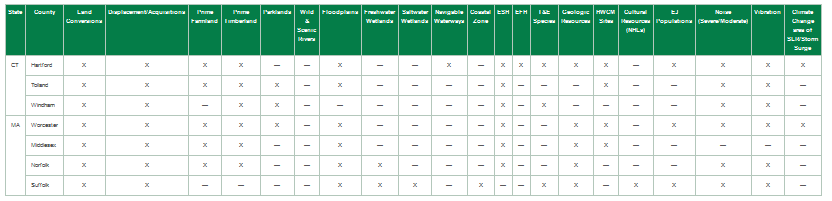
Alternative 2 provides improvements focused on the existing NEC that result in greater capacity and also provides a new inland corridor in CT between New Haven and Providence via Hartford. The total number of passenger rail trips increases by approximately 21 percent over the No Action Alternative.
Alternative 2 includes 11 new segments, parallel to and outside of the existing NEC right-of-way. Table 7.1-3 summarizes the effects. These segments are dispersed throughout and closely aligned to the existing NEC with the exception of the New Haven-Hartford-Providence segment. This segment goes through areas that are much less developed and rural. While development exists around New Haven, Hartford, and Providence, in between these cities are stretches of undeveloped land. As such, effects on environmental resources would be high throughout the counties of Fairfield, New Haven, Hartford, Tolland, and Windham Counties, CT, and Providence, RI. Of particular concern are high acreages of impacts to prime timberlands in Tolland and Windham Counties, CT, and Washington and Providence Counties, RI. Combined, more than 1,000 acres of prime timberland would be affected in these counties. New London, New Haven, and Hartford Counties, CT, would have more than 500 acres of floodplain affected by the New Haven-Hartford-Providence segment. However, when compared to the equivalent portion of the existing NEC, this new segment provides for redundancy and adds resiliency benefits from risks associated with coastal storm surge and riverine flooding.
Alternative 2 would result in high acreages of prime farmland and timberland impacts along a new segment in Cecil County, MD, and along the existing NEC in New London County, CT, and Washington County, RI. Alternative 2 would also result in acquisitions and potential displacements. The greatest acreage of possible acquisitions for Alternative 2 would occur in Fairfield, New Haven, and Hartford Counties, CT-all of which are noted to have EJ populations. Alternative 2 is the only Action Alternative to bisect the John Heinz National Wildlife Refuge for 1.5 miles on the southeastern edge in Delaware and Philadelphia, PA, which is ecologically sensitive and located within a coastal zone. The potential impacts to the park include land acquisition and conversion, visual and noise effects, and habitat fragmentation.
Alternative 3 provides improvements focused on the existing NEC that result in greater capacity and provides a new second spine between Washington, D.C., and Boston. The second spine generally runs parallel to the existing NEC between Washington, D.C., and New York City; however, north of New York City variations in routing exist for the second spine. These variations, or route options, reach new markets such as Hartford, CT, Long Island, NY, and Worcester, MA. The new markets create greater potential for induced growth indicated by the station area development. The potential economic-related construction effect is highest with Alternative 3 with 3,534,160 construction jobs (average across route options), providing a one-time stimulus to the economy. With any of the variations of Alternative 3, there are approximately 32 percent more total passenger rail trips over the No Action Alternative. Alternative 3 provides excess capacity at all locations along the corridor to accommodate additional off-corridor trips and future growth post 2040. The second spine increases redundancy and resiliency compared to the existing NEC with a lower percentage of the Representative Route at risk from riverine and storm surge flooding.
However, Alternative 3 has the greatest impact to Ecologically Sensitive Habitat (ESH), with Maryland, Connecticut, and Massachusetts each containing 29 individual areas affected.
The effects of Alternative 3 are presented in segments as follows: Washington, D.C., to New York City; New York City to Hartford; and Hartford to Boston. Tables 7.1-5 through 7.1-9 summarize the effects for each section of Alternative 3.
Washington, D.C., to New York City
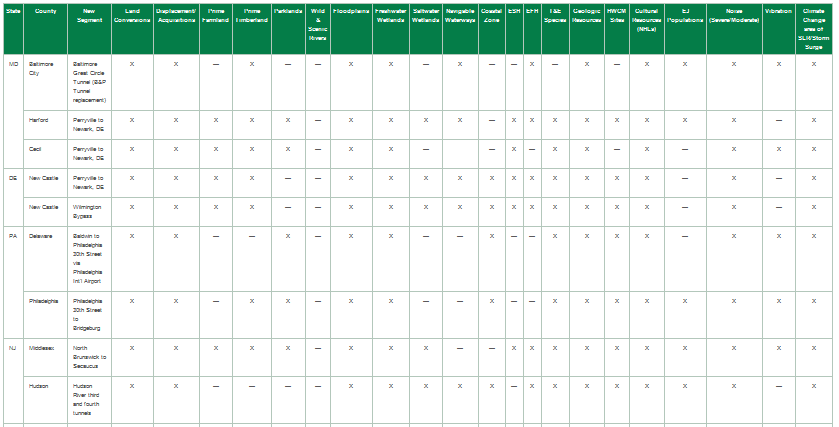
To complete a second spine, additional right-of-way would be required. Between Washington, D.C., and New York City, acquisitions and displacements would be greatest in Baltimore County, Baltimore City, and Harford County, MD; New Castle County, DE; Philadelphia and Bucks County, PA; and Middlesex County, NJ. All of these counties are noted as having EJ populations. Anne Arundel and Harford Counties, MD, would have more than 300 acres of floodplain effects. New Castle, DE, would have more than 200 acres of floodplain effects. Middlesex and Hudson Counties, NJ, would have more than 250 acres of affected floodplain, and Hudson County would have more than 100 acres of saltwater wetlands that would be affected. Cecil County, MD, would have high acreages of both prime farmland soils and prime timberlands affected and Middlesex County would also have high acreages of prime farmland affected. New Castle, DE, would also have a high acreage of prime timberlands affected.
New York City to Hartford
Via Central Connecticut
Westchester, NY, and New Haven and New London, CT, combined would have more than 650 acres of impact to prime timberlands. The greatest acreage of potential acquisitions would occur in Fairfield, CT. This route option would have considerably fewer impacts to water resources than the Long Island route option particularly with regards to wetlands. New London County would have more than 230 acres of floodplain affected. High concentrations of hazardous waste and contaminated material sites are located in Fairfield, CT.
Via Long Island
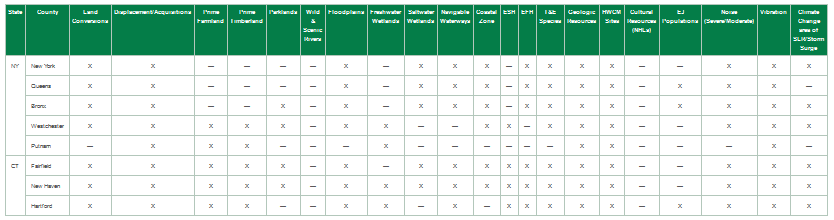
More than 500 acres of acquisitions of developed land would occur in Suffolk County, NY, and more than 400 acres of acquisitions of developed land would occur in New Haven, CT. The highest acreages of prime farmland affected would occur in Suffolk County, NY, and New Haven County, CT, as well. In New London, New Haven, and Hartford, CT, there would be almost 600 acres of prime timberland affected. Two Section 6(f) resources could be affected. More than 200 acres of floodplain impact would occur in New London. There is the potential for high ecological resource impact, particularly saltwater ESH, Essential Fish Habitat, and federally listed Threatened and Endangered species in Suffolk County, NY, and the associated Long Island Sound. Saltwater wetland impacts, totaling more than 400 acres, would occur with this route option, with the majority of those impacts occurring in Suffolk County, NY. The impact to wetlands is nearly three times the number of acres of wetlands compared to the Central Connecticut route option and would traverse through 20 percent more route miles of coastal zone.
Via Providence
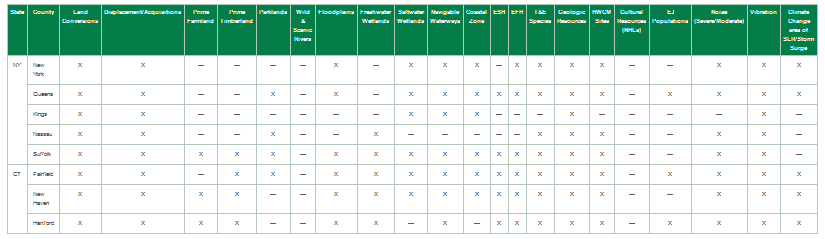
This route option would have high acreages of prime timberland impacts in almost every county it traverses. Windham, CT; Washington, RI; and Norfolk, MA, would have more than 300 acres each of prime timberland impacts. Along the existing NEC, high acreages of prime farmland and prime timberland affected would occur in Washington County, RI. One National Historic Landmark identified north of New York, the John B. Smith Building adjacent to Fenway Park in Suffolk, MA, would be affected under this segment of Alternative 3. Two Section 6(f) resources could be converted to non-recreational uses.
This route option would affect 10 percent fewer acres of Special Flood Hazard Areas compared to the Worcester route option; however, there are approximately 35 percent more wetlands and nearly four times as many route miles of coastal zone would be traversed.
Via Worcester
This route option would also encounter high acreages of prime timberland, primarily in Washington, RI, and Worcester, MA, as well as high acreages of prime farmland along the new segment in Worcester County, MA. It would also affect the one National Historic Landmark identified north of New York-the John B. Smith Building adjacent to Fenway Park in Suffolk, MA.
Table 7.1-3: Summary of Environmental Effects for New Segments (Alternative 1)
Table 7.1-4: Summary of Environmental Effects by New Segment (Alternative 2)
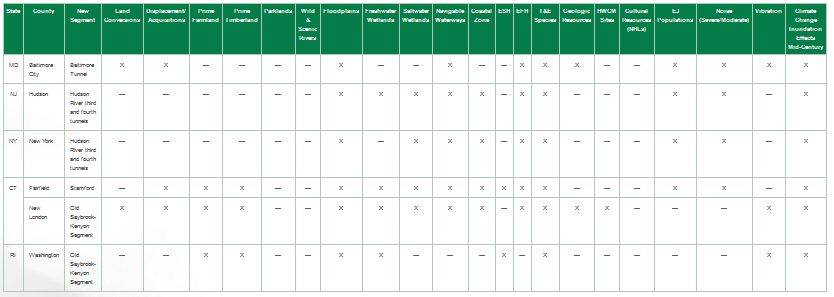
Table 7.1-5: Summary of Environmental Effects by New Segment (Alternative 3 - Washington, D.C., to New York City)
Table 7.1-6: Summary of Environmental Effects by New Segment (Alternative 3 - New York City to Hartford via Central Connecticut)
Table 7.1-7: Summary of Environmental Effects by New Segment (Alternative 3 - New York City to Hartford via Long Island)
Table 7.1-8: Summary of Environmental Effects by New Segment (Alternative 3 - Hartford to Boston via Providence)
Table 7.1-9: Summary of Environmental Effects by New Segment (Alternative 3 - Hartford to Boston via Worcester)
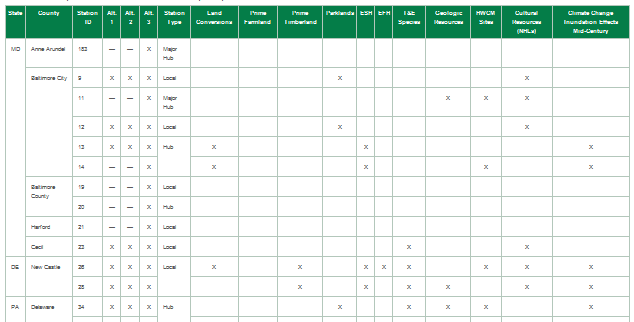
Station effects would be localized, with the greatest potential effects occurring at new station locations. Table 7.1-10 summarizes the effects for new stations by county. Impacts and areas of concern related to stations are similar to those documented for the Representative Route impacts for each Action Alternative. Station locations are approximate and would be refined and modified as part of subsequent environmental analysis. Station effects could be expected to the following resources:
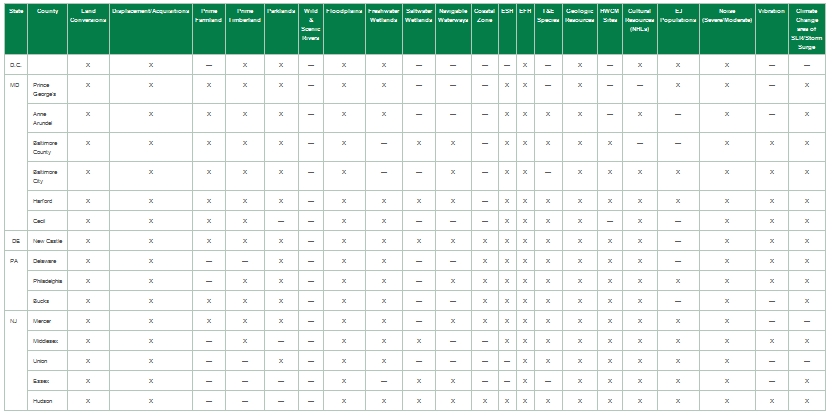
Table 7.1-10: Summary of Environmental Effects for New Stations by County for Action Alternatives
The information posted on this website includes hypertext links or pointers to information created and maintained by other public and/or private organizations. The FRA provides these links and pointers solely for information and convenience. When users select a link to an outside website, they are leaving the NEC FUTURE website and are subject to the privacy and security policies of the owners/sponsors of the outside website. The FRA does not control or guarantee the accuracy, relevance, timeliness or completeness of information contained on a linked website, or endorse the organizations sponsoring linked websites, the views they express, or the products/services they offer. The FRA cannot authorize the use of copyrighted materials contained in linked websites and is not responsible for transmissions users receive from linked websites.
 View full-sized table in new window