Table of Contents
Air quality describes the level of contaminants in the air. Air pollution is a general term that refers to one or more chemical substances that degrade the quality of the atmosphere. Individual air pollutants degrade the atmosphere by reducing visibility, damaging property, reducing the productivity or vigor of crops or natural vegetation, and/or harming human or animal health.
Human activity affects ambient air quality via production of air pollutants, including emissions by mobile and stationary sources. Mobile-source emissions refer to emissions from transportation sources. Stationary source emissions refer to emissions from fixed facilities. The No Action Alternative and Action Alternatives could affect air emissions and greenhouse gas (GHG) emissions-and thus air quality-via operational changes in the following:
The summation of these changes will reflect the overall impact of the Action Alternatives on the following:
The Clean Air Act (CAA), as amended, is the basis for most federal air pollution control programs. The U.S. Environmental Protection Agency (EPA), under the CAA, regulates air quality nationally. Under the authority of the CAA, the EPA established a set of National Ambient Air Quality Standards (NAAQS) for various "criteria" air pollutants.
The CAA requires states to develop a general plan to attain and maintain the NAAQS in all areas of the country and a specific plan (State Implementation Plan or SIP) to attain the standards for each area that the EPA has designated nonattainment for an NAAQS. State and local air quality management agencies develop these SIPs and then submitted them to the EPA for approval.
The SIPs serve two main purposes:
In addition, Congress recognized in the Clean Air Act Amendments of 1990 (CAAA) that the more densely populated Northeast states share the same airshed, as well as emissions sources and commuting patterns. To regionally address air quality in the Northeast, Congress created the Ozone Transport Region (OTR)-an area from Maine to Northern Virginia. States in the OTR are required to implement additional control measures that apply across the region, whether an area in the OTR is attainment or nonattainment.
This air quality analysis follows guidance from the Federal Railroad Administration (FRA) and the EPA, as well as applicable state agencies. The analysis considers existing conditions in the Study Area, as well as the potential negative and positive impacts of the program on regional air quality. This analysis calculates potential regional pollutant burdens caused by changes in regional passenger VMT and train-miles traveled under the Action Alternatives. The FRA calculated vehicle emission factors using the EPA's MOVES2010b mobile-source emissions modeling program, which estimates emissions and GHGs for mobile sources. MOVES2010b was run using state-specific national level runs of EPA's MOVES2010b, as the VMT data were generated on a statewide basis. It should be noted that the EPA has recently released MOVES2014. There is a two-year grace period before MOVES2014 is required to be used in a transportation conformity analysis. This grace period began on October 7, 2014. Any Tier 2 studies requiring transportation conformity analysis conducted after October 7, 2016, would be required to use MOVES2014.
The FRA calculated potential regional pollutant burdens of the trains based on changes in train vehicle-miles (average energy requirements of passenger trains) as detailed in the Transportation Energy Data Book (Edition 33), and pollutant emission rates for the project area (as detailed in the EPA's egrid database and state-specific regulations and goals pertaining to future energy mixes). The FRA analyzed the changes in emission burdens caused by the Action Alternatives relative to the No Action Alternative, rather than separate baseline emissions burdens associated with each Alternative (the No Action and Action Alternatives). This variation in how emission burdens were calculated was a result of the service data being presented as changes between the No Action and Action Alternatives rather than separate service data for the No Action and Action Alternatives.
The FRA assumed that the emissions generated to supply power to the Action Alternatives occur in the same state as the portion of the Action Alternatives being studied. Since the electrical system is a grid, there is a chance that the power supplier could be out of state and that the emissions are not actually occurring in the state that requires the power. However, for this study the FRA assumed that the emissions are generated in the state that requires the power since the eGRID emission factors are available on a state-by-state basis. The FRA has qualitatively analyzed the air quality impacts caused by changes in local traffic, bus and air travel, and construction. Table 7.13-1 summarizes key factors associated with the methodologies for each air quality resource evaluated.
The FRA did not make any conformity determinations as part of this Tier 1 Draft EIS; conformity determinations would be made as part subsequent Tier 2 analysis as appropriate.
| Resource | Affected Environment | Type of Assessment | Outcome |
|---|---|---|---|
| Criteria Pollutants | Ambient air monitoring data by counties along the Representative Route of each Action Alternative | Quantitative: µg/m3 and/or parts per million |
Identification of air quality monitoring locations along the Representative Route of each Action Alternative. |
| Sources of pollutants in the area along the Representative Route of each Action Alternative | Qualitative: Major source of pollutant |
Identification of major source of criteria pollutant by county. | |
| Attainment Status - Counties along the Representative Route of each Action Alternative | Qualitative: Designation as attainment, nonattainment or maintenance |
Identification of nonattainment and maintenance areas along the Representative Route of each Action Alternative. | |
| Criteria pollutants, greenhouse gases | Train VMT - Rail lines within the Northeast Corridor | Quantitative: Tons of pollutants |
Criteria pollutant changes caused by rail operations. |
| Criteria pollutants, mobile-source air toxics | Areas around station locations | Qualitative: discussion |
Qualitative assessment of potential local impacts. |
| Criteria pollutants, mobile-source air toxics, greenhouse gases | Regional traffic along the Representative Route of each Action Alternative | Quantitative: Tons of pollutants |
Criteria pollutant and greenhouse gas pollutant changes due to passenger car vehicle mile travel changes. |
| Bus and air travel within NEC region | Qualitative: discussion |
Qualitative assessment of potential changes in bus and air travel. | |
| Construction Activities | Qualitative: discussion |
Qualitative discussion of air quality impacts during construction. |
Source: NEC FUTURE team, Air Quality Effects-Assessment Methodology, Appendix E, Section E.13, 2014
The EPA is responsible for establishing the NAAQS and enforcing the CAA. The agency also regulates emission sources-such as aircraft, ships, and certain types of locomotives-under the exclusive authority of the federal government. The CAA directs the EPA to implement environmental policies and regulations that will ensure acceptable levels of air quality. Under the CAA, a project cannot do the following:
As required by the CAA, the EPA has established NAAQS for six major air pollutants: carbon monoxide (CO), nitrogen dioxide (NO2), ozone (O3), particulate matter (PM), sulfur dioxide (SO2), and lead (Pb). NO2 is one of a group of highly reactive gases known as "oxides of nitrogen," or "nitrogen oxides (NOx )." Other NOx include nitrous acid and nitric acid. The EPA's NAAQS uses NO2 as the indicator for the larger group of NOx . For this study, a 100 percent conversion rate of NOx to NO2 was conservatively assumed, and all NOx emissions are referred to as NO2 emissions.
Table 7.13-2 summarizes these standards, and further information about these "criteria pollutants" is given later in this section. The EPA established "primary" standards to protect the public health and "secondary" standards to protect the nation's welfare and account for air pollutant effects on soil, water, visibility, materials, vegetation and other aspects of the general welfare.
Pollutants traced principally to mobile sources and power generation are relevant to the evaluation of the each Action Alternative's impacts. These pollutants include CO, hydrocarbons (HC), NOx , O3, PM less than 10 microns (PM10) and less than 2.5 microns (PM2.5), SOx, and mobile-source air toxics (MSAT). HC and NOx emissions are a concern primarily because they are precursors in the formation of O3 and PM. O3 forms through a series of reactions that occur in the atmosphere in the presence of sunlight. Since the reactions are slow and occur as the pollutants are diffusing downwind, elevated O3 levels often occur many miles from the sources of the precursor pollutants. Therefore, the effects of HC and NOx emissions are generally examined on a regional or "mesoscale" basis. PM10 and PM2.5 impacts are both regional and local. CO impacts are generally localized. Even under the worst meteorological conditions and most congested traffic conditions, high concentrations are limited to a relatively short distance (300 to 600 feet) of heavily traveled roadways.1 Vehicle emissions are the major sources of CO.
| Pollutant | Primary / Secondary | Averaging Time | Level | Form | |
|---|---|---|---|---|---|
| Carbon Monoxide | Primary | 8 hours | 9 ppm | Not to be exceeded more than once per year | |
| 1 hours | 35 ppm | ||||
| Lead | Primary and Secondary | Rolling 3-month average | 0.15 µg/m3 (1) | Not to be exceeded | |
| Nitrogen Dioxide | Primary | 1 hour | 100 ppb | 98th percentile, averaged over 3 years | |
| Primary and Secondary |
Annual | 53 ppb (2) | Annual Mean | ||
| Ozone | Primary and Secondary |
8 hours | 0.075 ppm (3) | Annual fourth-highest daily maximum 8-hr concentration, averaged over 3 years | |
| Particle Pollution | PM2.5 | Primary | Annual | 12 µg/m3 | Annual mean, averaged over 3 years |
| Secondary | Annual | 15 µg/m3 | Annual mean, averaged over 3 years | ||
| Primary and secondary | 24 hours | 35 µg/m3 | 98th percentile, averaged over 3 years | ||
| PM10 | Primary and Secondary |
24 hours | 150 µg/m3 | Not to be exceeded more than once per year on average over 3 years | |
| Sulfur Dioxide | Primary | 1-hour | 75 ppb (4) | 99th percentile of 1-hour daily maximum concentrations, averaged over 3 years | |
| Secondary | 3 hours | 0.5 ppm | Not to be exceeded more than once per year | ||
Source: EPA Office of Air and Radiation. Accessed August 2015 at http://www.epa.gov/air/criteria.html
(1) Final rule signed October 15, 2008. The 1978 lead standard (1.5 µg/m3 as a quarterly average) remains in effect until one year after an area is designated for the 2008 standard, except that in areas designated nonattainment for the 1978, the 1978 standard remains in effect until implementation plans to attain or maintain the 2008 standard are approved.
(2) The official level of the annual NO2 standard is 0.053 ppm, equal to 53 ppb, which is shown here for the purpose of clearer comparison to the 1-hour standard.
(3) Final rule signed March 12, 2008. The 1997 ozone standard (0.08 ppm, annual fourth-highest daily maximum 8-hour concentration, averaged over 3 years) and related implementation rules remain in place. In 1997, the EPA revoked the 1-hour ozone standard (0.12 ppm, not to be exceeded more than once per year) in all areas, although some areas have continued obligations under that standard ("anti-backsliding"). The 1-hour ozone standard is attained when the expected number of days per calendar year with maximum hourly average concentrations above 0.12 ppm is less than or equal to 1.
(4) Final rule signed June 2, 2010. The 1971 annual and 24-hour SO2 standards were revoked in that same rulemaking. However, these standards remain in effect until one year after an area is designated for the 2010 standard, except in areas designated nonattainment for the 1971 standards, where the 1971 standards remain in effect until implementation plans to attain or maintain the 2010 standard are approved.
ppm = parts per million
ppb = parts per billion
MSAT impacts are both regional and local. Through the issuance of the EPA's Final Rule regarding emission Control of Hazardous Air Pollutants from Mobile Sources [66 FR 17229], it was determined that many existing and newly promulgated mobile-source emission control programs would reduce MSATs. The EPA examined the impacts of existing and newly promulgated mobile-source control programs, including its reformulated gasoline program, its national low-emission-vehicle standards, its Tier 2 motor-vehicle emissions standards, and gasoline sulfur control requirements, its proposed heavy-duty engine and vehicle standards, and its on-highway diesel-fuel requirements. Future emissions would likely be lower than present levels as a result of the EPA's national control programs, which are projected to reduce MSAT emissions by 83 percent from 2010 to 2050, even if VMT increases by 102 percent.
The FRA analyzed greenhouse gases (GHG) on a regional scale. CO2 makes up the largest anthropogenic component of GHG emissions. Other prominent transportation GHGs include methane (CH4) and NOx . To date, no national standards have been established regarding GHGs, nor has the EPA established criteria or thresholds for ambient GHG emissions pursuant to its authority to establish motor-vehicle emission standards for CO2 under the CAA.
As noted earlier, pollutants that have established national standards are referred to as "criteria pollutants." The sources of these pollutants, their effects on human health and the nation's welfare, and their final deposition in the atmosphere vary considerably. A brief description of each pollutant is provided below.
Ozone (O3) is a colorless toxic gas. O3 is found in both the Earth's upper and lower atmospheric levels. In the upper- atmosphere, O3 is a naturally occurring gas that helps to prevent the sun's harmful ultraviolet rays from reaching the Earth. In the lower layer of the atmosphere, O3 forms mostly through human activity. O3 is not directly emitted into the atmosphere; it forms in the lower atmosphere through a chemical reaction between HC-also referred to as volatile organic compounds (VOC)-and NOx . O3 is the main ingredient of smog. O3 enters the bloodstream through the respiratory system and interferes with the transfer of oxygen, depriving sensitive tissues in the heart and brain of oxygen. O3 also damages vegetation by inhibiting its growth.
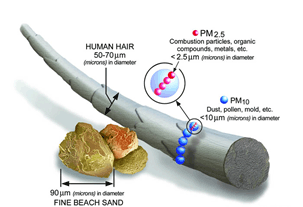
Figure 7.13-1 : Relative Particulate Matter Size
Source: U.S. Environmental Protection Agency, 2013
Particulate Matter (PM) pollution is a complex mixture of extremely small particles and liquid droplets. Particle pollution is made up of a number of components, including acids (such as nitrates and sulfates), organic chemicals, metals, and soil or dust particles. The size of particles is directly linked to their potential for causing health problems. The EPA is concerned about particles that are 10 microns (PM10), 2.5 microns (PM2.5), or smaller in diameter (Figure 7.13-1. because those are the particles that generally pass through the throat and nose and enter the lungs. Once inhaled, these particles can affect the heart and lungs and cause serious health effects. PM can penetrate the human respiratory system's natural defenses and damage the respiratory tract when inhaled. Whereas particles 2.5 to 10 microns in diameter tend to collect in the upper portion of the respiratory system, particles 2.5 microns or less are so tiny that they can penetrate deeper into the lungs and damage lung tissues.
CO, a colorless gas, interferes with the transfer of oxygen to the brain. CO is emitted almost exclusively from the incomplete combustion of fossil fuels. Prolonged exposure to high levels of CO can cause headaches, drowsiness, loss of equilibrium, or heart disease. CO concentrations can vary greatly over relatively short distances. Relatively high concentrations of CO are typically found near congested intersections, along heavily used roadways carrying slow-moving traffic, and in areas where atmospheric dispersion is inhibited by urban "street canyon" conditions.
NO2, a brownish gas, irritates the lungs. It can cause breathing difficulties at high concentrations. Like O3, NO2 is not directly emitted, but is formed through a reaction between nitric oxide (NO) and atmospheric oxygen. NO and NO2 are collectively referred to as NOx and are major contributors to O3 formation. NO2 also contributes to the formation of PM10. Other NOx include nitrous acid and nitric acid. The EPA's NAAQS uses NO2 as the indicator for the larger group of NOx .
Pb is a stable element that persists and accumulates both in the environment and in animals. Its principal effects in humans are on the blood-forming, nervous, and renal systems. Lead levels in the urban environment from mobile sources have significantly decreased because of the federally mandated switch to lead-free gasoline.
SO2 is a product of high-sulfur fuel combustion. The main sources of SO2 are coal and oil used in power stations and industry, as well as domestic heating. Industrial chemical manufacturing is another source of SO2, which is an irritant gas that attacks the throat and lungs. It can cause acute respiratory symptoms and diminished ventilator function in children. SO2 can also yellow plant leaves and erode iron and steel. SO2 is also a precursor to particulate formation. SO2 is the component of greatest concern and is used as the indicator for the larger group of gaseous sulfur oxides (SOx). Other gaseous sulfur oxides (e.g. SO3) are found in the atmosphere at concentrations much lower than SO2.
As required by the CAA, the EPA publishes a list of all geographic areas in compliance and not attaining the NAAQS (nonattainment areas) for each criteria pollutant. Areas that have insufficient data to make a determination are deemed unclassified, and are treated as being attainment areas until proven otherwise. Maintenance areas were previously designated as nonattainment for a particular pollutant but have since demonstrated compliance with the NAAQS for that pollutant. An area's designation is based on the data collected by the state monitoring network on a pollutant-by-pollutant basis. Table 7.13-3 lists all counties within the Affected Environment and identifies those that are nonattainment or maintenance for at least one pollutant. Table 7.13-4 lists the major sources of these pollutants. Appendix E, Section E.13, contains detailed ambient air quality monitoring data for the Study Area and attainment status information as well as current and future energy profiles.
| Geography | County | Attainment Status: Nonattainment or Maintenance for at least one criteria pollutant? |
|||
|---|---|---|---|---|---|
| Existing NEC | Alternative 1 | Alternative 2 | Alternative 3 | ||
| D.C. | Yes | Yes | Yes | Yes | |
| MD | Prince George's | Yes | Yes | Yes | Yes |
| Anne Arundel | Yes | Yes | Yes | Yes | |
| Baltimore City | Yes | Yes | Yes | Yes | |
| Baltimore County | Yes | Yes | Yes | Yes | |
| Harford | Yes | Yes | Yes | Yes | |
| Cecil | Yes | Yes | Yes | Yes | |
| DE | New Castle | Yes | Yes | Yes | Yes |
| PA | Delaware | Yes | Yes | Yes | Yes |
| Philadelphia | Yes | Yes | Yes | Yes | |
| Bucks | Yes | Yes | Yes | Yes | |
| NJ | Mercer | Yes | Yes | Yes | Yes |
| Middlesex | Yes | Yes | Yes | Yes | |
| Union | Yes | Yes | Yes | Yes | |
| Essex | Yes | Yes | Yes | Yes | |
| Hudson | Yes | Yes | Yes | Yes | |
| NY | New York | Yes | Yes | Yes | Yes |
| Queens | Yes | Yes | Yes | Yes | |
| Kings | - | - | Yes | Yes | |
| Nassau | - | - | - | Yes | |
| Suffolk | - | - | - | Yes | |
| Bronx | Yes | Yes | Yes | Yes | |
| Putnam | - | - | - | No | |
| Westchester | Yes | Yes | Yes | Yes | |
| CT | Fairfield | Yes | Yes | Yes | Yes |
| New Haven | Yes | Yes | Yes | Yes | |
| Middlesex | Yes | Yes | Yes | Yes | |
| New London | Yes | Yes | Yes | Yes | |
| Hartford | - | - | Yes | Yes | |
| Tolland | - | - | Yes | Yes | |
| Windham | - | - | Yes | Yes | |
| RI | Washington | No | No | No | No |
| Kent | No | No | No | No | |
| Providence | No | No | No | No | |
| MA | Bristol | No | No | - | No |
| Norfolk | Yes | Yes | Yes | Yes | |
| Suffolk | Yes | Yes | Yes | Yes | |
Source: U.S. Environmental Protection Agency, December 2014
- = County is not in the Affected Environment for the alternative.
| Geography | County | CO | VOC | NOx | PM10 | PM2.5 | SO2 |
|---|---|---|---|---|---|---|---|
| D.C. | Mobile | Solvent | Mobile | Dust | Fuel combustion | Fuel combustion | |
| MD | Prince George's | Mobile | Biogenics | Mobile | Dust | Fuel combustion | Fuel combustion |
| Anne Arundel | |||||||
| Baltimore City | Solvent | ||||||
| Baltimore County | Mobile | ||||||
| Harford | Biogenics | Mobile | |||||
| Cecil | |||||||
| DE | New Castle | Mobile | Mobile | Mobile | Dust | Fuel combustion | Fuel combustion |
| PA | Delaware | Mobile | Mobile | Mobile | Dust | Fuel combustion | Fuel combustion |
| Philadelphia | Solvent | ||||||
| Bucks | Mobile | ||||||
| NJ | Mercer | Mobile | Biogenics | Mobile | Dust | Fuel combustion | Fuel combustion |
| Middlesex | Mobile | ||||||
| Union | Mobile | ||||||
| Essex | Solvent | Fuel combustion | |||||
| Hudson | Fuel combustion | ||||||
| NY | New York | Mobile | Solvent | Mobile | Fuel combustion | Fuel combustion | Fuel combustion |
| Queens | |||||||
| Kings | Dust | Mobile | |||||
| Nassau | Mobile | Fuel combustion | |||||
| Suffolk | |||||||
| Bronx | Solvent | Mobile | |||||
| Putnam | Biogenics | Dust | |||||
| Westchester | Mobile | Fuel combustion | |||||
| CT | Fairfield | Mobile | Mobile | Mobile | Dust | Fuel combustion | Fuel combustion |
| New Haven | |||||||
| Middlesex | Biogenics | ||||||
| New London | |||||||
| Hartford | Mobile | ||||||
| Tolland | Biogenics | ||||||
| Windham | |||||||
| RI | Washington | Mobile | Biogenics | Mobile | Dust | Fuel combustion | Fuel combustion |
| Kent | |||||||
| Providence | |||||||
| MA | Bristol | Mobile | Biogenics | Mobile | Dust | Dust | Fuel combustion |
| Norfolk | Mobile | Fuel combustion | |||||
| Suffolk | Solvent |
Source: U.S. Environmental Protection Agency, 2015
As shown in Table 7.13-3, almost every county within the Affected Environment of the existing NEC is nonattainment or maintenance for at least one pollutant. However, all counties in Rhode Island are in attainment for all criteria pollutants.
Since there are no new counties within the Affected Environment of Alternative 1 as compared to the Affected Environment of the existing NEC, the nonattainment and maintenance areas are the same for counties within the Affected Environment of the existing NEC and Alternative 1.
Almost every county within the Affected Environment of Alternative 2 is nonattainment or maintenance for at least one pollutant. However, all counties in Rhode Island are attainment for all criteria pollutants.
Washington, D.C., to New York City
Every county within the Affected Environment for Alternative 3 between Washington, D.C., and New York City is nonattainment or maintenance for at least one criteria pollutant.
New York City to Hartford
Via Central Connecticut
This route includes Putnam County, NY, which is not nonattainment or maintenance for at least one pollutant (and therefore attainment for all criteria pollutants).
Via Long Island
This route includes Nassau and Suffolk Counties, NY, both of which are nonattainment or maintenance for at least one criteria pollutant.
Hartford to Boston
Via Providence
Most counties in Connecticut and Massachusetts within the Affected Environment for Alternative 3 are designated as nonattainment or maintenance areas for at least one criteria pollutant. Counties in Rhode Island are in attainment for all criteria pollutants.
Via Worcester
Most counties in Connecticut and Massachusetts within the Affected Environment for Alternative 3 are designated as nonattainment or maintenance areas for at least one criteria pollutant. Counties in Rhode Island are in attainment for all criteria pollutants.
7.13.3.2 Environmental Consequences
The FRA's modeling predicts a decrease in regional pollutant burdens from roadways due to the expected decrease in roadway VMT (autos) and an increase in regional pollutant burdens from power sources (diesel fuel and electric) because of increased train service under the Action Alternatives. As shown in Table 7.13-5, the combined (net) effect of these elements is a predicted decrease in all criteria pollutant burdens, with the exception of NOx under Alternative 3 (via Central Connecticut/Providence, and via Long Island / Providence and Worcester) and SO2 under all Action Alternatives.
| Pollutant | Project Element | Alternative 1 | Alternative 2 | Alternative 3 | |||
|---|---|---|---|---|---|---|---|
| via Central CT / Providence | via Long Island / Providence | via Long Island / Worcester | via Central CT / Worcester | ||||
| CO | Roadways | -2,495 | -3,375 | -3,725 | -3,520 | -3,850 | -3,635 |
| Diesel Trains | -1 | -25 | 0 | 1 | 1 | 1 | |
| Electric Trains | 15 | 30 | 50 | 55 | 55 | 35 | |
| TOTAL | -2,480 | -3,375 | -3,675 | -3,465 | -3,800 | -3,605 | |
| VOC | Roadways | -35 | -45 | -50 | -45 | -50 | -50 |
| Diesel Trains | -1 | -1 | 0 | 1 | 1 | 1 | |
| Electric Trains | 2 | 3 | 5 | 5 | 5 | 3 | |
| TOTAL | -30 | -45 | -45 | -40 | -45 | -45 | |
| NOx | Roadways | -165 | -225 | -250 | -235 | -255 | -240 |
| Diesel Trains | -1 | -30 | 0 | 1 | 1 | 1 | |
| Electric Trains | 90 | 170 | 270 | 275 | 285 | 180 | |
| TOTAL | -75 | -80 | 20 | 40 | 30 | -60 | |
| PM10 | Roadways | -40 | -50 | -60 | -55 | -60 | -55 |
| Diesel Trains | -1 | -1 | 0 | 1 | 1 | 1 | |
| Electric Trains | 10 | 15 | 25 | 25 | 25 | 15 | |
| TOTAL | -30 | -35 | -30 | -30 | -35 | -40 | |
| PM2.5 | Roadways | -15 | -25 | -25 | -25 | -25 | -25 |
| Diesel Trains | 0 | -1 | 0 | 1 | 1 | 1 | |
| Electric Trains | 5 | 15 | 20 | 20 | 20 | 15 | |
| TOTAL | -10 | -10 | -4 | -3 | -4 | -10 | |
| SO2 | Roadways | -5 | -10 | -10 | -10 | -10 | -10 |
| Diesel Trains | -1 | -1 | 0 | 1 | 1 | 1 | |
| Electric Trains | 180 | 350 | 555 | 565 | 600 | 385 | |
| TOTAL | 170 | 340 | 545 | 555 | 590 | 375 | |
Source: NEC FUTURE team, 2015renewable energy targets are expected by 2040.
The primary reason for the increases in NOx and SO2 is the increased electrical power requirements resulting from additional trains under the Action Alternatives. The predicted increases in NOx and SO2 would account for less than 0.02 percent of NOx and 0.1 percent of SO2 emission burdens currently generated in the Study Area. These relatively small changes are expected to have little impact on overall ambient pollutant concentrations. In addition the vast majority of the Study Area is classified as attainment for SO2 and NO2. However, these estimates for emission burdens generated by future power use are conservative since they are based on current emission profile information obtained from the EPA's egrid and national emission inventory databases; in actuality, a cleaner energy profile will likely exist in the future due to the adoption or increase of renewable portfolio standards by the states within the Study Area. As shown in Table 7.13-6, all states within the Study Area have adopted renewable energy goals. For all states, achievement of these renewable energy targets are expected by 2040.
| Geography | Current Percentage of Renewable Energy | Percentage Renewable Energy Target | Percentage Increase Applied to Current Profile |
|---|---|---|---|
| D.C. | 0% | 20% | 20% |
| MD | 5% | 20% | 15% |
| DE | 0% | 25% | 25% |
| PA | 2% | 18% | 16% |
| NJ | 0% | 25% | 25% |
| NY | 20% | 50% | 30% |
| CT | 1% | 27% | 26% |
| RI | 0% | 16% | 16% |
| MA | 3% | 20% | 17% |
Sources: Egrid http://www.epa.gov/cleanenergy/documents/egridzips/eGRID_9th_edition_V1-0_year_2010_Summary_Tables.pdf; National Conference of State Legislatures, State Renewable Portfolio Standards and Goals - http://www.ncsl.org/research/energy/renewable-portfolio-standards.aspx
To account for the future renewable energy targets of each state, a future energy profile analysis was conducted. This analysis was done by taking the difference between the current and future target renewable energy profile percentages (Table 7.13-6). The resulting percentage was then directly applied to the current emission rates to account for the increased future renewable energy percentage of each area's energy profile. Future renewables were assumed to have a zero emission profile. The results presented in Table 7.13-7 reflect the impacts of the Action Alternatives based upon this future emission profile for electrical generation. As shown in this table, the Action Alternatives would have smaller absolute air quality impacts under a predicted future energy profile, as compared to the impacts expected if the energy profile were to remain the same as that exists today. The reduced air quality impacts would result in an overall reduction in all criteria pollutant burdens, with the exception of SO2, under all Action Alternatives. The predicted increase in SO2 would account for less than 0.1 percent of SO2 emission burdens currently generated in the Study Area.
| Pollutant | Project Element | Alt. 1 | Alt. 2 | Alternative 3 | |||
|---|---|---|---|---|---|---|---|
| via Central CT / Providence | via Long Island / Providence | via Long Island / Worcester | via Central CT / Worcester | ||||
| CO | Roadways | -2,495 | -3,375 | -3,725 | -3,520 | -3,850 | -3,635 |
| Diesel Trains | -1 | -25 | 0 | 1 | 1 | 1 | |
| Electric Trains | 15 | 25 | 40 | 45 | 40 | 25 | |
| TOTAL | -2,480 | -3,380 | -3,685 | -3,475 | -3,810 | -3,610 | |
| VOC | Roadways | -35 | -45 | -50 | -45 | -50 | -50 |
| Diesel Trains | -1 | -1 | 0 | 1 | 1 | 1 | |
| Electric Trains | 1 | 2 | 4 | 4 | 4 | 2 | |
| TOTAL | -30 | -45 | -45 | -45 | -45 | -45 | |
| NOx | Roadways | -165 | -225 | -250 | -235 | -255 | -240 |
| Diesel Trains | -1 | -30 | 0 | 1 | 1 | 1 | |
| Electric Trains | 75 | 135 | 215 | 220 | 225 | 145 | |
| TOTAL | -95 | -115 | -35 | -15 | -30 | -95 | |
| PM10 | Roadways | -40 | -50 | -60 | -55 | -60 | -55 |
| Diesel Trains | -1 | -1 | 0 | 1 | 1 | 1 | |
| Electric Trains | 5 | 15 | 20 | 20 | 20 | 15 | |
| TOTAL | -30 | -40 | -35 | -35 | -40 | -45 | |
| PM2.5 | Roadways | -15 | -25 | -25 | -25 | -25 | -25 |
| Diesel Trains | 0 | -1 | 0 | 1 | 1 | 1 | |
| Electric Trains | 5 | 10 | 15 | 15 | 20 | 10 | |
| TOTAL | -10 | -15 | -10 | -5 | -10 | -15 | |
| SO2 | Roadways | -5 | -10 | -10 | -10 | -10 | -10 |
| Diesel Trains | -1 | -1 | 0 | 1 | 1 | 1 | |
| Electric Trains | 145 | 280 | 445 | 450 | 480 | 310 | |
| TOTAL | 135 | 270 | 435 | 445 | 475 | 300 | |
Source: NEC FUTURE team, 2015
Several other items suggest that future energy profiles will continue to improve and result in fewer emissions:
The FRA did not conduct a quantitative analysis of the impacts to air quality from construction of the Action Alternatives, as a detailed construction schedule, along with estimates of construction equipment and activities, are not developed as part of NEC FUTURE. However, construction of the Action Alternatives would result in temporary emissions of criteria pollutants associated with construction equipment and activities. Local levels of criteria pollutants could also increase near station locations and parking facilities caused by vehicles queuing at these locations.
In addition to the criteria pollutants for which there are NAAQS, the EPA also regulates air toxics. Toxic air pollutants are those pollutants known or suspected to cause cancer or other serious health effects. Most air toxics originate from human-made sources, including on-road mobile sources, non-road mobile sources (e.g., airplanes), area sources (e.g., dry cleaners), and stationary sources (e.g., factories or refineries).
Controlling air toxic emissions became a national priority with the passage of the CAA, whereby Congress mandated that the EPA regulate 188 air toxics, also known as hazardous air pollutants. The EPA has assessed this expansive list in their latest rule on the Control of Hazardous Air Pollutants from Mobile Sources and identified a group of 93 compounds emitted from mobile sources that are listed in their Integrated Risk Information System. 3 In addition, the EPA identified seven compounds with significant contributions from mobile sources that are among the national- and regional-scale cancer risk drivers from their 1999 National Air Toxics Assessment. These are acrolein, benzene, 1,3-butadiene, diesel particulate matter plus diesel exhaust organic gases, formaldehyde, naphthalene, and polycyclic organic matter. While the Federal Highway Administration (FHWA) considers these the priority MSATs, the list is subject to change and may be adjusted in consideration of future EPA rules. The 2007 EPA rule mentioned previously requires controls that will dramatically decrease MSAT emissions through cleaner fuels and cleaner engines. According to an FHWA analysis using the EPA's MOVES2010b model, even if vehicle activity (VMT) increases by 102 percent as assumed it will from 2010 to 2050, a combined reduction of 83 percent in the total annual emissions for the priority MSAT is projected for the same period.
The seven priority MSATs are briefly described below:
Reduction in roadway VMT results in an overall beneficial effect on MSAT. All Action Alternatives would reduce roadway VMT; therefore, a reduction in MSAT would occur within the Affected Environment. Although the No Action Alternative will not affect VMT in the Affected Environment, MSAT emissions will likely be lower than present levels in the design year regardless of the alternative chosen; this reduction will be due to EPA's national control programs, which are projected to reduce annual MSAT emissions by over 80 percent from 2010 to 2050.4
Construction of the Action Alternatives could result in temporary, localized emissions of MSAT associated with construction equipment and activities. Local levels of MSAT could also increase near station locations and parking facilities.
Climate change is an important national and global concern. While the Earth has gone through many natural changes in climate in its history, there is scientific consensus that the Earth's climate is currently changing at an accelerated rate and will continue to do so for the foreseeable future. Anthropogenic (human-caused) GHG emissions contribute to this rapid change. CO2 makes up the largest component of these GHG emissions. Other prominent transportation GHGs include CH4 and N2O.
Many GHGs occur naturally. Water vapor is the most abundant GHG and makes up approximately two-thirds of the natural greenhouse effect. However, the burning of fossil fuels and other human activities are adding to the concentration of GHGs in the atmosphere. Many GHGs remain in the atmosphere for time periods ranging from decades to centuries. GHGs trap heat in the Earth's atmosphere. Because atmospheric concentration of GHGs continues to climb, our planet will continue to experience climate-related phenomena. For example, warmer global temperatures can cause changes in precipitation and sea levels.
GHGs differ in their ability to trap heat. For example, 1 ton of emissions of CO2 has a different effect than 1 ton of emissions of CH4. To compare emissions of different GHGs, inventory compilers use a weighting factor called Global Warming Potential (GWP). To use a GWP, the heat-trapping ability of 1 metric ton (1,000 kilograms) of CO2 is taken as the standard, and emissions are expressed in terms of CO2-equivalent (CO2e). The CO2e for a gas is derived by multiplying the tons of the gas by the associated GWP. The GWP of CO2 is 1. The GWP of CH4 is 21, whereas the GWP of N2O is 310.
To date, no national standards have been established regarding GHGs, nor has the EPA established criteria or thresholds for ambient GHG emissions pursuant to its authority to establish motor-vehicle emission standards for CO2 under the CAA. However, there is a considerable body of scientific literature addressing the sources of GHG emissions and their adverse effects on climate, including reports from the Intergovernmental Panel on Climate Change, the U.S. Global Change Research Program, the U.S. National Academy of Sciences, and the EPA as well as other federal agencies. GHGs are different from other air pollutants evaluated in federal environmental reviews because their impacts are not localized or regional due to their rapid dispersion into the global atmosphere, which is characteristic of these gases. GHG emissions affect the entire planet. Table 7.13-8 highlights the total GHG emissions from the commercial, electric power, residential, industrial and transportation sectors within the Study Area.
| Geography | Greenhouse Gas Emissions* (million metric tons) |
|---|---|
| D.C. | 3 |
| MD | 59 |
| DE | 13 |
| PA | 233 |
| NJ | 99 |
| NY | 154 |
| CT | 32 |
| RI | 10 |
| MA | 59 |
Source: U.S. Energy Information Administration, August 2015.
*Presents existing/ambient GHG emissions.
Table 7.13-9 presents the changes in GHGs in the Study Area, in terms of CO2e, in the year 2040. The changes in CO2e are presented for roadways, diesel trains, and electric trains.
| Project Element | Alt. 1 | Alt. 2 | Alternative 3 | |||
|---|---|---|---|---|---|---|
| via Central CT / Providence | via Long Island / Providence | via Long Island / Worcester | via Central CT / Worcester | |||
| Roadways | -403,330 | -545,875 | -602,530 | -568,705 | -622,645 | -587,905 |
| Diesel Trains | 0 | -10,540 | 0 | 1 | 1 | 1 |
| Electric Trains | 128,685 | 229,235 | 367,365 | 378,115 | 384,920 | 241,545 |
| TOTAL | -274,650 | -327,180 | -235,165 | -190,590 | -237,730 | -346,360 |
Source: NEC FUTURE team, 2015
* Presents changes due to the Action Alternatives, and does not consider ambient GHG emissions.
As shown in Table 7.13-9, CO2e from roadways would decrease with all Action Alternatives, whereas the CO2e from electric trains would increase with all Action Alternatives. Overall, the net total GHGs would decrease under all Action Alternatives. For the No Action Alternative, changes in CO2e will reflect future regulations and VMT growth. As shown in Table 7.13-10, the CO2e reductions would be even greater assuming the future energy profile.
| Project Element | Alternative 1 | Alternative 2 | Alternative 3 | |||
|---|---|---|---|---|---|---|
| via Central CT / Providence | via Long Island / Providence | via Long Island / Worcester | via Central CT / Worcester | |||
| Roadways | -403,330 | -545,875 | -602,530 | -568,705 | -622,645 | -587,905 |
| Diesel Trains | 0 | -10,540 | 0 | 1 | 1 | 1 |
| Electric Trains | 101,805 | 181,230 | 291,730 | 299,405 | 305,440 | 192,315 |
| TOTAL | -301,525 | -375,185 | -310,800 | -269,300 | -317,210 | -395,590 |
Source: NEC FUTURE team, 2015
* Presents changes due to the Action Alternatives, and does not consider ambient GHG emissions.
Additionally, the EPA's proposed Clean Power Plan5 would reduce carbon pollution by 30 percent by 2030. The EPA is currently issuing final rules, and implementation is expected to start in the summer of 2020. States, including those in the Study Area, that have already invested in energy efficiency programs will be able to build on these programs during the compliance period to help make progress toward meeting their targets.
The use of regenerative braking, as described in Section 7.13.3.2, would reduce the energy use, and resulting power plant CO2e emissions, from the electric trains.
As discussed in Chapter 5, Transportation Effects, investment in the NEC FUTURE passenger rail infrastructure would create a shift in demand from aircraft and bus trips servicing the corridor to rail trips, when comparing the No Action Alternative to the Action Alternatives. This mode shift from aircraft and bus trips to rail trips would remove some aircraft and buses from the NEC. As such, CO2e from aircraft and buses would decrease under all Action Alternatives.
The FRA did not conduct a quantitative analysis of the construction impacts to air quality of the Action Alternatives, since a detailed construction schedule, along with estimates of construction equipment and activities, are unknown at the Tier 1 level. However, construction of the Action Alternatives would result in temporary CO2e emissions associated with construction equipment and activities.
Examples of programmatic mitigation measures for air quality include the incorporation of Environmental Performance Measures in Tier 2 alternatives, including solar panels on stations and other buildings, as well as the use of renewable energy. With regards to construction activities, potential mitigation could involve voluntary emission reduction agreements, as well as the use of electric, energy efficient or low-emissions equipment. Specific mitigation concerning air quality impacts during construction, such as fugitive dust from earth moving and pollutants from construction equipment, would also be investigated. The following are examples of potential mitigation measures:
Project-level Tier 2 analyses would include more detailed evaluation of site-specific air quality impacts, where appropriate, as well as updated and refined regional and GHG analyses, as appropriate. Subsequent Tier 2 analyses would determine the benefits at the individual project level. Part of the Tier 2 analyses would include the following:
On November 30, the EPA promulgated a second set of regulations, known as the General Conformity Regulations, which apply to all other federal actions. These regulations ensured that other federal actions also conformed to the SIPs (58 FR 63214). The purpose of the General Conformity Rule is to:
1 U.S. Environmental Protection Agency - Office of Transportation and Air Quality. (2015). Near Roadway Air Pollution and Health. Retrieved May 28, 2015, from Transportation and Air Quality: http://www.epa.gov/otaq/nearroadway.htm
2 http://www2.epa.gov/carbon-pollution-standards/clean-power-plan-proposed-rule
3 EPA, Integrated Risk Information System (IRIS), http://www.epa.gov/iris/
4 Federal Highway Administration. (2013, February 2). Interim Guidance Update on Mobile Source Air Toxic Analysis in NEPA - Appendix B. Retrieved from Air Quality: Transportation and Toxic Air Pollutants: http://www.fhwa.dot.gov/environment/air_quality/air_toxics/policy_and_guidance/aqintguidapb.cfm
5 http://www2.epa.gov/carbon-pollution-standards/clean-power-plan-proposed-rule
6 U.S. Environmental Protection Agency. (2013). Transportation Conformity Guidance for Quantitative Hot-Spot Analyses in PM2.5 and PM10 Nonattainment and Maintenance Areas. Retrieved fromhttp://www.epa.gov/otaq/stateresources/transconf/policy/420b13053-sec.pdf
7 U.S. Environmental Protection Agency. (2010). Using MOVES in Project-Level Carbon Monoxide Analyses. Retrieved fromhttp://www.epa.gov/otaq/stateresources/transconf/policy/420b10041.pdf
8 U.S. Environmental Protection Agency. NONROAD Model. Retrieved fromhttp://www.epa.gov/oms/nonrdmdl.htm
9 U.S. Environmental Protection Agency. Compilation of Air Pollutant Emission Factors. Retrieved fromhttp://www.epa.gov/oms/ap42.htm
10 U.S. Environmental Protection Agency. Preferred/Recommended Models. Retrieved from http://www.epa.gov/scram001/dispersion_prefrec.htm
The information posted on this website includes hypertext links or pointers to information created and maintained by other public and/or private organizations. The FRA provides these links and pointers solely for information and convenience. When users select a link to an outside website, they are leaving the NEC FUTURE website and are subject to the privacy and security policies of the owners/sponsors of the outside website. The FRA does not control or guarantee the accuracy, relevance, timeliness or completeness of information contained on a linked website, or endorse the organizations sponsoring linked websites, the views they express, or the products/services they offer. The FRA cannot authorize the use of copyrighted materials contained in linked websites and is not responsible for transmissions users receive from linked websites.