Energy is an important resource for the nation's economy, and the conservation of energy is vital to the U.S. Department of Transportation's and the Federal Railroad Administration's (FRA) goals of environmental sustainability, clean air, and the reduction of greenhouse gases (GHG). Transportation uses energy to move people and goods, and accounts for a large portion of the total energy consumed within the NEC FUTURE Study Area (Study Area).
Transportation energy use is generally discussed in terms of operational (direct) and construction (indirect) energy consumption. Direct transportation energy consumption is defined, for the Action Alternatives, to be a function of the following operational characteristics:
Indirect energy consumption consists of the non-recoverable, one-time energy expenditures associated with the construction of the physical infrastructure associated with the Action Alternatives.
The FRA collected data from the U.S. Department of Energy to present an overview of the existing transportation energy usage and resources for the Study Area.
Energy is commonly measured in terms of British thermal units (Btu). A Btu is defined as the amount of heat required to raise the temperature of one pound of water by one degree Fahrenheit. For transportation projects, the amount of fuel used predominantly influences energy usage. The average Btu content of fuels is the heat value (or energy content) per quantity of fuel, as determined from tests of fuel samples.
Table 7.14-1 details the type of assessment used to characterize the potential energy impacts for each of the Action Alternatives by mode. The FRA calculated on-road vehicle energy, using U.S. Environmental Protection Agency's (EPA) MOVES2010b mobile source emissions modeling program, which estimates energy use for mobile sources. FRA ran MOVES2010b using state-specific national level runs of EPA's MOVES2010b, as the 2040 vehicle-miles traveled (VMT) data were generated on a statewide basis. MOVES2010b accounts for the improved fuel efficiency of autos in 2040. The FRA used the MOVES2010b outputs to determine the changes in energy use caused by changes in roadway VMT (from the No Action to the Action Alternatives).
| Resource | Affected Environment | Type of Assessment | Outcome |
|---|---|---|---|
| Energy | Energy Consumption by Sector - U.S. Department of Energy (DOE) - Energy Information Administration | Quantitative: Percentage by sector per state | Statewide energy profile data |
| DOE - Energy Information Administration | Qualitative discussion | Overview of energy resources by state | |
| Regional traffic along the Representative Route of each Action Alternative | Quantitative: Btu | Amount of energy required for propulsion of vehicles within the Study Area | |
| Train vehicle-miles traveled - Rail lines within the Northeast Corridor (NEC) | Quantitative: Btu | Amount of energy required for propulsion of vehicles within the Study Area | |
| Bus and Air travel within NEC region | Qualitative discussion | Potential changes in bus and air travel | |
| Construction Activities | Qualitative discussion | Qualitative discussion of energy use during construction |
Source: NEC FUTURE team, NEC FUTURE Energy Effect-Assessment Methodology, Appendix E, Section E.14, 2014
The FRA calculated potential regional energy usage of the trains based on changes in train vehicle-miles and average energy requirements of passenger trains, as detailed in the Transportation Energy Data Book (Edition 33). The energy impacts caused by changes in air travel and construction are discussed qualitatively. Chapter 7.13, Air Quality, used these data to calculate pollutant emissions.
Under the Council on Environmental Quality (CEQ) regulations for implementing the National Environmental Policy Act, consideration of energy efficiency is specifically required. Under 40 C.F.R. 1502.16(e) regarding the requirements for analyzing and documenting Environmental Consequences, agencies are required to discuss "energy requirements and conservation potential of various alternatives and mitigation measures." 40 C.F.R. 1502.16(f) requires agencies to consider the "natural or depletable resource requirements and conservation potential of various alternatives and mitigation measures."
Energy efficiency and conservation concepts may also be interpreted as a necessary consideration in addressing the relationship between short-term uses of the human environment and the maintenance and enhancement of long-term productivity, and any irreversible or irretrievable commitments of resources as required by the CEQ regulations (Section 1502.16).
The following executive orders and policies require or promote energy efficiency in federal actions:
Energy consumption per capita varies among the states and districts within Study Area. As shown in Table 7.14-2, in 2012, Delaware had the highest consumption per capita for states along the NEC, though 28th in the nation, and Rhode Island has the lowest consumption for states along the NEC.
| Geography | Consumption per Capita (million Btu) |
Consumption per Capita, Rank (out of 50 states and Washington, D.C.) |
Consumption per Capita, Rank (out of 8 states and Washington, D.C.) |
|---|---|---|---|
| D.C. | 267 | 36 | 3 |
| MD | 236 | 40 | 5 |
| DE | 298 | 28 | 1 |
| PA | 284 | 31 | 2 |
| NJ | 256 | 37 | 4 |
| NY | 179 | 50 | 8 |
| CT | 203 | 47 | 7 |
| RI | 173 | 51 | 9 |
| MA | 209 | 45 | 6 |
Source: U.S. Energy Information Administration, 2015
Transportation accounts for a significant portion of the energy consumed in the Study Area. Energy usage for transportation accounts for approximately 12 -37 percent of the states' energy consumption within the Study Area (Figure 7.14-1). Table 7.14-3 indicates that in 2012 in the United States, light vehicles (cars, light trucks, and motorcycles) accounted for the largest percentage of transportation energy use (58.6 percent). Medium and heavy-duty trucks accounted for the next largest percentage of total transportation energy use (22.0 percent). When including buses (0.8 percent of total transportation energy use), on-road vehicles accounted for over 80 percent of total transportation energy. Of the remaining non-roadway modes of transportation, aircrafts accounted for 8.0 percent of the total, watercrafts accounted for 4.5 percent, pipelines accounted for 3.8 percent, and rail accounted for 2.3 percent.
| Mode | Consumption (Trillion Btu) |
Percentage of Total |
|---|---|---|
| Light Vehicles | 15,361.2 | 58.6% |
| Buses | 199.9 | 0.8% |
| Medium/Heavy Trucks | 5,775.5 | 22.0% |
| Aircraft | 2,091.9 | 8.0% |
| Watercraft | 1,187.4 | 4.5% |
| Pipeline | 997.0 | 3.8% |
| Rail | 597.7 | 2.3% |
Source: U.S. Energy Information Administration, 2014
Figure 7.14-1 : Energy Consumption by Sector
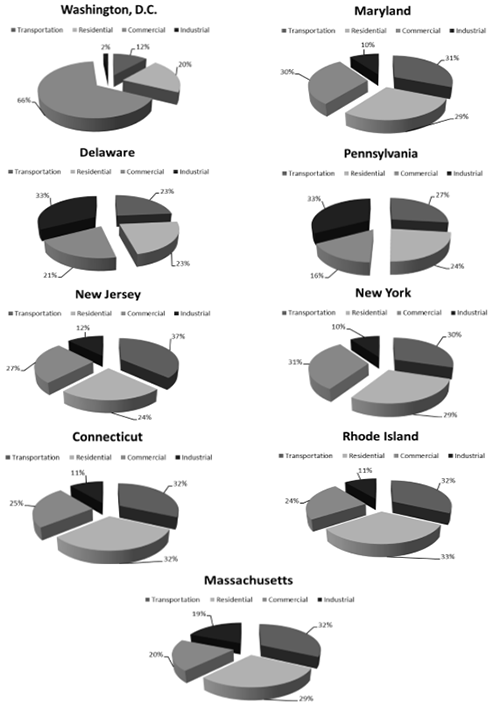
Source: U.S. Energy Information Administration, 2015
Table 7.14-4 presents the changes in energy use for roadways, diesel trains, and electric trains for the Study Area in the year 2040 under the Action Alternatives as compared to the No Action Alternative. The table presents the results also in terms of tons of oil equivalent.
| Project Element | Alt. 1 | Alt. 2 | Alternative 3 | |||
|---|---|---|---|---|---|---|
| via Central CT / Providence | via Long Island / Providence | via Long Island / Worcester | via Central CT / Worcester | |||
| Roadways* | -4,815,105 | -6,516,805 | -7,193,175 | -6,789,375 | -7,433,350 | -7,018,580 |
| Diesel Trains | -1 | -128,585 | 0 | 4 | 4 | 4 |
| Electric Trains** | 1,001,290 | 1,746,280 | 2,767,645 | 2,884,285 | 2,895,990 | 1,779,385 |
| TOTAL (MMBtu/year) |
-3,813,815 | -4,899,110 | -4,425,530 | -3,905,085 | -4,537,355 | -5,239,195 |
| TOTAL*** (Tons of Oil Equivalent/year) |
-9,611 0 | -12,346 0 | -11,152 0 | -9,841 0 | -11,434 0 | -13,203 0 |
Source: NEC FUTURE team, 2015
* Roadways represent changes in vehicle-miles traveled from personal vehicles (autos) on the roadway network; this does not include potential changes in intercity buses and trucks.
** Analysis of energy use by alternative will be affected by a later decision as to the type of trainsets that will be used.
*** Conversion based upon U.S. Department of Energy's Transportation Energy Data Book: Edition 33, Table B.7.
MMBtu = million Btu
As shown in Table 7.14-4, for all the Action Alternatives, roadway energy would decrease, whereas the energy for electric trains would increase. Overall energy use would decrease under all Action Alternatives, with Alternative 3 (via Central Connecticut/Worcester) showing the largest decrease in total energy use and Alternative 1 showing the smallest decrease in total energy use. Alternative 3 (via Long Island/Worcester route option) shows the greatest decrease in energy use from roadways, whereas Alternative 1 shows the smallest decrease in energy use from roadways. Alternative 3 (via Long Island/Worcester route option) shows the greatest increase in electric energy use from the trains, whereas Alternative 1 shows the smallest increase in electric energy from the trains. Changes in energy use of diesel trains are much smaller in scale than those from roadways and electric trains, with Alternatives 1 and 2 showing decreases in energy use of diesel trains and all Alternatives 3 route options showing no change or a slight increase in energy use of diesel trains.
The decreases in roadway energy use are attributed to decreases in VMT under the Action Alternatives, as compared to the No Action Alternative, caused by passengers choosing to use the train rather than drive. The increases in electric train energy are attributed to the increases in train service associated with the Action Alternatives. The changes in diesel trains are also attributed to changes in service associated with the Action Alternatives.
As discussed in Chapter 5, Transportation Effects, investment in the NEC FUTURE passenger rail infrastructure would create a shift in demand from aircraft and bus trips servicing the corridor to rail trips, when comparing the Action Alternatives to the No Action Alternative. As such, the shift in travel mode choice would likely result in a decrease in energy use from aircraft and buses under all Action Alternatives; however, it was not within the scope of this analysis to make quantitative predictions regarding the level of decrease in energy use.
Table 7.14-5 presents energy intensities-or the energy required to move a passenger per mile for each mode of transportation-for various modes of transportation. Intercity rail has a lower energy intensity (2,214 Btu per passenger-mile) than transit buses (4,030 Btu per passenger-mile) or aircraft (2,484 Btu per passenger-mile). As such, the expected mode shifts from buses and aircraft to Intercity passenger rail would result in an overall decrease in energy use. As shown in the table, the energy intensities of cars, personal trucks, and motorcycles are also higher than for intercity rail.
| Mode | Energy Intensities (Btu per passenger-mile) |
|---|---|
| Transit Buses | 4,030 |
| Personal Trucks | 3,561 |
| Cars | 3,193 |
| Commuter Rail | 2,838 |
| Aircraft | 2,484 |
| Motorcycles | 2,475 |
| Transit Rail | 2,398 |
| Intercity Rail | 2,214 |
Source: U.S. Energy Information Administration, 2014
Each of the Action Alternatives propose the addition of new equipment. This equipment would use regenerative braking, which would reduce the energy use from the electric trains. Regenerative braking is the process during which the train's electric traction motors are utilized as generators during a brake application. It is considered standard operating procedure for high performance electric trains. This regenerated electricity can be used to power other trains drawing power within the network. The regenerated power can also be returned to the electrical utility grid using bi-directional traction power substations. Trains with high brake duty cycles can recover upwards of 15 percent of the total consumed electricity. High-performance trains can recover approximately 5-10 percent of the total electricity consumed, a value that is reduced by the longer distances between stations, and fewer station stops
The FRA did not conduct a quantitative construction analysis because the FRA did not develop a detailed construction schedule, or estimates of construction equipment and activities, as part of NEC FUTURE. However, construction of the Action Alternatives would result in energy use associated with construction equipment and activities, as well as construction worker and delivery trips. Furthermore, the implementation of NEC FUTURE would most likely occur as multiple Tier 2 actions. As such, future construction activities associated with each of the Tier 2 actions would result in multiple, individual non-recoverable uses of energy.
Operational energy use would decrease if the Action Alternatives were implemented, resulting in beneficial energy effects and therefore no need for mitigation. To further reduce energy use, measures that include using alternative energy sources, creating renewable energy plans, and increasing fuel efficiency would be considered during later phases of project development and construction.
Elements of the U.S. Department of Transportation's Strategic Plan that are applicable to energy usage, sustainability, and reliability would be incorporated as part of subsequent Tier 2 project-level analysis. Depending upon the Tier 2 action, further analysis of operational energy effects may not be required.
The information posted on this website includes hypertext links or pointers to information created and maintained by other public and/or private organizations. The FRA provides these links and pointers solely for information and convenience. When users select a link to an outside website, they are leaving the NEC FUTURE website and are subject to the privacy and security policies of the owners/sponsors of the outside website. The FRA does not control or guarantee the accuracy, relevance, timeliness or completeness of information contained on a linked website, or endorse the organizations sponsoring linked websites, the views they express, or the products/services they offer. The FRA cannot authorize the use of copyrighted materials contained in linked websites and is not responsible for transmissions users receive from linked websites.