Key Resource: Parklands
Section 4(f) of the U.S. DOT Act protects publicly owned parks, recreation areas, and wildlife/waterfowl refuges, and historic properties. Impacts on these resources are discouraged and require additional analysis to determine the type of impact and whether identified impacts can be avoided or minimized.
Analysis of parklands informs Section 4(f) analysis.
Types of effects can include conversion of parkland resources to non-recreational uses, visual changes, noise and vibration, and access.
This chapter provides a brief description of parklands and wild and scenic rivers in the Affected Environment and broader Context Area and includes the evaluation of potential environmental consequences of the Tier 1 Draft Environmental Impact Statement (Tier 1 Draft EIS) Action Alternatives on these resources. The Federal Railroad Administration (FRA) further examines those parkland resources identified in this chapter as potentially affected as part of the Section 4(f) and Section 6(f) evaluations (Chapter 7.16).
For the purposes of this analysis, parklands include parks and outdoor recreational facilities, bird sanctuaries, wildlife preserves, resource management areas, federal and state forests, and similar resources that are publicly owned.
Wild and scenic rivers are those rivers listed on the National Rivers Inventory and defined as "rivers of the U.S. which, with their immediate environments, possess outstandingly remarkable scenic, recreational, geologic, fish and wildlife, historic, cultural, or other similar values." (Public Law 90-542; 16 U.S.C. 1271 et seq.) These rivers may also be classified as Wild River Areas, Scenic River Areas, or Recreational River Areas, but regardless of the classification, they are administered with the goal of protecting and enhancing the values that caused it to be designated.
The FRA developed an effects-assessment methodology for parklands and wild and scenic rivers (see Appendix E, Section E.04, Parklands and Wild and Scenic Rivers Effects-Assessment Methodology Report). The methodology provides a definition of each resource type, data sources, an explanation on how the Affected Environment was defined and established, and how the effects on each resource were evaluated and reported. Table 7.4-1 summarizes key factors associated with the methodologies for the evaluation of parkland and wild and scenic rivers. In keeping with the Tier 1 level assessment, the FRA identified only federal, state, and county parklands. The FRA will collect information regarding municipal and local parklands and recreational facilities during subsequent project-level environmental assessments.
| Resource | Affected Environment | Type of Assessment | Outcome |
|---|---|---|---|
| Parklands and Wild and Scenic Rivers | 2,000-foot-wide swath centered along Representative Route for each Action Alternative | Quantitative: Acres | Identification of federal, state, and county parklands and wild and scenic rivers affected by the Action Alternatives and where the Action Alternative may cross a resource and result in a land conversion, or cause proximity effects, such as visual or noise effects |
Source: NEC FUTURE Parklands and Wild and Scenic Rivers Effects-Assessment Methodology, Appendix E, Section E.04.A, 2014.
Implementation of the No Action or Action Alternatives could result in conversion of existing parklands to non-recreational uses and expanded or new crossings of designated wild and scenic rivers. Conversions of parklands may occur through modifications to existing rail infrastructure or constructing new rail infrastructure within parklands. Crossing a wild and scenic river may affect the visual character or setting that may be important to the designation. Implementation of the No Action or Action Alternatives could also result in proximity effects, such as noise and vibration effects caused by new service on new routes or changes in service on existing routes. Parklands exist throughout the 2,000-foot-wide Affected Environment, with higher acreages of these lands found in Maryland, New York, Connecticut, Rhode Island, and Massachusetts. Higher acreages of parklands are located in areas where the Action Alternatives diverge from the existing NEC and create new segments or extend off-corridor, primarily in New York under Alternative 3, and Connecticut and Rhode Island under all the Action Alternatives.
The most parks occur within the Affected Environment of Alternative 2, and the highest total park acreages occur within the Affected Environment of Alternative 3. There is one wild and scenic river - White Clay Creek in New Castle, Delaware - in the Affected Environment of all of the Action Alternatives.
Key findings for the analysis of NEC FUTURE Action Alternatives' effects on parklands are listed below.
Depending on identification of the Preferred Alternative, subsequent project phases would further examine the relevant parks listed above to avoid or minimize impacts.
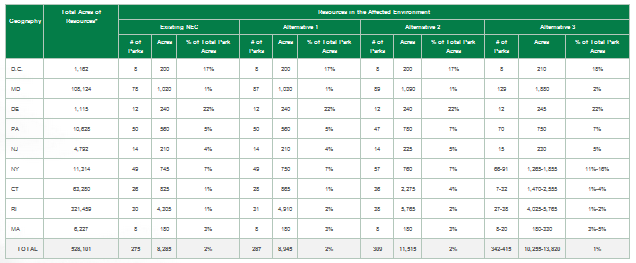
For each of the Action Alternatives, the following sections and Table 7.4-2 identify the number of federal, state, and county parks, total park acreage, and percentage of the total park acreage within the Affected Environment. One wild and scenic river exists in the Affected Environment of all of the Action Alternatives: White Clay Creek, in New Castle, DE.
Table 7.4-2: Parklands and Wild and Scenic Rivers Resources within the Affected Environment
The counties that have the most parks in the Affected Environment are Baltimore City, MD (51 to 93 parks, depending on the Action Alternative); Philadelphia, PA (39 to 59 parks); and Queens, NY (14 to 40 parks). The counties that have the most park acreage in the Affected Environment for the alternatives include Washington County, RI (3,200+ acres); Providence County, RI (up to 2,200 acres); and Windham County, CT (over 1,000 acres). (See Appendix E, Section E.04, for a complete list and the acreages of parklands and wild and scenic rivers identified.) Some of the largest parks in the Affected Environment include the Rhode Island Greenway, which goes through Kent, Providence, and Washington, RI; Natchaug State Forest in Windham, CT; and the Great Swamp Management Area in Washington, RI.
Table 7.4-3 presents the number and acreage of parks that are within the Representative Route of each Action Alternative. This acreage represents the area of parkland crossed by an Action Alternative that may result in a land conversion of a parkland resource to a transportation resource. Parklands within the Affected Environment that are adjacent to the existing NEC and Action Alternatives could experience proximity effects such as visual interference or noise that may affect the designated use for which the parkland was intended1. Proximity effects could result from new service or infrastructure, such as new noise and vibration impacts from an increase in trains passing, and visual impacts resulting from new construction and operation of the proposed service. For example, a park designated for meditative purposes could no longer be useable for meditative purposes if a proposed action introduces a proximity effect, such as new noise. However, parklands experiencing the greatest effects would be those where all or portions of the parkland are within the Representative Route of an Action Alternative. More specifically, the following general effects on parklands could occur as a result of the various construction types and methods proposed:
At-grade: Direct physical disturbance to existing parklands through the construction and introduction of new track bed and landscaping, and the installation of utilities and/or catenary poles and potential proximity effects (i.e., visual, noise, vibration)
Trench: Direct physical disturbance to existing parklands through the construction and introduction of new trenches and landscaping, and the installation of utilities and/or catenary poles and potential proximity effects (i.e., visual, noise, vibration)
Embankment: Direct physical disturbance to existing parklands through the introduction of new retaining walls and/or earthen berms and potential proximity effects (i.e., visual, noise, vibration)
Aerial Structure or Major Bridge: Direct physical disturbance to existing parklands at the site of abutments and/or pilings on land and in waterways and disturbance to existing parklands through the introduction of new aerial structures and potential proximity effects (i.e., visual, noise, vibration)
Tunnel: Direct physical disturbance to existing parklands at tunnel boring machine launch sites, ventilation shafts and egress points, and potential proximity effects through vibrations
Temporary construction effects could occur where access roads are created and at staging and lay-down areas. Impacts could include temporary disturbance to existing parklands. Chapter 8, Construction Effects, presents a qualitative description and examples of potential construction-related effects for parklands.
| Geography | Existing NEC | Alternative 1 | Alternative 2 | Alternative 3* | ||||
|---|---|---|---|---|---|---|---|---|
| # of Parks | Acres within the Alignment | # of Parks | Acres within the Representative Route | # of Parks | Acres within the Representative Route | # of Parks | Acres within the Representative Route | |
| D.C. | 3 | 10 | 3 | 10 | 3 | 10 | 4 | 25 |
| MD | 15 | 10 | 15 | 10 | 17 | 25 | 24 | 190 |
| DE | 5 | 5 | 5 | 5 | 5 | 5 | 6 | 15 |
| PA | 17 | 20 | 17 | 20 | 18 | 45 | 19 | 50 |
| NJ | 5 | 2 | 5 | 2 | 6 | 10 | 6 | 15 |
| NY | 9 | 50 | 9 | 50 | 9 | 50 | 13-16 | 115-125 |
| CT | 17 | 50 | 18 | 55 | 23 | 105 | 21-23 | 60-90 |
| RI | 19 | 265 | 20 | 350 | 25 | 345 | 18-25 | 265-350 |
| MA | 5 | 25 | 5 | 25 | 5 | 25 | 5-7 | 25-45 |
| TOTAL | 95 | 435 | 97 | 525 | 111 | 620 | 116-130 | 760-905 |
Source: NEC FUTURE team, 2015
Note: All Action Alternatives assume improvements to the existing NEC; therefore, the number of resources presented is inclusive of the existing NEC as well as any new option or off-corridor route associated with each Action Alternative.
Note: There is one wild and scenic river-White Clay Creek in New Castle, Delaware-which is crossed by the existing NEC and all Action Alternatives. Alternative 3 creates a new crossing.
* The range represents the Representative Route design options for Alternative 3. See the Alternative 3 discussion below.
Of the Action Alternatives, Alternative 3 would affect the most parks (between 116 and 130 parks). Alternative 3 would also affect the most park acreages (up to 905 acres). There is one wild and scenic river - White Clay Creek in New Castle, Delaware - which is crossed by the existing NEC and all Action Alternatives. Alternative 3 creates a new crossing. (See Appendix E, Section E.04, for a complete list of all parklands and wild and scenic rivers that would be affected.)
Effects of the No Action Alternative are not quantified as part of this analysis as explained in the introduction to Chapter 7. However, projects being implemented under the No Action Alternative would occur within or adjacent to the NEC right-of-way. Land uses in the existing NEC are already dedicated to support existing train operations and the right-of-way contains rail infrastructure and ancillary facilities located adjacent to parklands and wild and scenic rivers. It is expected that land uses would not change under the No Action Alternative and train operations would remain essentially the same as existing conditions; therefore, no new noise or vibration impacts are expected. The introduction of new or modified infrastructure associated with No Action Alternative projects may result in visual effects to parks and wild and scenic rivers within the Affected Environment for the existing NEC. Additional effects could also include sliver2takes in parklands directly adjacent to existing infrastructure. Project sponsors of the No Action Alternative would be responsible for determining the effects on these resources as part of the project.
Table 7.4-4 lists the parks that fall outside of the footprint of the existing NEC and would likely be affected by Alternative 1. The potential effects are also described within the table.
Table 7.4-5 lists the parks that fall outside of the footprint of the existing NEC and that would likely be affected by Alternative 2. The potential effects are also described within the table.
Table 7.4-6 summarizes the number of parks and parks acreage that would be affected by the Alternative 3 options.
Washington, D.C., to New York City
Table 7.4-7 lists the parks that fall outside of the footprint of the existing NEC and that would likely be affected by Alternative 3 (Washington, D.C., to New York City). The potential effects are also described within the table.
New York City to Hartford
Via Central Connecticut
Table 7.4-8 lists the parks that fall outside of the footprint of the existing NEC and that would likely be affected by Alternative 3 (New York City to Hartford via Central Connecticut). The potential effects are also described within the table. No wild and scenic rivers would be affected.
Via Long Island
Table 7.4-9 lists the parks that fall outside of the footprint of the existing NEC and that would likely be affected by Alternative 3 (New York City to Hartford via Long Island). The potential effects are also described within the table. No wild and scenic rivers would be affected.
Hartford to Boston
Via Providence
Table 7.4-10 lists the parks that fall outside of the footprint of the existing NEC and that would likely be affected by Alternative 3 (Hartford to Boston via Providence). The potential effects are also described within the table. No wild and scenic rivers would be affected.
Via Worcester
Table 7.4-11 lists the parks that fall outside of the footprint of the existing NEC and would likely be affected by Alternative 3 (Hartford to Boston via Worcester). The potential effects are also described within the table. No wild and scenic rivers would be affected.
| State | County | Resource of Interest | Total Area of Resource (acres)* | Number of Acres Affected | % of Total Area Affected | Construction Type | Potential Impact |
|---|---|---|---|---|---|---|---|
| CT | Fairfield | Saugatuck River Water Access | 1 | 1 | 100% | Major Bridge | Visual effects |
| New London | Mystic Oral School Water Access | 70 | 10 | 14% | Embankment | Potential land conversion; Potential acquisition; Visual and noise effects | |
| Total CT | 71 | 11 | 15% | ||||
| RI | Washington | Bradford/Bradford Dye/Grills Preserve | 480 | 15 | 3% | Embankment, Aerial | Potential land conversion; Potential acquisition; Visual and noise effects |
| Bradford/Grills/Hopkinton Land Trust | 160 | 10 | 6% | Embankment, Aerial | Potential land conversion; Potential acquisition; Visual and noise effects | ||
| Burlingame Management Area/Burlingame Management | 990 | 1 | <1% | Trench | Potential land conversion; Visual and noise effects | ||
| Burlingame MA/Drew | 210 | 10 | 5% | Embankment, Aerial | Potential land conversion; Potential acquisition; Visual and noise effects | ||
| Burlingame MA/Holley | 165 | 5 | 3% | At-grade, Trench | Potential land conversion.; Potential acquisition; Visual and noise effects | ||
| Burlingame MA/Phantom Bog | 260 | 5 | 2% | Embankment | Potential land conversion; Potential acquisition; Visual and noise effects | ||
| Great Swamp MA/Great Swamp | 2,835 | 50 | 2% | Embankment, Aerial | Potential land conversion; Potential acquisition; Visual and noise effects | ||
| Great Swamp MA/Pelky | 10 | 1 | 13% | Embankment, Aerial | Potential land conversion; Visual effects | ||
| Greenway | 104,570 | 180 | <1% | Embankment, Aerial, At-grade, Trench | Potential land conversion; Potential acquisition; Visual effects | ||
| Stripped | 310 | 1 | <1% | Embankment, Aerial, At-grade | Potential land conversion; Potential acquisition; Visual effects | ||
| Total RI | 109,990 | 278 | <1% | ||||
| TOTAL ALTERNATIVE | 110,061 | 289 | <1% |
Source: NEC FUTURE team, 2015
* The total number of acres represents the total acreage of the resource, including acres outside and inside the Affected Environment of Alternative 1.
| State | County | Resource of Interest | Total Area of Resource (acres) | Acres Affected under Alt 2 | % of Total Area Affected | Construction Type | Potential Impact |
|---|---|---|---|---|---|---|---|
| MD | Harford | North Deen Park | 10 | 5 | 50% | Trench | Potential land conversion; Potential acquisition; Visual and noise effects |
| Cecil | Fletchwood Community Park | 25 | 10 | 40% | Embankment, Aerial | Potential land conversion; Potential acquisition; Visual and noise effects | |
| West Branch Community Park | 20 | 5 | 25% | Embankment, Aerial | Potential land conversion; Potential acquisition; Visual and noise effects | ||
| Total MD | 55 | 20 | 36% | ||||
| PA | Delaware | BicyclePA Route E | 295 | 10 | 3% | Embankment, Aerial, At-grade | Potential land conversion; Potential acquisition; Visual and noise effects |
| John Heinz National Wildlife Refuge At Tinicum | 1,070 | 1 | <1% | Embankment, Major Bridge | Potential land conversion; Visual and noise effects | ||
| Philadelphia | Bartram's Garden | 50 | 5 | 10% | Embankment and Aerial | Potential land conversion; Visual and noise effects | |
| East Park | 610 | 10 | 2% | Embankment, Major Bridge | Potential land conversion; Visual effects | ||
| John Heinz National Wildlife Refuge At Tinicum | 1,075 | 15 | 1% | Embankment, Major Bridge | Potential land conversion; Potential acquisition; Visual and noise effects | ||
| Schuylkill River Water Trail | 520 | 1 | <1% | Major Bridge | Visual effects | ||
| West Park | 1,295 | 10 | 1% | Major Bridge | Crosses into and follows park for 0.5 mi.; Visual and noise effects | ||
| Total PA | 4,915 | 52 | 1% | ||||
| NJ | Middlesex | Merrill Park | 180 | 10 | 6% | Embankment | Potential land conversion; Potential acquisition; Visual and noise effects |
| Union | Merrill Park | 180* | 1 | <1% | Embankment | Potential land conversion; Visual and noise effects | |
| Total NJ | 180 | 11 | 6% | ||||
| NY | Bronx | Pelham Parkway | 80 | 1 | 1% | At-grade | Potential land conversion; Potential acquisition; Visual and noise effects |
| Starlight Park | 15 | 5 | 33% | Embankment, Aerial | Potential land conversion; Potential acquisition; Visual and noise effects | ||
| Total NY | 95 | 6 | 6% | ||||
| CT | Fairfield | Mianus River Water Access | 15 | 10 | 67% | Embankment, Aerial, Major Bridge | Potential land conversion; Potential acquisition; Visual and noise effects |
| Saugatuck River Water Access | 1 | 1 | 94% | Aerial | Potential land conversion; Visual effects | ||
| New Haven | Quinnipiac River Marsh Wildlife Area | 560 | 10 | 2% | Embankment, Aerial, and Major Bridge | Potential land conversion; Potential acquisition; Visual and noise effects | |
| Hartford | Silver Lake Water Access | 40 | 1 | 3% | At-grade | Potential land conversion.; Potential acquisition; Visual and noise effects | |
| Tolland | Nathan Hale State Forest | 1,550 | 10 | 1% | Trench | Potential land conversion; Potential acquisition; Visual and noise effects | |
| Windham | Airline State Park Trail | 201 | 1 | <1% | Embankment | Potential land conversion; Visual effects | |
| Natchaug State Forest | 12,600 | 25 | <1% | Embankment, Trench | Potential land conversion; Potential acquisition; Visual and noise effects | ||
| Total CT | 14,967 | 58 | <1% | ||||
| RI | Providence | Greenway | 104,570 | 110 | <1% | Embankment, Aerial, At-grade | Potential land conversion; Potential acquisition; Visual and noise effects |
| Killingly Pond MA/Bissel | 30 | 1 | 3% | Embankment | Potential land conversion; Potential acquisition; Visual and noise effects | ||
| Killingly Pond MA/Cate | 150 | 1 | 1% | Embankment | Potential land conversion; Potential acquisition; Visual and noise effects | ||
| Killingly Pond MA/Shippee | 370 | 15 | 4% | Embankment, Aerial, Trench | Potential land conversion; Potential acquisition; Visual and noise effects | ||
| Harris Preserve ASRI Natural Area | 50 | 1 | <1% | Embankment | Potential land conversion; Visual and noise effects | ||
| Snake Den State Park/Snake Den | 780 | 15 | 2% | Embankment | Potential land conversion; Potential acquisition; Visual and noise effects | ||
| Ten Mile River Greenway | 10 | 1 | 10% | Aerial, At-grade, Trench | Potential land conversion; Visual and noise effects | ||
| Total RI | 105,960 | 144 | <1% | ||||
| TOTAL ALTERNATIVE | 126,172 | 291 | <1% |
Source: NEC FUTURE team, 2015
MA: Management Area
*Not included in total to avoid double-counting.
** The total number of acres represents the total acreage of the resource, including acres outside and inside the Affected Environment of Alternative 2.
| Geography | D.C. to NYC | New York City to Hartford | Hartford to Boston | |||||||
|---|---|---|---|---|---|---|---|---|---|---|
| # of Parks | Acres | via Central Connecticut | via Long Island | via Providence | via Worcester | |||||
| # of Parks | Acres | # of Parks | Acres | # of Parks | Acres | # of Parks | Acres | |||
| D.C. | 4 | 25 | - | - | - | - | - | - | - | - |
| MD | 24 | 190 | - | - | - | - | - | - | - | - |
| DE | 6 | 15 | - | - | - | - | - | - | - | - |
| PA | 19 | 50 | - | - | - | - | - | - | - | - |
| NJ | 6 | 15 | - | - | - | - | - | - | - | - |
| NY | - | - | 13 | 115 | 16 | 125 | - | - | - | - |
| CT | - | - | 20 | 55 | 18 | 50 | 3 | 35 | 3 | 10 |
| RI | - | - | - | - | - | - | 25 | 350 | 18 | 265 |
| MA | - | - | - | - | - | - | 5 | 45 | 7 | 25 |
| TOTAL | 59 | 295 | 33 | 170 | 34 | 175 | 33 | 430 | 28 | 300 |
Source: NEC FUTURE team, 2015
Note: All Action Alternatives assume improvements to the existing NEC; therefore, the number of resources presented is inclusive of the existing NEC as well as any new option or off-corridor route associated with each Action Alternative.
- = Not applicable within that alternative/route option.
| Geography | County | Resource of Interest | Total Area of Resource (acres)** | Acres Affected under Alt 3 | % of Total Area Affected | Construction Type | Potential Impact |
|---|---|---|---|---|---|---|---|
| D.C. | Washington | Arboretum/Rec Center Grounds | 450 | 1 | <1% | Embankment | Potential land conversion; Potential sliver acquisition |
| Anacostia Park, Section G | 570 | 20 | 4% | Embankment, Major Bridge | Potential land conversion; Potential acquisition; Visual and noise effects | ||
| Baltimore Washington Pkwy | 30 | 10 | 33% | Embankment, Major Bridge | Potential land conversion; Potential acquisition; Visual effects | ||
| Total D.C. | 1,050 | 31 | 3% | ||||
| MD | Prince George's | Folly Branch Stream Valley Park | 235 | 5 | 2% | At-Grade | Potential land conversion; Potential acquisition; Visual and noise effects |
| Fran Uhler Natural Area | 320 | 10 | 3% | Embankment, Aerial | Potential land conversion; Visual and noise effects | ||
| Anne Arundel | Patuxent Research Refuge | 12,820 | 60 | <1% | Embankment, Aerial, Major Bridge | Potential land conversion; Potential acquisition; Visual and noise effects | |
| Midland Park | 20 | 10 | 50% | Embankment | Potential land conversion; Potential acquisition; Visual and noise effects | ||
| Patapsco Valley State Park | 13,950 | 30 | <1% | At-Grade, Embankment, Major Bridge | Potential land conversion; Potential acquisition; Visual and noise effects | ||
| Baltimore | Herring Run Park | 550 | 1 | <1% | Embankment, Aerial | Potential land conversion; Visual and noise effects | |
| Gunpowder Falls State Park | 15,950 | 40 | <1% | Aerial | Crosses the park; Visual effects | ||
| Patapsco Valley State Park | 13,950 | 1 | <1% | Major Bridge | Crosses the feature near edge for 1.5 miles; Visual effects | ||
| MD | Harford | Anita C. Leight Estuary Center | 90 | 10 | 11% | Embankment, Trench | Potential land conversion; Potential acquisition; Visual and noise effects |
| Belcamp Park | 10 | 1 | 10% | Embankment | Potential land conversion; Potential acquisition; Visual and noise effects | ||
| Bush Declaration Natural Resources MA | 270 | 1 | <1% | Embankment, Aerial | Potential land conversion; Visual and noise effects | ||
| David Craig Park | 1 | 1 | 100% | Major Bridge | Crosses Park; Visual effects | ||
| Havre De Grace Activity Center | 5 | 1 | 20% | At-grade, Trench | Potential land conversion; Potential acquisition; Visual and noise effects | ||
| North Deen Park | 10 | 1 | 10% | Embankment | Potential land conversion; Potential acquisition; Visual and noise effects | ||
| Perryman Park | 90 | 5 | 6% | Embankment, Aerial | Potential land conversion; Potential acquisition; Visual and noise effects | ||
| Fletchwood Community Park | 25 | 10 | 40% | Embankment, Aerial | Potential land conversion; Potential acquisition; Visual and noise effects | ||
| West Branch Community Park | 30 | 10 | 33% | Embankment, Aerial | Potential land conversion; Potential acquisition; Visual and noise effects | ||
| Total MD | 58,326 | 197 | <1% | ||||
| DE | New Castle | Banning Park | 150 | 1 | 1% | At-grade | Potential land conversion; Visual and noise effects |
| Cool Run Park | 35 | 1 | 3% | At-grade | Potential land conversion; Visual and noise effects | ||
| Fox Point State Park | 90 | 10 | 11% | Aerial, At-grade | Follows outside edge for entire length of feature; Potential land conversion; Potential acquisition; Visual and noise effects | ||
| Harmony Hills Park | 50 | 1 | <1% | At-grade | Potential land conversion; Visual and noise effects | ||
| Pleasant Hills Park | 20 | 1 | <1% | Aerial | Portion of park in the route; Visual and noise effects | ||
| Rutherford Park | 10 | 1 | 10% | At-grade | Potential land conversion; Visual and noise effects | ||
| White Clay Creek Wild and Scenic River | 700 | 2 | <1% | Embankment, Aerial, At-grade | Crosses creek; Visual effects | ||
| Total DE | 1,055 | 17 | 2% | ||||
| PA | Delaware | BicyclePA Route E | 290 | 15 | 5% | Embankment, Aerial, At-grade | Potential land conversion; Visual and noise effects |
| Philadelphia | BicyclePA Route E | 290* | 1 | <1% | Embankment, Aerial | Potential land conversion; Visual and noise effects | |
| East Coast Greenway | 160 | 1 | <1% | Embankment, Aerial, At-grade | Potential land conversion; Visual and noise effects | ||
| Heitzman Playground | 1 | 1 | 100% | Embankment, Aerial | Potential land conversion; Visual and noise effects | ||
| Part Disston Park | 20 | 10 | 50% | Embankment, Aerial | Potential land conversion; Potential acquisition; Visual and noise effects | ||
| Pennypack Creek Park | 1,330 | 1 | <1% | Embankment, Aerial | Potential land conversion; Potential acquisition; Visual and noise effects | ||
| Pennypack Trail | 40 | 1 | 3% | Aerial | Visual effects | ||
| Schuylkill River Water Trail | 520 | 1 | <1% | Major Bridge | Visual effects | ||
| Trenton & Auburn Playground | 1 | 1 | 100% | Trench | Potential land conversion; Visual and noise effects | ||
| Bucks | D & L Trail - Delaware Canal Towpath | 210 | 1 | <1% | Embankment, Aerial, At-grade | Potential land conversion; Visual and noise effects | |
| Delaware Canal | 910 | 1 | <1% | Embankment, Aerial, At-grade | Potential land conversion; Visual and noise effects | ||
| Total PA | 3,192 | 33 | 1% | ||||
| NJ | Middlesex | Merrill Park | 180 | 20 | 11% | Embankment | Potential land conversion; Potential acquisition; Visual and noise effects |
| Union | Merrill Park | 180* | 1 | <1% | Embankment | Potential land conversion; Visual and noise effects | |
| Total NJ | 180 | 21 | 12% | ||||
| TOTAL ALTERNATIVE | 64,098 | 299 | <1% |
Source: NEC FUTURE team, 2015
MA: Management Area
*Total Area not included in overall total to avoid double-counting.
** The total number of acres represents the total acreage of the resource, including acres outside and inside the Affected Environment of Alternative 3.
| State | County | Resource of Interest | Total Area of Resource (acres)* | Acres Affected under Alt 3 | % of Total Area Affected | Construction Type | Potential Impact |
|---|---|---|---|---|---|---|---|
| NY | Bronx | Edgewater Park | 5 | 1 | 20% | Aerial | Portion of park in route; Visual and noise effects |
| James A Young Memorial Park | 1 | 1 | 100% | At-grade | Potential land conversion; Visual and noise effects | ||
| Pelham Parkway | 80 | 1 | 1% | Embankment and At-grade | Potential land conversion; Visual and noise effects | ||
| Pelham Bay Park | 2,110 | 70 | 3% | Embankment, Aerial, At-grade | Potential land conversion; Potential acquisition; Visual and noise effects | ||
| Starlight Park | 15 | 10 | 67% | Aerial, At-grade, Major Bridge | Potential land conversion; Potential acquisition; Visual and noise effects | ||
| Westchester | Saxon Woods County Park | 690 | 30 | 4% | Embankment, Aerial, Trench | Potential land conversion; Potential acquisition; Visual and noise effects | |
| Silver Lake Preserve | 240 | 1 | <1% | Aerial | Portion of park in route; Visual effects | ||
| Total NY | 3,141 | 114 | 4% | ||||
| CT | Fairfield | Saugatuck River Water Access | 1 | 1 | 94% | Major Bridge | Portion of park in route; Visual effects |
| New Haven | George C. Waldo State Park Scenic Reserve | 150 | 1 | 2% | Aerial | Portion of park in route; Visual effects | |
| Total CT | 151 | 2 | <1% | ||||
| TOTAL ALTERNATIVE | 3,292 | 116 | 4% |
Source: NEC FUTURE team, 2015
*The total number of acres represents the total acreage of the resource, including acres outside and inside the Affected Environment of Alternative 3.
| State | County | Resource of Interest | Total Area of Resource (acres)* | Acres Affected under Alt 3 | % Total Area Affected | Construction Type | Potential Impact |
|---|---|---|---|---|---|---|---|
| NY | Queens | Daniel A Haggerty Park | 1 | 1 | 100% | Embankment, Aerial | Potential land conversion; Visual and noise effects |
| Forest Park | 540 | 20 | 4% | Aerial | Portion of park in route; Visual and noise effects | ||
| Jacob Riis Triangle | 1 | 1 | 100% | Embankment | Potential land conversion; Potential acquisition; Visual and noise effects | ||
| Prospect Cemetery | 5 | 1 | 20% | Aerial | Portion in route; Visual and noise effects | ||
| Nassau | Eisenhower County Park | 940 | 40 | 4% | Trench | Potential land conversion; Potential acquisition; Visual and noise effects | |
| Suffolk | Connetquot River State Park Preserve | 3,470 | 10 | <1% | Trench | Potential land conversion; Potential acquisition; Visual and noise effects | |
| Lakeland County Park | 70 | 1 | 1% | Trench | Potential land conversion; Potential acquisition; Visual and noise effects | ||
| South Setauket County Nature Preserve | 100 | 1 | 1% | Aerial | Visual effects | ||
| Total NY | 5,127 | 75 | 1% | ||||
| CT | Fairfield | Saugatuck River Water Access | 1 | 1 | 100% | Major Bridge | Portion of park in route; Visual effects |
| Total CT | 1 | 1 | 100% | ||||
| TOTAL ALTERNATIVE | 5,128 | 76 | 1% |
Source: NEC FUTURE team, 2015
*The total number of acres represents the total acreage of the resource, including acres outside and inside the Affected Environment of Alternative 3.
| State | County | Resource of Interest | Total Area (acres)* | Acres Affected under Alt 3 | % of Resource Area Affected | Construction Type | Potential Impact |
|---|---|---|---|---|---|---|---|
| CT | Tolland | Nathan Hale State Forest | 1,550 | 10 | 1% | Trench | Potential land conversion; Potential acquisition; Visual and noise effects |
| Windham | Airline State Park Trail | 200 | 1 | <1% | Embankment | Potential land conversion; Visual effects | |
| Natchaug State Forest | 12,600 | 25 | <1% | Embankment, Trench | Potential land conversion; Potential acquisition; Visual and noise effects | ||
| Total CT | 14,350 | 36 | <1% | ||||
| RI | Providence | Greenway | 104,570 | 98 | <1% | Embankment, Aerial, Major Bridge | Potential land conversion; Potential acquisition; Visual and noise effects |
| Killingly Pond MA/Bissel | 30 | 1 | 3% | Embankment | Potential land conversion; Potential acquisition; Visual and noise effects | ||
| Killingly Pond MA/Cate | 150 | 1 | 1% | Embankment | Potential land conversion; Potential acquisition; Visual and noise effects | ||
| Killingly Pond MA/Shippee | 370 | 10 | 3% | Embankment, Aerial | Potential land conversion; Potential acquisition; Visual and noise effects | ||
| Harris Preserve ASRI Natural Area | 50 | 1 | 2% | Embankment | Potential land conversion; Visual and noise effects | ||
| Snake Den State Park/Snake Den | 780 | 10 | 1% | Embankment | Potential land conversion; Potential acquisition; Visual and noise effects | ||
| Ten Mile River Greenway | 10 | 1 | 10% | Aerial, At-grade, Trench | Potential land conversion; Visual and noise effects | ||
| Total RI | 105,960 | 122 | <1% | ||||
| MA | Norfolk | Bay Circuit Trail | 1,125 | 1 | 0% | At-grade | Potential land conversion; Visual and noise effects |
| Norfolk County Canoe River Wilderness | 140 | 30 | 21% | Embankment, At-grade | Potential land conversion; Potential acquisition; Visual and noise effects | ||
| Total MA | 1,265 | 31 | 2% | ||||
| TOTAL ALTERNATIVE | 121,575 | 189 | <1% |
Source: NEC FUTURE team, 2015
*The total number of acres represents the total acreage of the resource, including acres outside and inside the Affected Environment of Alternative 3.
| State | County | Resource of Interest | Total Area (acres)** | Number of Acres Affected | Percentage of Park Area Affected | Construction Type | Potential Impact |
|---|---|---|---|---|---|---|---|
| CT | Tolland | Nipmuck State Forest | 9,540 | 1 | <1% | Embankment | Potential land conversion; Visual effects |
| Nye Holman State Forest | 930 | 10 | 1% | Aerial, Trench | Potential land conversion; Potential sliver acquisition; Visual effects | ||
| Windham | Nipmuck State Forest | 9,540* | 1 | <1% | Embankment, Aerial | Potential land conversion; Potential sliver acquisition | |
| Total CT | 10,470 | 12 | <1% | ||||
| MA | Worcester | Midstate Trail | 290 | 1 | <1% | Aerial | Portion in route along Route 9; Potential sliver acquisition; Visual effects |
| Quinsigamond State Park | 40 | 1 | 3% | Aerial | Portion in route along Route 9; Potential sliver acquisition; Visual effects | ||
| Total MA | 330 | 2 | 1% | ||||
| TOTAL ALTERNATIVE | 10,800 | 14 | <1% |
Source: NEC FUTURE team, 2015
*Total Area not included in overall total to avoid double-counting.
**The total number of acres represents the total acreage of the resource, including acres outside and inside the Affected Environment of Alternative 3.
Table 7.4-12 summarizes the potential environmental consequences of the proposed stations on parklands. The table lists only those locations where impacts would occur, and shows only those affected parks that are outside of the alignment of the existing NEC.
| State | County | Station ID/Type | Station Name | Alt. 1 | Alt. 2 | Alt. 3 |
|---|---|---|---|---|---|---|
| MD | Baltimore City | 9/New | Upton | 4 parks would be acquired
|
4 parks would be acquired
|
4 parks would be acquired
|
| 12/New | Broadway | 2 parks would be acquired
|
2 parks would be acquired
|
2 parks would be acquired
|
||
| PA | Delaware | 34/New | Baldwin | Potential partial acquisition of Bicycle Route/PA; potential noise and visual effects | Potential partial acquisition of Bicycle Route/PA; potential noise and visual effects | Potential partial acquisition of Bicycle Route/PA; potential noise and visual effects |
| NY | Bronx | 81/New | Co-op City | Potential partial acquisition of Pelham Bay Park; potential noise and visual effects | Potential partial acquisition of Pelham Bay Park; potential noise and visual effects | Potential partial acquisition of Pelham Bay Park; potential noise and visual effects |
| RI | Providence | 129/New | Providence Station H.S. | Potential partial acquisition of and visual and noise effects to:
|
Potential partial acquisition of and visual and noise effects to:
|
Potential partial acquisition of and visual and noise effects to:
|
Source: NEC FUTURE team, 2015
Note: Quantities of potential impacts associated with stations are not shown. Acreage has been calculated only for new stations and is provided in Appendix E, Section E.04.
H.S. = high speed
Alternative 1 contains over 1,900 parks in the Context Area, and Alternatives 2 and 3 contain over 2,000 parks in the Context Area. If the Representative Routes were to shift, it is likely that different parks as well as different acreages of the larger parks (those over 100 acres) within the Context Area would be encountered. A summary of the parks with large areas in the Context Area is provided below:
Within the Context Area for all of the Action Alternatives in Washington, D.C., there are five parks with 100 or more acres in the Context Area: Anacostia Park, the National Arboretum, National Mall, East Potomac Park, and West Potomac Park/Lincoln Memorial/Vietnam Veterans Memorial. All of the Action Alternatives and the existing NEC cross Anacostia Park and the National Arboretum; these parks extend south along the Anacostia River, away from the NEC. At its closest point, the National Mall is about 0.5 mile from all of the Action Alternatives and extends westward away from the NEC. Similarly, East and West Potomac Park are located roughly 2 miles south and west of the NEC.
In Maryland, some of the larger parks that cross more than one county include Patuxent River Park, Patuxent Research Refuge, Patapsco Valley State Park, and Gunpowder Falls State Park. Patuxent River Park is located less than 1 mile from the Representative Routes of the Action Alternatives on the south side, while the Patuxent Research Reserve extends north and east away from the Representative Routes of the Action Alternative for approximately 8 miles. The Patapsco Valley State Park spans a roughly 20-mile distance, end to end, on both sides of the Northeast Corridor. At the closest point, Alternative 3 crosses this park while the existing NEC simply runs alongside it. All Action Alternatives cross Patapsco Valley State Park. Like Patapsco Valley State Park, Gunpowder Falls State Park is approximately 15 miles from end to end, and the Representative Routes of all of the Action Alternatives weave between the parcels that comprise the park.
In Delaware, nine parks have over 100 acres in the Context Area for all of the Action Alternatives: White Clay Creek State Park, Middle Run Valley Natural Area, Iron Hill Park, Bellevue State Park, Alapocas Run State Park, White Clay Creek Wild and Scenic River, Banning Park, Brandywine Park, and Carousel Park. Unlike Maryland, most of these parks are located in the Context Area, but do not abut the Representative Routes. White Clay Creek State Park, Middle Run Valley Natural Area, and Carousel Park are in a cluster to the north and west of the Representative Routes of all the Action Alternatives at a distance of approximately 1 to 2 miles. Bellevue State Park, Alapocas Run State Park, and Brandywine Park are located in a second cluster about 1 mile to the north and west. White Clay Creek Wild and Scenic River has its headwaters in Pennsylvania approximately 15 miles northwest of the Representative Routes. The Representative Routes of all Action Alternatives cross branches of this designated river three times, as well as run immediately proximate to the south and east of Banning Park for 0.6 mile.
In Pennsylvania, seven parks are located across more than one county: Bicycle PA Route E, Cobbs Creek Park, East Coast Greenway, Eastwick Regional Park, John Heinz National Wildlife Refuge at Tinicum, Schuylkill River Water Trail, and Tidal Delaware Water Trail. Currently, Bicycle PA Route runs from the Pennsylvania-Delaware border to the Delaware River crossing at Trenton. Since this trail spans 52 total miles, it is unsurprising that it crosses the various Representative Routes five times. Bicycle PA Route E is largely to the south of the Representative Routes, though it crosses to the north of them in Lower Northeast Philadelphia. The East Coast Greenway follows a similar pattern, though it has a slightly different geometry in Central Philadelphia. The Schuylkill and Delaware River Water Trails are located along these two bodies of water. The existing NEC and Alternatives 1 and 2 cross the Schuylkill River Water Trail at major bridges over the river, while the Tidal Delaware Water Trail is crossed by the Representative Routes by an existing bridge. Alternative 2 crosses the John Heinz National Wildlife Refuge for 1.5 miles on the southeastern edge. Eastwick Regional Park is located almost exactly halfway between the existing NEC/Alternative 1 and Alternative 2 at a distance of approximately 0.5 mile on either side. Cobbs Creek Park is located less than 1 mile north-northwest of the existing NEC and extends approximately 5 miles away from the existing NEC.
In New York, 12 parks are located in more than one county: Astoria Athletic Field, Bethpage State Park, Bridge Park (George Washington), Cross Island Parkway, East River State Park, Field of Dreams Park, Hempstead Playground, Highland Park, Jackie Robinson Park, Laurelton Parkway, Pelham Bay Park, and Roberto Clemente State Park. All of these parks except Bethpage State Park and Roberto Clemente State Park are New York City parks. Eleven of the 12 parks are in a cluster near the border between Manhattan and the Bronx. Bethpage State Park is the only identified park on Long Island; it is located to the north of Alternative 3 at a distance of 0.25 mile.
In Connecticut, 12 parks are located across more than one county: Cockaponset State Forest, Farmington Canal Line State Park Trail, Hammonasset Beach State Park, Hop River State Park Trail, and Hammonasset Natural Area Preserve, Lake Lillinonah Water Access, Mansfield Hollow Wildlife Area, Quinnipiac River Water Access, and Trimountain State Park Scenic Reserve. The existing NEC runs through parcels of the Cockaponset State Forest but does not cross the park. The far-western section in New Haven County immediately abuts the Representative Route, but to the east, the park parcels are about 1 mile from the Representative Route. The Farmington Canal Line State Park Trail runs south to north and crosses Alternative 3 once in southern Hartford County. Hammonasset Beach State Park and Hammonasset Natural Area Preserve are clustered together less than 1 mile immediately south of the existing NEC. Hop River State Park Trail is a 20-mile trail that is crossed by Alternative 3. Two parcels make up Lake Lillinonah Water Access, the closest of which is 0.5 mile north of Alternative 3. Mansfield Hollow Wildlife Area is a large, nearly 2,400-acre park that is crossed by Alternative 3. The crossing occurs at the northwestern end of the park; the majority of it is located south and east of the Representative Routes. The Quinnipiac River Water Access comprises three smaller parcels; the northernmost parcel is located less than 1 mile off Alternative 3. Finally, Trimountain State Park Scenic Reserve is located about 2 miles east of Alternative 3 near the New Haven/Middlesex County border.
In Rhode Island, three parks are located across more than one county: Cranston Washington Secondary Bike Path, Greenway Trail, and Washington Secondary Bike Path. The Greenway Trail is a statewide recreational resource that crosses each Representative Route multiple times. The Cranston Washington Secondary Bike Path runs parallel to the existing NEC at a distance of between less than 1 to 2 miles. No Representative Routes crosses this trail feature. Similarly, the Washington Secondary Bike Path runs parallel to the existing NEC for 2 miles.
Within the Context Area for all Action Alternatives in Massachusetts, the Context Area contains 28 parks with over 100 acres. Borderland State Park is located in two counties - Bristol and Norfolk Counties. Borderland State Park is located approximately 1.4 miles directly east of the Representative Routes.
Parkland resources are unique in that they each may provide different recreational opportunities and activities. Potential mitigation should be based not only on the effect anticipated but also on the characteristics of the specific resource affected. Examples of potential mitigation strategies could include design or construction modifications to avoid conversion of a parkland resource, the use of context-sensitive design in future stages of project development, the incorporation of natural design features such as earthen berms and tree plantings, as well as allocation of replacement parkland or open space. In addition, fencing and other approaches could be implemented to protect the safety of those using the parkland.
Subsequent analysis conducted during the planning process for Tier 2 projects would further define the effects to parklands and wild and scenic rivers, including municipal and local parks. Additionally, effects on privately held or non-profit recreational areas and conservation lands, such as the Last Green Valley National Heritage Corridor, would be evaluated and considered. Information would be collected with regard to activities (e.g., passive or active uses) and potentially affected user groups. As part of Tier 2 studies, alternatives would be developed to avoid the use of parklands where feasible and prudent, in accordance with Section 4(f) of the Department of Transportation Act of 1966. Where use cannot be avoided, the Tier 2 analysis would include the development of mitigation measures and designs that would avoid or minimize effects on parklands and wild and scenic rivers. The analysis would be conducted in accordance with federal as part of the Section 4(f) and Section 6(f) evaluations (Chapter 7.16) and state regulations. The requirements for subsequent Tier 2 evaluations include compliance with the regulations listed in Table 2 of the Parklands and Wild and Scenic Rivers Effects-Assessment Methodology Report.
1 The FRA did not identify designated parkland uses for this Tier 1 EIS. Designated parkland uses would be identified during Tier II studies.
2 Sliver takes refers to a very narrow take on the fringes of a parkland resource.
The information posted on this website includes hypertext links or pointers to information created and maintained by other public and/or private organizations. The FRA provides these links and pointers solely for information and convenience. When users select a link to an outside website, they are leaving the NEC FUTURE website and are subject to the privacy and security policies of the owners/sponsors of the outside website. The FRA does not control or guarantee the accuracy, relevance, timeliness or completeness of information contained on a linked website, or endorse the organizations sponsoring linked websites, the views they express, or the products/services they offer. The FRA cannot authorize the use of copyrighted materials contained in linked websites and is not responsible for transmissions users receive from linked websites.