NEC FUTURE is a comprehensive planning effort to define, evaluate, and prioritize future investments in the Northeast Corridor (NEC) from Washington, D.C., to Boston. The NEC is the rail transportation spine of the Northeast and a key component of the region's transportation system. The NEC supports the operation of eight Regional rail authorities and Amtrak - the Intercity rail service provider - as well as four freight railroads.
The term "Intercity" is defined as passenger rail service between metropolitan areas. The term "interregional" describes travel flows that start and end in a different metropolitan area. "Interregional" and "Intercity" may be used interchangeably when referring to markets, passengers, trips, and passenger rail service.
"Regional" describes travel within a metropolitan area. "Regional rail" is defined as passenger rail service within the travel shed of a metropolitan area. "Regional rail" provides local and commuter-focused service characterized by a high-percentage of regular travelers. Regional rail is a broad term that reflects the expanded role of commuter railroads to also serve metropolitan travel needs throughout the day and beyond the work week.
The Federal Railroad Administration (FRA) launched NEC FUTURE in 2012 to evaluate improvements to address passenger rail transportation needs within the Study Area shown in Figure S-1. NEC FUTURE will result in a Passenger Rail Corridor Investment Plan (PRCIP) for the NEC that will establish a framework for future investment in the corridor through 2040 and beyond. The PRCIP comprises a Tier 1 Environmental Impact Statement (Tier 1 EIS) and a Service Development Plan (SDP). Together, these documents will provide a long-term vision for the role of passenger rail on the NEC in the regional transportation system and a phased investment plan to accomplish that vision.
This document is the Tier 1 Draft Environmental Impact Statement (Tier 1 Draft EIS) for the NEC FUTURE program. This Tier 1 Draft EIS was prepared in compliance with the National Environmental Policy Act (42 USC §4332 et seq.) and implementing regulations (40 CFR Parts 1500-1508) (NEPA), and other applicable laws and regulations. It presents the analysis completed by the FRA to assess the potential effects of NEC FUTURE rail investment alternatives on the economy, transportation system, and the human and natural environment within the Study Area. It provides information to inform the public and stakeholders about the findings of the analysis, and to help inform the FRA's decision on a Preferred Alternative for NEC FUTURE. Concurrent with the Tier 1 Draft EIS, the FRA is conducting a review of potential effects on historic properties under Section 106 of the National Historic Preservation Act. (Appendix G presents a Draft Programmatic Agreement under Section 106.)
The term "Tier 1" in the title of this document refers to a "tiered" approach to environmental review. NEPA provides the flexibility to assess projects in a staged approach known as "tiering," which addresses broad programs and issues in an initial (Tier 1) analysis, and analyzes site-specific, project-level (Tier 2) proposals and impacts in subsequent studies. The FRA determined that a Tier 1 EIS was the appropriate level of NEPA documentation for NEC FUTURE.
Both a Tier 1 EIS and project-level (or Tier 2) EIS follow the same process. The major difference is the level of detail and analysis that are presented. For a Tier 1 EIS, since the federal action is broad or programmatic in nature, the information required by decision-makers includes "big picture" constraints and opportunities. In this case, the proposed federal action being evaluated in this Tier 1 Draft EIS is the adoption of an investment program to improve passenger rail service within the Study Area. The Action Alternatives that the FRA examined in this Tier 1 Draft EIS represent various levels of investment in passenger rail.
If the FRA adopts an investment program, the projects would be implemented incrementally over the next few decades; the FRA will prepare a phasing and implementation plan in the SDP to be published after the Tier 1 Final EIS and Record of Decision. An example of a Tier 2 project that might take place would be adding a new bridge at an existing river crossing. A Tier 1 EIS identifies the train service a bridge will need to carry, but the specifics of the operations, bridge design, and localized impacts of that bridge are not identified. A subsequent Tier 2 project and NEPA process would focus on the specific design and construction of the bridge crossing and local impacts of that structure.
Figure S-1: Study Area Map
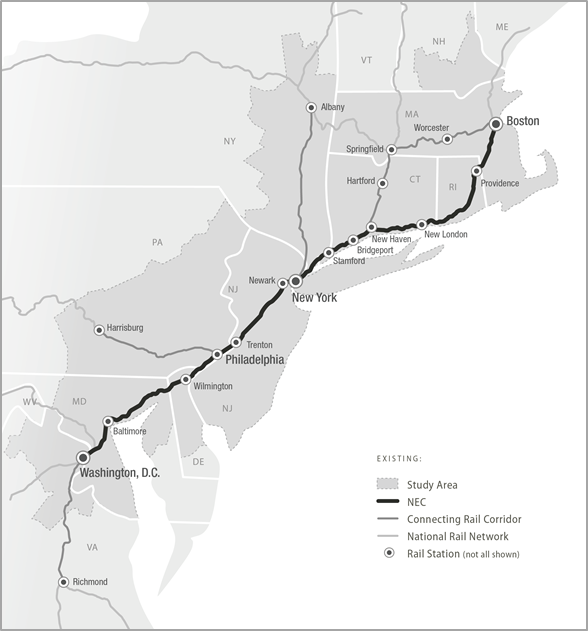
Source: NEC FUTURE, 2015
While NEC FUTURE focuses on passenger rail, it is important to understand the connectivity and interface of rail with other modes in the Northeast transportation network. Travelers within the NEC have multiple transportation options to move through and along it, including air, rail, automobiles, and buses. To better understand the role of rail within this transportation network, the FRA began by examining the role that rail service plays today in the Northeast transportation network and considering what role it could play in the future. These questions are fundamental to how the FRA has developed the rail alternatives being evaluated in this Tier 1 Draft EIS.
While NEC FUTURE is focused on passenger rail services, the investment program will be defined in a way that preserves current and planned service levels for freight railroad operations. Opportunities are also being considered to accommodate improvement of freight rail service within the NEC FUTURE Study Area.
Decisions about the future of the NEC affect a wide range of stakeholders, from today's rail passengers as well as the agencies and operators currently providing services on the NEC, to the residents, travelers, businesses, and communities potentially affected by the outcomes of NEC FUTURE. The FRA has conducted an extensive agency and public involvement process to engage these stakeholders and the public in the decision-making process for NEC FUTURE. This effort began with an agency and public scoping process in 2012 that elicited over 2,000 comments from 800 participants. These comments helped shape the alternatives that have been analyzed and the technical analyses conducted for this Tier 1 Draft EIS.
Rail transportation projects are typically sponsored by a locality, state, or railroad. However, the NEC covers a 457-mile corridor through eight states and Washington, D.C., and is used by multiple railroads that share the NEC's limited infrastructure. The FRA has sponsored NEC FUTURE to provide a uniform look at the NEC as a whole in order to ensure an integrated and prioritized approach to investments in the NEC that benefits not only all users and operators of the NEC, but that also promotes economic activity and environmental sustainability of the entire Northeast region of the Unites States. The FRA is serving as the lead federal agency for the Tier 1 EIS, working in coordination with other federal and state agencies and stakeholders, including the Federal Transit Administration, which is a Cooperating Agency to the NEPA process, the Northeast Corridor Infrastructure and Advisory Commission (NEC Commission), and the metropolitan planning organizations in the corridor.
The FRA has conducted a variety of public involvement activities, including 18 public meetings, six regional workshops, multiple webinars, direct outreach at 18 rail stations, presentations to interested organizations, and outreach to organizations and local officials representing Environmental Justice populations. Communication tools were developed to support the public outreach and environmental review process, including a comprehensive website, contact database, newsletters, fact sheets, and media outreach, including press advisories and media briefings. The information gained through agency and public engagement was used by the FRA team to better understand stakeholder concerns and to integrate information and ideas provided by the public and stakeholders into the work process.
Passenger rail services that operate along the NEC rail network are a critical component of the transportation system in the Study Area. By 2040, continued population and employment growth in the Study Area is expected to create increasing demand for travel options across the passenger transportation system - rail, air, auto, transit, and intercity bus. Yet the aging infrastructure and capacity limitations of the NEC already result in congestion and delays for daily commuters and for regional 1 and interregional2 travelers. Forecast growth in population and employment in the Study Area will put increasing pressures on this already constrained NEC rail network.
The 457-mile NEC and its connecting rail corridors3 form the most heavily utilized rail network in the United States. The NEC ranks among the busiest rail corridors in the world, moving more than 750,000 passengers every day4 on 2,200 trains.5 Freight operators share the NEC with passenger railroads and are responsible for the movement of over 350,000 car loads of freight per year on the NEC.6 This volume of traffic and diversity of service today operates on an NEC with capacity constraints that require scheduled and real-time trade-offs in frequency, speed, and performance of passenger and freight services. The congestion caused by these capacity constraints limits operations and opportunities to improve or expand passenger rail services. The NEC's aging infrastructure further limits operations and constrains the ability to improve and expand services. This infrastructure, in many cases built over 100 years ago, does not provide the resiliency or redundancy necessary to respond to unanticipated natural disasters or other disruptive events.
Growth in population and employment in the region, combined with changes in travel preference, will increasingly require a level of service and connectivity that cannot be supported by the existing NEC infrastructure. Challenges to passenger rail travelers today include poorly coordinated transfers and unattractive service frequencies, which make other travel choices more appealing. A well-defined and coordinated investment program to support both preservation and enhancement of the NEC is essential to meet the needs of the NEC's passenger and freight markets in the coming decades. A rail transportation system that better connects residents and visitors with established and growing business centers in the Study Area is critical to the economic health of the region.
The following is the statement of Purpose and Need adopted for the NEC FUTURE Tier 1 EIS:
The purpose of the NEC FUTURE program is to upgrade aging infrastructure and to improve the reliability, capacity, connectivity, performance, and resiliency of future passenger rail service on the NEC for both Intercity and Regional trips, while promoting environmental sustainability and continued economic growth.
Overall needs addressed by NEC FUTURE include aging infrastructure, insufficient capacity, gaps in connectivity, compromised performance, and lack of resiliency. These needs are essential to support the reliability of the passenger rail system. In addition, there is a need to promote environmental sustainability and economic growth. These needs are summarized below:
In addressing the overall needs of aging infrastructure, insufficient capacity, gaps in connectivity, compromised performance, and lack of resiliency, the FRA is committed to the NEC FUTURE Action Alternatives promoting environmental sustainability and continued economic growth:
In developing the alternatives for evaluation in this Tier 1 Draft EIS, the FRA considered a broad spectrum of future possibilities to meet the Purpose and Need. The unique geographic, technical, and institutional complexity of NEC FUTURE led the FRA to an innovative approach to developing and evaluating alternatives, focused on analysis of markets and services. This process is described in greater detail in various alternatives documents, including the Initial Alternatives Report, Preliminary Alternatives Report, Preliminary Alternatives Evaluation Report, and Tier 1 EIS Alternatives Report (see Appendix B).
The FRA began the evaluation of alternatives with an initial list of 98 rail market and service options, developed through extensive outreach with the NEC FUTURE stakeholders, the Northeast Corridor Infrastructure and Operations Advisory Commission (NEC Commission), and the general public. These Initial Alternatives were then organized into 15 Preliminary Alternatives representative of the broad spectrum of approaches that could be used to serve existing and new markets in the region. (See Appendix B, Preliminary Alternatives Evaluation Report, for additional information regarding the Preliminary Alternatives and their evaluation.) The FRA considered whether and how the Preliminary Alternative met the Purpose and Need, and analyzed their benefits in terms of ridership, travel time, service quality, and performance (for those that included second-spine route options). Based on this analysis, the FRA repackaged the Preliminary Alternatives to form the alternatives analyzed in this Tier 1 Draft EIS.
The FRA is considering three Action Alternatives that represent unique visions for the role of rail in the transportation system of the Northeast, and enable a broad analysis of benefits and impacts in the Tier 1 Draft EIS. The FRA compared the Action Alternatives to a No Action Alternative using ridership and service planning characteristics estimated with models customized for this effort. The transportation effects, economic effects, and environmental assessment of the Action Alternatives are presented in Chapters 5, 6, and 7, respectively.
The No Action Alternative represents an NEC in 2040 that would operate at today's service levels, which are defined as the number of trains per hour by operator9 and type of service. The No Action Alternative is a normalized baseline used to understand the consequences of continuing to invest in and operate the NEC as it is today, particularly in comparison with Action Alternatives. The No Action Alternative does not allow for increased peak-hour rail service but does allow for some modest increases in off-peak service, where there may be some existing unused capacity. The No Action Alternative does not increase or significantly change capacity, speeds, or the markets served. Instead, it makes annual investments in programmed and funded major projects and in maintaining existing infrastructure sufficient to operate today's level of rail service, but falls short of achieving a corridor-wide state of good repair.
Alternative 1 maintains the role of rail as it is today, keeping pace with the level of rail service required to support growth in population and employment. Future service plans developed by the NEC service operators were also examined to assess projected increases in travel demand that were assumed by the service operators. To keep pace with the demand generated by the region's growing population and employment, Alternative 1 includes new rail services and commensurate investment in the NEC to expand capacity, add tracks, and relieve key chokepoints, particularly through northern New Jersey, New York, and Connecticut. Figure S-2 shows the principal infrastructure investments included in Alternative 1.
Alternative 2 grows the role of rail, expanding rail service and passenger use at a faster pace than the growth in regional population and employment. The existing NEC generally expands to four tracks, with six tracks through portions of New Jersey and southwestern Connecticut. South of New Haven, CT, service and infrastructure improvements are focused generally within the existing NEC. However, as shown in Figure S-3, north of New Haven, Alternative 2 adds a new supplemental, two-track route between New Haven and Hartford, CT, and Providence, RI, to increase resiliency, serve new markets, reduce trip times, and address capacity constraints.
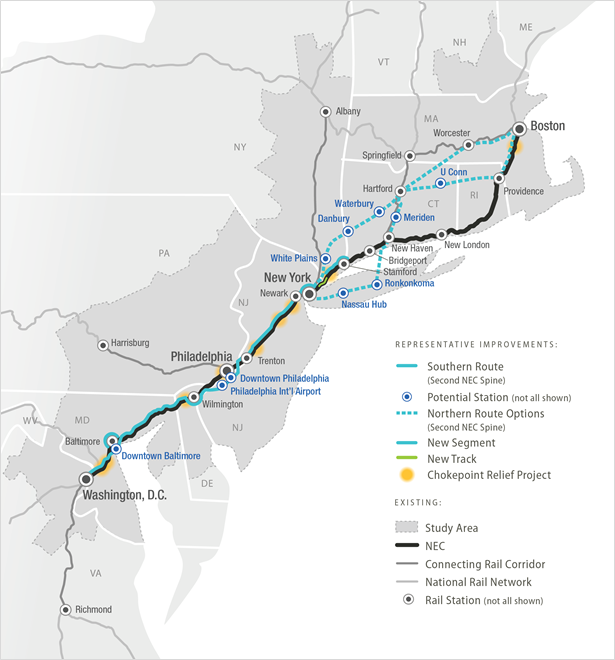
Alternative 3 transforms the role of rail, positioning it as a dominant mode for Intercity travelers and commuters across the NEC. Service and infrastructure improvements include upgrades on the existing NEC and the addition of a two-track second spine within the Study Area. This new spine supports high-performance rail services between major markets and provides additional capacity for anticipated growth.
In Alternative 3, four route options are under consideration for the northern portion of the second spine, as shown in Figure S-4. These options include routings via Central Connecticut/Providence, Long Island/Providence, Long Island/Worcester, and Central Connecticut/ Worcester. In addition to comparing each Action Alternative against the No Action Alternative, the evaluation of alternatives in the Tier 1 Draft EIS includes comparisons of these route options as part of Alternative 3.
Figure S-2: Alternative 1 (Chokepoint, New Track, and New Segment Locations)
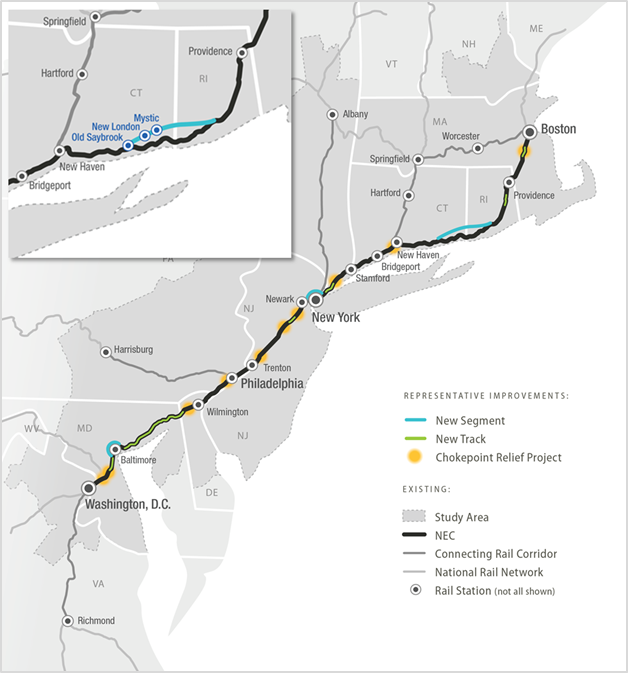
Figure S-3: Alternative 2 (Chokepoint, New Track, and New Segment Locations)
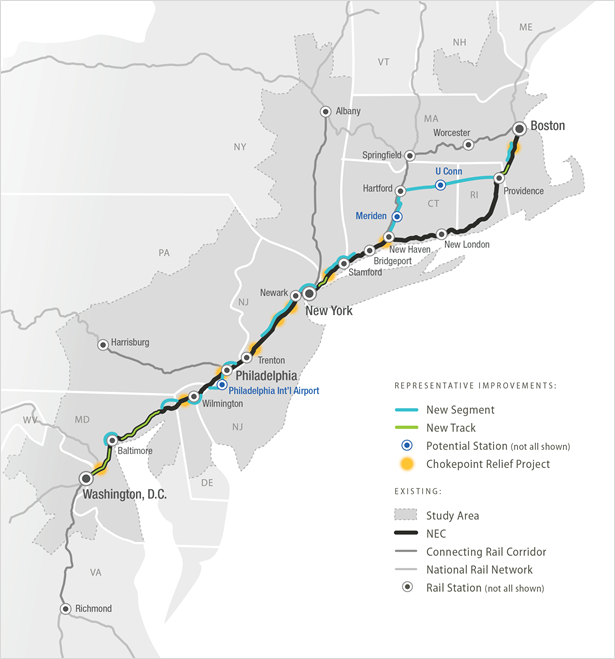
Figure S-4: Alternative 3 (Chokepoint, New Track, and New Segment Locations)
The No Action and Action Alternatives incorporate assumptions about the mix of service types to be provided. For NEC FUTURE, the FRA categorized passenger rail service into two types: Intercity and Regional rail.
Intercity is passenger rail service between cities or metropolitan areas, operating at speeds and distances greater than that of Regional rail. Intercity serves large, mid-size, and selected smaller markets, with station stops typically every 10 to 25 miles. Intercity is further categorized into two service sub-types:
Regional rail is service within a single metropolitan area to local markets with station stops typically every 2 to 10 miles. Regional rail trains provide local and commuter-focused service characterized by relatively low fares and a high percentage of regular travelers.
Chapter 4, Alternatives Considered, provides additional detailed information about the mix of service types included in each Action Alternative, as well as stations served and assumptions about the level of service by station. A hierarchy of station types was defined for this effort, including Major Hub, Hub, and Local stations. Major Hubs serve the largest markets in the Study Area and have a full complement of rail service types; Hub stations offer some Intercity service, and Local stations only offer Regional rail service. Each Action Alternative includes new stations, station upgrades (e.g., Local to Hub, Local to Major Hub, and Hub to Major Hub), and physical improvements to stations.
While each Action Alternative has a distinct vision for the NEC, they all include common elements that address the following to varying degrees:
As documented in Chapter 11, Agency and Public Involvement, in defining a long-term vision for the role of passenger rail on the NEC, the FRA actively sought stakeholder and public input via an early and proactive outreach process. The overwhelming message received is that the users of the NEC are seeking reliable, integrated, and expanded train service to meet both Intercity and Regional rail travel needs. As such, the FRA focused on Action Alternatives that meet that Purpose and Need by improving steel-wheel passenger train technology that is used today by all the railroads sharing the NEC, including both Intercity and Regional rail operations, as well as freight service.
Given the accelerating pace of change in consumer technology, business practices and transportation patterns, application of future emerging and new technologies may help to support rail service on the NEC and meet other transportation needs across the region. These might include new information systems and services, new train propulsion and guideway systems, fare collection innovations, and safety enhancements. An advanced guideway system, such as magnetic levitation technology, could possibly be used to develop a second spine or portions thereof as envisioned in Alternative 3. Such technologies could be studied separately, and are not precluded as future transformative investments in the regional transportation system. Other potential applications of new technology transportation systems could support the NEC passenger rail network by connecting off-corridor markets to the NEC, or a major market to the NEC.
The FRA has performed an extensive analysis of each Action Alternative and the No Action Alternative as a basis for an alternatives evaluation. As described in separate chapters of this Tier 1 Draft EIS, these analyses consider transportation effects, economic effects, environmental consequences, and construction effects, as well as capital and operations and maintenance costs. A variety of indicators and metrics are presented for each topic and used to compare each Action Alternative with the No Action Alternative. A cross-cutting evaluation links these findings to the needs defined in the Purpose and Need statement.
This summary briefly describes each of the analyses performed and highlights several key findings. However, the reader is referred to the appropriate chapters within this Tier 1 Draft EIS for additional context, details, and conclusions.
The No Action and Action Alternatives would result in both positive and negative effects to the multimodal transportation network within the Study Area. Chapter 5, Transportation Effects, describes the transportation effects of the Action Alternatives. A summary of these findings is presented below.
Each of the Action Alternatives creates new connections and travel options within the Study Area. Alternatives 2 and 3 provide service to new off-corridor markets. By providing more travel options, the Action Alternatives generate significantly greater Intercity and Regional rail ridership compared to the No Action Alternative: the greater the improvement in frequency of service, types of services, travel times, and the number of metropolitan areas connected to the rail network, the higher the projected ridership.
The Action Alternatives also improve connectivity at Intercity stations by increasing the daily duration of rail service at many stations, making rail service available for longer periods of the day and hence more convenient to travelers. Alternatives 2 and 3 include service frequencies and daily durations of service that are more robust than the No Action Alternative, which expand mobility options for travelers and improve the attractiveness of passenger rail as a travel choice. The Action Alternatives result in more convenient passenger rail with increased service frequency at many Regional rail and Intercity stations. The greatest change in trip frequencies between stations is possible with the capacity and travel-time improvements included in Alternative 3.
As the frequency of service, types of services, and travel times improve with the Action Alternatives, passenger rail ridership increases. Table S-1 shows the number of trips for all passenger rail service types predicted for the No Action and Action Alternatives, and Table S-2: highlights the anticipated passenger rail trips by Alternative 3.
| Mode | No Action Alternative | Alternative 1 | Change vs. No Action (%) | Alternative 2 | Change vs. No Action (%) | Alternative 3 (average) | Change vs. No Action (%) |
|---|---|---|---|---|---|---|---|
| Intercity | 19,300 | 33,700 | 75% | 37,100 | 92% | 39,000 | 102% |
| Regional rail | 419,800 | 474,500 | 13% | 495,400 | 18% | 545,500 | 30% |
Source: NEC FUTURE Travel Demand Model, April 2015
| Service Type | via Central CT / Providence (3.1) | via Long Island / Providence (3.2) | via Long Island / Worcester (3.3) | via Central CT / Worcester (3.4) |
|---|---|---|---|---|
| Intercity | 38,900 | 38,700 | 39,800 | 38,600 |
| Regional rail | 545,500 | 545,500 | 545,500 | 545,500 |
| TOTAL | 584,500 | 584,200 | 585,300 | 584,100 |
Source: NEC FUTURE Travel Demand Model, April 2015
In the No Action Alternative, approximately 439 million passenger rail trips are predicted, while in Alternative 3, there are 579-580 million passenger rail trips predicted, an increase of 32 percent compared to the No Action Alternative. The greatest growth is predicted for Regional rail tripmaking, which is the dominant passenger rail travel type, even within the No Action Alternative. Regional rail ridership shows steady gains in all Action Alternatives compared to the No Action Alternative, as capacity grows to support more robust peak-hour and off-peak service.
The construction and operation of the rail improvements and services in the No Action and Action Alternatives would result in changes to economic activity throughout the Study Area. Some changes would be immediate, while others would take place over a long period of time. These economic effects include Economic Development Response, Travel Market Effects, Construction and Rail Sector Employment Effects, and Indirect Effects associated with potential economic growth, as summarized below.
Economic Development Response
The Action Alternatives accommodate greater numbers of rail travelers and allow these travelers to make their trips faster and to a greater variety of destinations within and between the urban economies that line the corridor. The expansion of regional travel choices would allow households to access a greater range of employment and leisure options via rail from their home location - thereby improving quality of life. Businesses gain access to a larger, more diverse, and specialized pool of labor - thereby increasing productivity. The Action Alternatives would also accommodate a greater flow of people between major commercial centers and metropolitan areas.
Travel Market Effects
Changes in mobility and connectivity proposed for each Action Alternative can be monetized to estimate the economic effects of transportation improvements as a function of travel time and cost savings as well as other factors such as safety and air quality impacts. The Action Alternatives offer faster travel times for many existing rail-served markets, expand service to markets not currently served, and offer a greater range of pricing.
Construction and Rail Sector Employment Effects
Indirect Effects
Across the Action Alternatives, the Greater New York-North Jersey, Greater Philadelphia, and Greater Baltimore markets have the greatest gains in station connectivity. These markets have the greatest gains under Alternative 3 as compared to other Action Alternatives. Moreover, each Action Alternative gains one or more hub stations, which are focal points for development in the surrounding area. Hubs support greater development intensity than stations with just rail service. These stations have potential for indirect effects to occur as a result of induced growth.
The FRA analyzed the effects of each Alternative on the resources shown in Table S-3. For each resource, an Affected Environment was studied to assess potential for impact and was defined generally as a "swath" of land centered on the Representative Route for each Action Alternative. Some potential environmental effects are due to changes in the physical footprint of the rail infrastructure, while others are due to changes in the type and volume of passenger rail service associated with each Action Alternative. The environmental effects assessment is based on readily available secondary source data, including geographic information system (GIS) data, published reports, and technical analyses. No field investigations occurred as part of this analysis.
| Resource | Description of Resource | Affected Environment |
|---|---|---|
| Land Cover | Land cover within the Affected Environment | ½-mile-wide swath centered on the Representative Route for each Action Alternative |
| Agricultural Lands (Prime Farmlands and Timberlands) | Prime farmland and timberlands | 2,000-foot-wide swath centered along Representative Route for each Action Alternative |
| Parklands and Wild and Scenic Rivers | Publicly owned parklands; parklands receiving funding from the Land and Water Conservation Fund Act; Rivers identified as Wild and Scenic by the National Rivers Inventory within the Affected Environment | 2,000-foot-wide swath centered along Representative Route for each Action Alternative |
| Hydrologic/Water Resources | Coastal zones and saltwater wetlands, freshwater resources (including wetlands), and floodplains | 2,000-foot-wide swath centered on the Representative Route |
| Ecological Resources | Critical habitats and federally listed Threatened & Endangered Species | 3,000-foot-wide swath centered along Representative Route for each Action Alternative |
| Geologic Resources | Soil, geological, groundwater and topographic resources | 3,000-foot-wide swath centered along Representative Route for each Action Alternative |
| Hazardous Waste and Contaminated Material Sites | Known sources and potential suspected sources of contaminated and hazardous materials | 2-mile-wide swath centered along Representative Route for each Action Alternative |
| Cultural Resources and Historic Properties | Resources listed in or eligible for listing in the National Register of Historic Places within the Affected Environment or identified as significant by Indian Tribes | 1-mile-wide swath centered along Representative Route for each Action Alternative |
| Visual and Aesthetic Resources | Prominent visual resources and aesthetic qualities within the Affected Environment | 1-mile-wide swath centered along Representative Route for each Action Alternative |
| Environmental Justice | Minority and low-income populations within the Affected Environment | 1-mile-wide swath centered along Representative Route for each Action Alternative |
| Noise and Vibration | Ambient noise and vibration conditions, and noise-sensitive land cover categories | 5,000-foot-wide swath centered along Representative Route for each Action Alternative |
| Air Quality (including greenhouse gas emissions) | Current attainment status for criteria pollutants established by the U.S. Environmental Protection Agency for air-sheds within the Study Area | Determined by metropolitan planning organization by state within the Study Area |
| Energy | Energy consumed, particularly by the transportation sector | Entire Study Area |
| Climate Change and Adaptation (excluding greenhouse gas emissions) |
Identification of areas susceptible to the impacts of climate change (sea-level rise, storm surge and/or extreme heat and cold events) | For flood hazards: 2,000-foot-wide swath |
| For extreme heat and cold events: Entire Study Area | ||
| Section 4(f) and Section 6(f) Resources | Parklands converted to transportation use, including publicly owned public parks, recreation areas, and wildlife/waterfowl refuges | 2,000-foot-wide swath centered along Representative Route for each Action Alternative |
| Converted lands or facilities that were acquired with Land and Water Conservation Fund Act funds | ||
| Historic resources converted to transportation use, including historic sites of local, state or national significance (eligible or listed) | 1-mile-wide swath centered along Representative Route for each Action Alternative | |
| Electromagnetic Fields and Electromagnetic Interference | Electromagnetic Fields (EMF) associated with electric conventional or high-speed train operations and electromagnetic interference that occurs when EMFs are produced | 2,000-foot-wide swath centered on Representative Route for each Action Alternatives |
| Safety | Operational, infrastructure and overall modal safety | Entire Study Area |
| Public Health | Potential public health-related effects for each of the relevant Tier 1 Draft EIS resource areas | As per the resource areas |
| Cumulative Effects | Combined result of the incremental direct and indirect effects of the Tier 1 Draft EIS Action Alternatives as well as the effects of other past, present, and reasonably foreseeable future actions, regardless of agency, on key resources | Study Area, expanded to include connecting corridors |
1. Chapter 5 addresses transportation effects and Chapter 6 addresses economic effects and growth.
In general, impacts on environmental resources are greatest in areas where the Representative Route goes off-corridor, away from the existing NEC. These areas are often less developed than the current NEC. However, some impacts do exist to resources located along and within the existing NEC right-of-way. All Action Alternatives include improvements to the existing NEC; therefore, all effects-assessments consider potential effects that occur to both the existing NEC and any proposed off-corridor routing.
While all environmental factors are important, some have greater potential to influence the identification of a Preferred Alternative as they are tied to Executive Orders, environmental laws, regulations and regulatory requirements, including but not limited to Executive Order 12898 (Federal Actions to Address Environmental Justice in Minority Populations and Low-income Populations), Section 404 of the Clean Water Act, Section 106 of the National Historic Preservation Act, Section 7 of the Endangered Species, and Section 4(f) of the U.S. Department of Transportation Act. Some of these laws require avoidance of impacts or selection of an alternative that has the least environmental impact. At a Tier 1 level of assessment, site-specific constructability or feasibility factors are unknown. The FRA is considering key effects on resources that could result from implementation of an Action Alternative and key findings from the NEC FUTURE analysis in deciding on a Preferred Alternative for the NEC FUTURE program, including:
The No Action Alternative includes projects and transportation improvements that range in scope and complexity. Most of the projects and activities included as part of the No Action Alternative occur within the existing NEC right-of-way. Under the No Action Alternative, passenger rail service along the NEC operates and provides approximately the same level of service as provided today. As a result, "service-related" effects on noise and vibration would be unlikely. However, service-related effects on air quality could result due to increased congestion on the overall multi-modal transportation network. "Footprint" effects on environmental resources under the No Action Alternative would vary, depending on the scope of the project being implemented. In a few cases, projects that are part of the No Action Alternative have footprints and effects that extend beyond the existing NEC right-of-way. Those types of projects, depending on the scope and complexity, have a greater potential to affect environmental resources than those activities occurring within the existing NEC right-of-way. However, the majority of passenger rail projects included in the No Action Alternative occur within the existing NEC right of way.
A range of benefits and impacts would occur with each of the Action Alternatives since each proposes varying degrees of both service and infrastructure improvements. As such, benefits and impacts associated with each Action Alternative would differ due to the level of service and infrastructure proposed. All Action Alternatives would result in the following:
Each Action Alternative provides for improvements that may affect environmental resources. Table S-4 identifies the key findings for the key resources by Action Alternative.
| Resource | Alternative 1 | Alternative 2 | Alternative 3 |
|---|---|---|---|
| Land Cover |
|
|
|
| Parklands |
|
|
|
| Hydrologic |
|
|
|
| Ecological | Under all Action Alternatives:
|
||
| Environmental Justice (Counties with EJ populations with highest number environmental impacts) |
|
|
|
| Cultural/Historic Properties (total # of NRHP and NHL sites within Representative Route, and key cultural/historic property(ies) affected) |
|
|
|
| Climate Change (Counties that have or are proposed to have rail assets in areas at highest risk of inundation) |
|
|
|
Source: NEC FUTURE team, 2015
1. Ecologically
Sensitive Habitat (ESH) is a term for those areas dedicated to conserving
and maintaining biological diversity and natural resources, such as
national wildlife refuges, parks, or forests. Other natural areas (such
as wetlands, streams, and coastal areas) can also be considered ecologically
sensitive. Federal or state agencies do not designate ESHs.
2.Federally
listed Threatened and Endangered (T&E) species are vulnerable to
endangerment in the near future or are in imminent danger of becoming
extinct due to the loss of habitat or the decline in population numbers.
For some T&E species, federal agencies designate and protect critical
habitats.
3.Essential Fish Habitat (EFH) comprise all aquatic habitats
where fish spawn, breed, feed, or grow to maturity. These habitats include
wetlands, coral reefs, sea grasses, and rivers.
The Action Alternatives involve construction of significant rail infrastructure - tunnels, bridges, embankments, stations, and ancillary roads and support facilities - across the Affected Environment over an extended time period. Since detailed project design and construction information is not available at the Tier 1 level of analysis, the FRA developed potential construction types based on available conceptual information for each Action Alternative.
Six construction types comprise the potential infrastructure associated with all of the Action Alternatives: tunnel, trench, at-grade, embankment, aerial structure (bridges and viaducts), and major bridge. The FRA considered existing NEC construction features, as well as land use, topographic and other environmental features, and cost in developing the construction types. Figure S-5 describes the percentage of construction types by route distance for the existing NEC and each Action Alternative.
As presented in Figure S-5, the route miles by construction type for Alternatives 1 and 2 are similar to the existing NEC, with the exception of additional tunnel route miles as part of Alternatives 1 and 2. For Alternative 3, the route miles by construction type increase for tunnel, aerial structure, and trench, along with a decrease in embankment and at-grade route miles.
Regardless of the alternative selected, minimizing construction impacts on on-going rail operations can be best planned and achieved through the packaging of projects into multiple phases of the Selected Alternative. Through such phasing, individual projects can be timed to meet a number of important objectives. These include optimizing the benefits across the NEC of complementary capacity and travel-time projects, balancing the demand on resources, and spacing projects to take maximum advantage of construction outages and minimize adverse impacts on on-going train operations. The SDP will include a full phasing plan for the Selected Alternative that seeks to achieve these benefits.
Figure S-5: Percentage of Route Miles by Construction Type - Washington, D.C., to Boston, MA
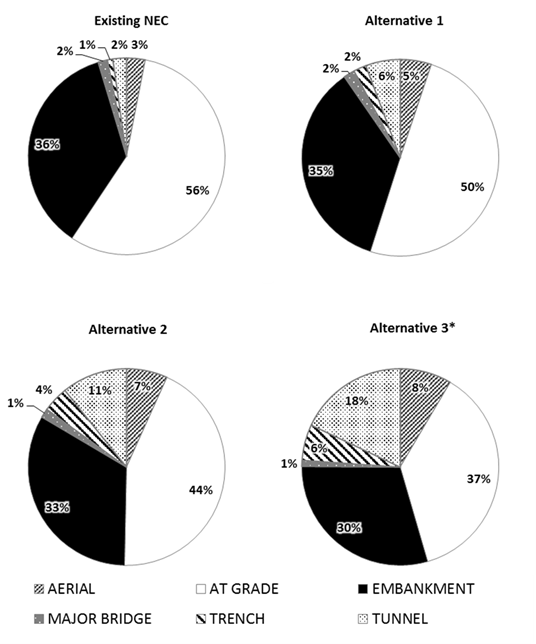
* The percentage of route miles shown in Alternative 3 is the average route miles by construction type for all route options between Washington, D.C., and Boston, MA.
Capital cost estimates were developed to understand the differences between the No Action Alternative and the Action Alternatives. An estimate of the capital cost of the No Action Alternative is $19.9 billion in 2014 dollars. This includes $8.35 billion in funded projects, $980 million in funded and unfunded mandates, and $10.53 billion in unfunded projects that are necessary to keep the railroad operating. The estimated $9 billion cost of the first two types of projects (funded or mandated projects) is also included in each of the Action Alternatives. The No Action Alternative may have additional costs from emergency or unplanned repairs since the corridor will remain at heightened risk of service disruption and unpredictable failures. These additional costs are not accounted for in the estimate.
Table S-5 provides estimates of the capital cost of each Action Alternative. The capital cost of Alternative 1 is estimated at between $64 billion and $66 billion in 2014 dollars; Alternative 2 is estimated at $131 billion to $136 billion, and Alternative 3 is estimated at $267 billion to $308 billion. The large range for Alternative 3 is due to the difference in cost associated with each route option, as shown in Table S-6.
| Category | Alternative 1 (range) | Alternative 2 (range) | Alternative 3 (range) |
|---|---|---|---|
| Infrastructure | $52-54 | $116-$121 | $252-$293 |
| Vehicles | $3 | $5 | $6 |
| Subtotal | $54-$57 | $122-$127 | $257-$299 |
| No Action Alternative Projects | $9 | $9 | $9 |
| TOTAL | $64-$66 | $131-$136 | $267-$308 |
Source: NEC FUTURE team, 2015
Notes:
Infrastructure costs include professional services. Cost does not include
property acquisition costs for yards or stations. Each of the Action
Alternatives includes the $9 billion cost associated with the No Action
Alternative projects.
| Category | Central Connecticut/ via Providence | Long Island/ via Providence | Long Island/ via Worcester | Central Connecticut/ via Worcester |
|---|---|---|---|---|
| Infrastructure | $267-$279 | $252-$262 | $265-$276 | $281-$293 |
| Vehicles | $6 | $6 | $6 | $6 |
| Subtotal | $273-$285 | $257-$268 | $271-$281 | $286-$299 |
| No Action Alternative Projects | $9 | $9 | $9 | $9 |
| TOTAL | $283-$294 | $267-$277 | $280-$291 | $296-$308 |
Source: NEC FUTURE team, 2015
Notes:
Infrastructure costs include professional services. Cost does not include
property acquisition costs for yards or stations.
The FRA also estimated annual operating and maintenance costs for each alternative. In the No Action Alternative and in Alternative 1, annual Intercity operating revenue is estimated at approximately $2 billion and O&M costs at $1 billion. In Alternatives 2 and 3, annual operating revenue would be approximately $3 billion and O&M costs approximately $2 billion. Surplus net operating revenues from Intercity service would be realized in each alternative and would range from an estimated $500 million to $1 billion annually.
Table S-7 summarizes the factors and metrics discussed in this Summary and in Chapter 9 of the Tier 1 Draft EIS the FRA used to evaluate the similarities and differences between the No Action and Action Alternatives. Metrics such as service frequency, capacity, and annual passenger trips increase as the level of investment and service improvements increase, demonstrating the range of possibilities for the role of rail in the Study Area. Table S-7 illustrates the overall potential for improved mobility and economic growth. Metrics that capture changes in service frequency and travel times demonstrate how each Action Alternative would change travel from a local perspective. Both the end-to-end and local (sub-region or city-pair) perspectives are important in considering the benefits and costs of the No Action and Action Alternatives.
| Project Needs Addressed | Metrics for Evaluating | No Action | Alternative 1 | Alternative 2 | Alternative 3 (average) |
|---|---|---|---|---|---|
| Aging Infrastructure |
|
NO | YES | YES | YES |
| Capacity |
|
Washington: 6 Hudson River:24 Boston: 11 |
Washington: 12 Hudson River: 37 Boston: 17 |
Washington: 20 Hudson River: 52 Boston: 22 |
Washington: 24 Hudson River: 70 Boston: 24-32 |
|
- | 2X the No Action | 3X the No Action | 5X the No Action | |
|
WAS: 6,610 Hudson: 30,374 Boston: 9,562 |
WAS: 9,615 Hudson: 44,993 Boston: 13,528 |
WAS: 11,173 Hudson: 61,280 Boston: 14,682 |
WAS: 12,403 Hudson: 71,111 Boston: 18,480 |
|
|
439,100 | 508,200 | 532,500 | 584,500 | |
|
19,300 | 33,700 | 37,100 | 39,000 | |
|
419,800 | 474,500 | 495,400 | 545,500 | |
|
13,957,565 | 17,640,308 | 19,142,079 | 20,710,292 | |
|
3,103,000 | 5,610,200 | 6,232,400 | 6,565,500 | |
|
11,264,400 | 12,547,100 | 13,455,800 | 14,713,900 | |
|
N/A | -2,000 | -2,600 | -3,100 | |
|
- | 36% | 44% | 46% | |
| Connectivity |
|
BWI: 141 PHL: 72 EWR: 152 T.F. Green: 25 |
BWI: 252 PHL: 72 EWR: 240 T.F. Green: 81 |
BWI: 386 PHL: 308 EWR: 364 T.F. Green: 74 |
BWI: 450 PHL: 374 EWR: 414 T.F. Green: 101 |
|
- | WAS-NJ/NY: 83 NJ/NY-BOS: 216 PHL-BOS: 42 |
WAS-NJ/NY: 164 NJ/NY-BOS: 274 PHL-BOS: 47 |
WAS-NJ/NY: 225 NJ/NY-BOS: 248 PHL-BOS: 45 |
|
|
WAS-NYC: 36 NYC-BOS: 19 |
WAS-NYC: 70 NYC-BOS: 47 |
WAS-NYC: 96 NYC-BOS: 88 |
WAS-NYC: 150 NYC-BOS: 143 |
|
|
|
|
|
|
|
|
|||||
|
Odenton: 0 PHL Airport: 0 Secaucus: 0 Providence: 38 |
Odenton: 44 PHL Airport: 0 Secaucus: 0 Providence: 98 |
Odenton: 92 PHL Airport: 92 Secaucus: 108 Providence: 198 |
Odenton: 112 PHL Airport: 86 Secaucus: 174 Providence: 167 |
|
|
Odenton: 59 PHL Airport: 72 Secaucus: 367 Providence: 74 |
Odenton: 108 PHL Airport: 72 Secaucus: 522 Providence: 84 |
Odenton: 164 PHL Airport: 216 Secaucus: 722 Providence: 104 |
Odenton: 188 PHL Airport: 288 Secaucus: 970 Providence: 140 |
|
|
Odenton: 59 PHL Airport: 72 Secaucus: 367 Providence: 74 |
Odenton: 152 PHL Airport: 72 Secaucus: 522 Providence: 182 |
Odenton: 256 PHL Airport: 308 Secaucus: 830 Providence: 302 |
Odenton: 300 PHL Airport: 374 Secaucus: 1144 Providence: 307 |
|
| Performance |
|
- | WAS-NYC: 15 NYC-BOS: 40 |
WAS-NYC: 22 NYC-BOS: 70 |
WAS-NYC: 32 NYC-BOS: 87 |
|
ODN-TRE: - WAS-HFD: 6:35 PHL-NHV: 3:23 |
ODN-TRE: 2:10 WAS-HFD: 5:14 PHL-NHV: 2:48 |
ODN-TRE: 2:03 WAS-HFD: 5:02 PHL-NHV: 2:35 |
ODN-TRE: 1:43 WAS-HFD: 4:19 PHL-NHV:2:36 |
|
|
WAS-NYC: 160 NYC-BOS: 150 |
WAS-NYC: 160 NYC-BOS: 160 |
WAS-NYC: 160 NYC-BOS: 160 |
WAS-NYC: 220 NYC-BOS: 220 |
|
| Resiliency |
|
WAS-NYC: 1 NYC-BOS: 1 |
WAS-NYC: 1 NYC-BOS: 1 |
WAS-NYC: 1 NYC-BOS: 2 |
WAS-NYC: 2 NYC-BOS: 2 |
|
|||||
|
- | SLR11:
5/2 SSF12: 126/3 RF13: 141/4 |
- | - | |
|
- | - | SLR: 7/1 SSF: 138/10 RF: 353/139 |
- | |
|
SLR: 10/0-1 SSF: 193/5-16 RF:277/42-97 |
||||
|
|||||
|
- | 7 | 10 | 15-16 | |
|
- | 54 | 55 | 55 | |
| Environmental Sustainability |
|
||||
|
- | -274,650 | -327,180 | -252,461 | |
|
- | -2,480 | -3,375 | -3636 | |
|
- | -30 | -45 | -44 | |
|
- | -75 | -80 | 8 | |
|
- | -30 | -35 | -34 | |
|
- | -10 | -10 | -5 | |
|
- | 170 | 340 | 516 | |
|
-3,813,815 | -4,899,110 | -4,526,791 | ||
|
- | -4,815,105 | -6,516,805 | -7,108,620 | |
|
- | -1 | -128,585 | 3 | |
|
- | 1,001,290 | 1,746,280 | 2,581,826 | |
| Economic Growth |
|
300,900 | 785,170 | 1,582,700 | 3,483,000 |
|
297,800 | 773,670 | 1,561,100 | 3,453,200 | |
|
3,100 | 11,500 | 21,600 | 29,600 | |
|
|||||
|
- | $1,973 | $1,941 | $2,106 | |
|
- | $22 | $20 | $6 | |
|
5 stations | 24 stations | 27 stations | 42-47 stations | |
|
- | WAS: 60 NYP: 840 BOS: 0 |
WAS: 440 NYP: 1,410 BOS: 330 |
WAS: 430 NYP: 1,850 BOS: 370 |
|
| Environmental Impacts |
|
||||
|
4.4 million | 4.5 million | 4.9 million | 5.9-6.5 million | |
|
59% census tracts | 59% census tracts | 57% census tracts | 54-56% census tracts | |
|
18% of the Representative Route | 19% of the Representative Route | 21% of the Representative Route | 16-19% of the Representative Route | |
|
20 | 21 | 23 | 23-27 | |
|
95 | 97 | 111 | 116-130 | |
|
30 resources | 142 resources | 171 resources | 136-150 resources | |
| Cost |
|
$19.9 | $63.6-$66.2 | $131.0-$136.1 | $266.8-$308.0 |
|
$995 | $845 | $645 | $490 |
Source: NEC FUTURE team, 2014
The ability to implement expanded passenger rail service as envisioned in the Action Alternatives, and to construct the improvements necessary to support such service, will depend on many factors, including funding, environmental approvals, market growth, regional cooperation, and practical constraints relating to construction on a very busy rail corridor. Therefore, project sponsors will implement improvements incrementally. Some work, such as state-of-good-repair projects, could advance on a continual basis through annual bridge, track, electric-traction, systems, and structures programs, while larger projects would be planned and implemented separately.
To ensure that incremental capital investment in the NEC will result in benefits for the entire corridor, the FRA anticipates that the alternative selected in the Record of Decision (Selected Alternative) will be implemented in phases consisting of integrated, complementary projects. Phasing ensures that an appropriate integrated package of improvements is planned and implemented in order to meet specific service and operational objectives and to lay the foundation for future phases of work. In this way, travelers will experience near- and mid-term service benefits over the extended period of time that it will take to implement the full service plan envisioned by each Action Alternative.
Each of the Action Alternatives assumes the implementation of a common set of projects, or "Universal First Phase," that would support important enhancements to service and serve as a foundation for advancing subsequent work. In addition to a core set of projects common to the three Action Alternatives, the Universal First Phase includes operational efficiencies and corridor-wide service enhancements that will require significant coordination between the NEC railroads, including potential changes to existing institutional arrangements.
The Universal First Phase consists of high priority projects currently in planning for replacing aging infrastructure and relieving major chokepoints; additional infrastructure needed to support construction activities and to minimize adverse impacts on passenger rail operations during construction; equipment, and operational and institutional changes required to maximize the benefit and cost-effectiveness of investment in the NEC and provide for an enhanced customer experience.
Chapter 10, Phasing Implementation, provides information on the projects included in the Universal First Phase. Implementation of these projects would support a modest increase in both directly to a station on the NEC. These include (1) corridor service south of Washington Union Station to markets in Virginia and North Carolina including Lynchburg, Richmond, Newport News, Norfolk, and Charlotte; (2) Keystone (connects Philadelphia 30th Street Station to Harrisburg Station); (3) Empire Intercity and Regional rail service, greatly enhance the overall reliability of passenger rail on the NEC, and prepare the NEC for future phases of work.
The FRA encourages public dialogue on the evaluation of the No Action and Action Alternatives presented in this Tier 1 Draft EIS. A public comment period will be held, beginning with a Notice of Availability in the Federal Register and extending through January 30, 2016. During the public comment period, the FRA will host public hearings on this Tier 1 Draft EIS in various locations within the Study Area. Information on the public hearings and other methods of submitting comments will be available online at www.necfuture.com. The Tier 1 Draft EIS will be available for download from the website and in hard copy form at major libraries throughout the Study Area, including in all counties through which the existing NEC and Action Alternative Representative Routes run.
Following the public comment period, the FRA will identify a Preferred Investment Program (Preferred Alternative) that achieves a vision for passenger rail in the NEC. The Tier 1 Final EIS will describe the Preferred Alternative, which could be one of the Alternatives considered in this Tier 1 Draft EIS or an Action Alternative that is made up of elements of the Action Alternatives considered in this Tier 1 Draft EIS.
Finally, the FRA will formally select an alternative in a Record of Decision (ROD) to complete the Tier 1 environmental review process. The FRA will then prepare an SDP for the Selected Alternative as defined in the ROD. Future decisions by the U.S. Department of Transportation (U.S. DOT), the NEC states and Washington, D.C., and rail operators will shape the manner in which NEC FUTURE will be incrementally implemented over several decades.
1 Interregional refers to the interregional travel market, and includes trips that start and end in different metropolitan areas (see Chapter 13, Glossary).
2 Regional refers to the regional travel market, and includes trips that start and end within the same metropolitan area (see Chapter 13, Glossary).
3 Connecting corridors are those rail corridors that connect (connects Penn Station New York to Niagara Falls Station); and (4) New Haven-Hartford-Springfield (connects New Haven Union Station to Springfield Union Station) as described in Chapter 13: Glossary.
4 Northeast Corridor Infrastructure and Operations Advisory Commission. (February 2014). State of the Northeast Corridor Region Transportation System. State of the Northeast Corridor Region Transportation System.
5 Amtrak. (2014). NEC Maps & Data: Growing Demand for Rail Services in the Northeast. Retrieved January 2015, from Amtrak, The Northeast Corridor: http://nec.amtrak.com/content/growing-demand-rail-services-northeast
6 Northeast Corridor Infrastructure and Operations Advisory Commission. (February 2014). State of the Northeast Corridor Region Transportation System. State of the Northeast Corridor Region Transportation System.
7 State of good repair is a condition in which assets are fit for the purpose for which they were intended. American Public Transportation Association. (2013). Defining a Transit Asset Management Framework to Achieve a State of Good Repair. Washington, D.C.: American Public Transportation Association.
8 Operating practices include the specification of service levels, stopping patterns, dwell times, and equipment types.
9 Current operators on the NEC include Intercity services operated by Amtrak and Regional rail services operated by eight individual commuter railroads within the Study Area.
10 New state-of-the-art train equipment consisting of electric multiple units cars with high rates of acceleration and deceleration and capable of operating at speeds of 150 mph or greater.
11 = Sea Level Rise (SLR)
12 = Storm Surge Flooding (SSF)
13 = Riverine Flooding (RF)
The information posted on this website includes hypertext links or pointers to information created and maintained by other public and/or private organizations. The FRA provides these links and pointers solely for information and convenience. When users select a link to an outside website, they are leaving the NEC FUTURE website and are subject to the privacy and security policies of the owners/sponsors of the outside website. The FRA does not control or guarantee the accuracy, relevance, timeliness or completeness of information contained on a linked website, or endorse the organizations sponsoring linked websites, the views they express, or the products/services they offer. The FRA cannot authorize the use of copyrighted materials contained in linked websites and is not responsible for transmissions users receive from linked websites.