Climate Change and Adaptation
This chapter focuses on the effects of climate change on rail infrastructure associated with the Preferred Alternative.
The climate change analysis uses the same effects-assessment methodology and relies on the information presented in the Tier 1 Draft Environmental Impact Statement (Tier 1 Draft EIS) (see Volume 2, Chapter 7.15 and Appendix E.15). As described in Volume 2, Chapter 7.15, the Federal Railroad Administration (FRA) conducted analysis that identifies areas of the existing and proposed rail infrastructure that may be vulnerable to the effects of climate change, since it is important to recognize potential risk at this stage in order to design and implement appropriate adaptation and resiliency measures to address and reduce vulnerability. These analyses include sea level rise and storm surge, increased storm frequency and severity, and more-frequent and severe extreme heat and cold events. The FRA considered two future climate scenarios:
The FRA used this multi-scenario approach to analyze different levels of climate change - related effects that encompass the range of sea level rise projections and forecast timeframes used by researchers and regulatory agencies in the Northeast.
This chapter also considers the mitigating effects of the Preferred Alternative on energy usage (presented in Chapter 7.14, Energy) and on greenhouse gases (GHG) emissions (presented in Chapter 7.13, Air Quality). GHG emissions are a key contributor to the changing global climate, which influences the frequency and intensity of storms, rising sea levels, heat waves, and cold snaps. GHG emissions are expected to decrease due to predicted shifts in mode choice from personal vehicle, bus, and aircraft to passenger rail and greater renewable energy usage.
The FRA reviewed and incorporated themes of climate change policies from various government agencies along the Northeast Corridor (NEC) and from the U.S. Department of Transportation's (U.S. DOT) 2014 Climate Adaptation Plan. Following the U.S. Environmental Protection Agency's climate change description, this analysis considered the impacts of sea level rise flooding, storm surge flooding, riverine flooding and extreme heat and cold events on rail assets associated with the Existing NEC + Hartford/Springfield Line and the Preferred Alternative. (Refer to Volume 2, Chapter 7.15, for further details on the NEC FUTURE climate change analysis.)
Limitations
The assessment of climate change effects aims to identify potential risks from climate change on the Preferred Alternative, based on the use of existing and readily available data and information that are consistent across the Study Area. This assessment estimated the change in flood hazard areas, but did not undertake flood modeling to develop new inundation maps for future climate scenarios for all counties within the Study Area.
When assessing risks associated with climate change, the FRA limited its assessment as follows:
Refer to Volume 2, Appendix E.15, for further discussion regarding the limitations of the climate change analysis.
Increases in GHG emissions contribute to changes in the global climate and weather events, which can lead to flooding, storm surges, and extreme heat and cold. As the climate continues to change, more-intense and more-frequent storms, rising sea levels, heat waves, and cold snaps2 will worsen existing weather-related rail problems and create new hazards for rail asset owners and operators. Volume 2, Chapter 7.15, contains further details on types of hazards and their effects on rail assets. This analysis shows that some of the rail assets associated with the Existing NEC and those affiliated with the Preferred Alternative are in areas currently vulnerable to climate change effects, and that the risks increase over the mid-century and end-of-century.
GHG emissions are a key contributor to the changing global climate. Continued increases in global GHG emissions are projected to lead to more significant changes in extreme weather events and their associated risks to rail assets and operations. The analysis presented in Chapter 7.13, Air Quality; Chapter 7.14, Energy; and Chapter 5, Transportation, indicates that under the Preferred Alternative, there would be a net total decrease in GHG emissions in the year 2040 due to predicted shifts in mode choice as a result of implementing the Preferred Alternative and predicted changes in greater renewable energy usage.
The analysis presented in this section shows that portions of the NEC and the Preferred Alternative have some risk of inundation under current climate conditions, not taking into account elevation of asset, as discussed above. The extent of that risk increases under both the mid-century and end-of-century scenarios. The following subsections discuss the current, mid-century, and end-of-century inundation risks (sea level rise and coastal storm surge) for the Existing NEC + Hartford/Springfield Line and the Preferred Alternative. While the FRA assessed the mid-century and end-of-century riverine flood risk for the Affected Environment, because of limitations in readily available information, the FRA applied only the current climate conditions to the analysis of the Representative Route for riverine flooding (see Section 7.15.1.3).
Much of the Existing NEC is along the eastern shoreline of the United States and either crosses or is adjacent to numerous streams, rivers, wetlands, and floodplains, rendering it susceptible to inundation from various sources (see Chapter 7.5, Hydrologic/Water Resources). Under current climate conditions, of the total area within the Affected Environment, 3 percent is at risk for flooding associated with sea level rise; 10 percent is at risk for flooding associated with storm surge flooding; and 20 percent is at risk for flooding associated with riverine flooding. Under the mid-century and end-of-century scenarios, the inundation risks from these sources increase. Under the end-of-century scenario, risks associated with sea level rise increase to 8 percent; increase to almost 17 percent with storm surge flooding; and increase to 33 percent with riverine flooding.
For each flooding hazard, Connecticut (Fairfield, New Haven, Middlesex, and New London Counties) contains the highest percentages of lands within the Affected Environment susceptible to each flooding hazard.
When focusing on the land encompassed by the right-of-way of the NEC - and not the broader Affected Environment - the percentage of land area within that right-of-way at risk is 1 percent (sea level rise), 8 percent (storm surge flooding), and 14 percent (riverine flooding). Under the end-of-century scenario, those flooding risks for the route of the NEC increase to approximately 6 percent (sea level rise) and 20 percent (storm surge flooding). (The FRA conducted the assessment of riverine flooding risk only for the current climate conditions.)
The greatest risk to the Existing Hartford/Springfield Line is from riverine flooding (25 percent) with much less risk from storm surge flooding (5 percent) and sea level rise flooding (less than 1 percent).
Figure 7.15-1 through Figure 7.15-3 show the risk profiles of each flooding hazard for each county in the Affected Environment for the current climate conditions for both the Preferred Alternative and the Existing NEC.
The No Action Alternative includes improvements that exist primarily along the Existing NEC + Hartford/Springfield Line. As such, the analysis presented for the Existing NEC + Hartford/Springfield Line provides a good proxy for identifying inundation risks associated with the No Action Alternative. As the climate changes, the risks associated with flooding are likely to increase, hastening the degradation of these rail assets. Without investment to provide more resilient infrastructure, repair and maintenance costs as well as disruptions to services are projected to increase under the No Action Alternative as a result of the effects of climate change.
Figure 7.15-1 : Current Climate Conditions, Sea Level Rise Flooding: Affected Environment - Percentage of Total County Acreage at Risk (Existing NEC + Hartford/Springfield Line and Preferred Alternative)
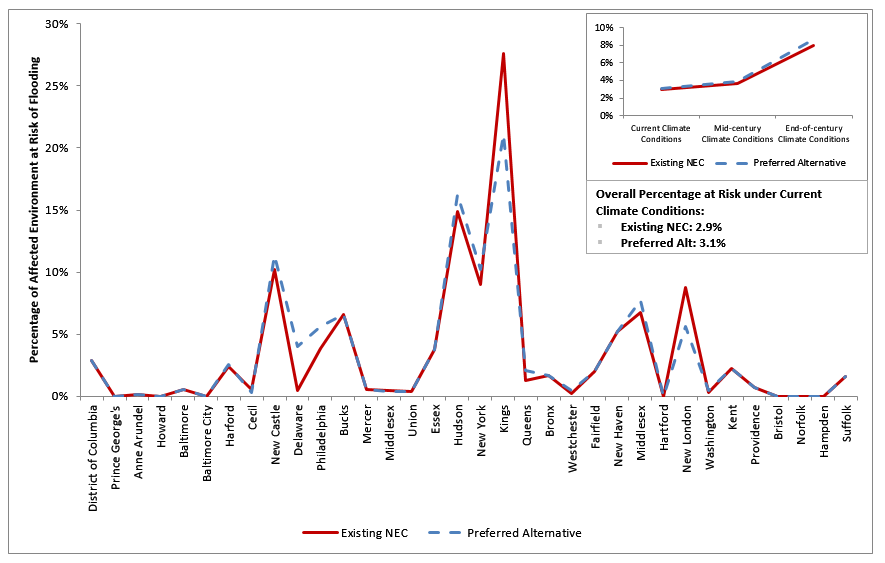
Source: NEC FUTURE team, 2016
Figure 7.15-2: Current Climate Conditions, Storm Surge Flooding: Affected Environment - Percentage of Total County Acreage at Risk (Existing NEC + Hartford/Springfield Line and Preferred Alternative)
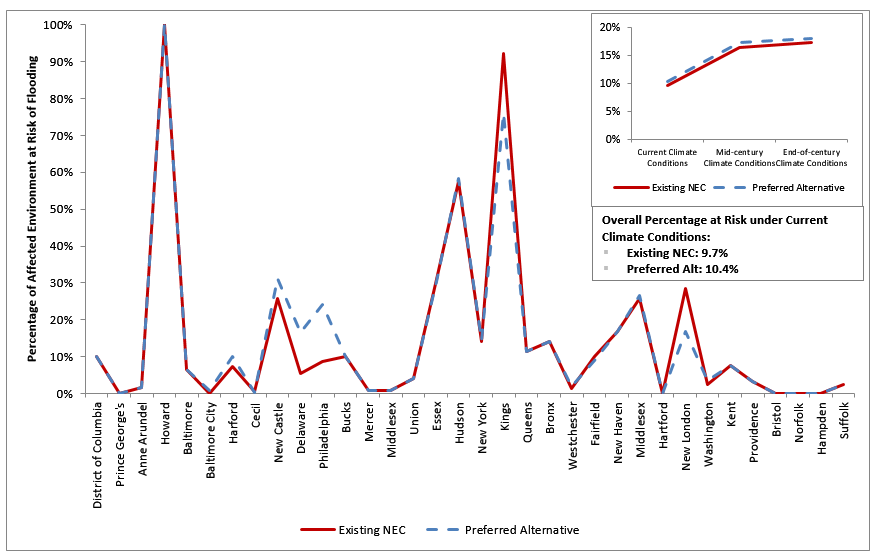
Source: NEC FUTURE team, 2016
Figure 7.15-3 : Current Climate Conditions, Riverine Flooding: Affected Environment - Percentage of Total County Acreage at Risk (Existing NEC + Hartford/Springfield Line and Preferred Alternative)
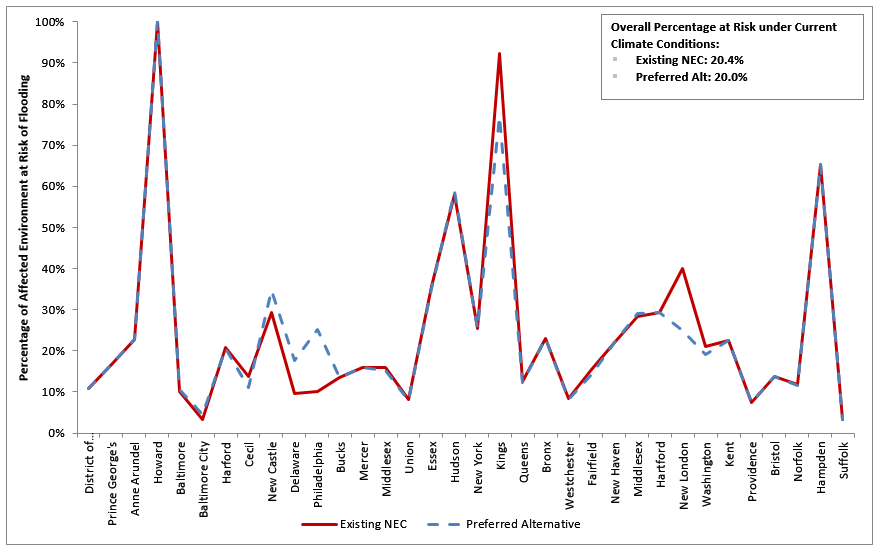
Source: NEC FUTURE team, 2016
This analysis presents areas of inundation risks, by county, from sea level rise flooding, storm surge flooding, riverine flooding, and extreme heat and cold events for the broader Affected Environment of the Preferred Alternative and for the narrower Representative Route of the Preferred Alternative.
Affected Environment
Similar to the No Action Alternative, the rail assets included in the Preferred Alternative would be at risk from all flooding hazards under current climate conditions. Figure 7.15-1 through Figure 7.15-3 compare the percentage of the total acreage by county in the Affected Environment at risk for each flood hazard for the Existing NEC + Hartford/Springfield Line and Preferred Alternative. While the total percentage of Affected Environment at risk from flooding varies depending on the flood hazard, the Existing NEC + Hartford/Springfield Line has the highest overall percentage of acreage in the Affected Environment at risk for riverine flooding.
The percentage of the total acreage at risk in the Affected Environment of the Preferred Alternative is projected to increase for all flood hazards under the mid-century and end-of-century climate scenarios. (Refer to the graph inserts in Figure 7.15-1 through Figure 7.15-3.) For sea level rise flooding, the greatest increase in the number of acres at risk is likely to occur between mid-century and end-of-century climate conditions. For storm surge flooding, the greatest increase is likely to occur between current climate conditions and mid-century. For riverine flooding, the increase in number of acres at risk is likely to be relatively consistent between each time period; however, projection data was not available. Each flooding hazard is discussed in more detail below. Discussion of the Existing NEC is included to show relative changes in flooding hazards.
Representative Route
The percentage of the Representative Route at risk from flooding risks related to climate change is slightly higher or similar for the Preferred Alternative compared with the Existing NEC, especially under current climate conditions. While at the surface, this finding implies that the Preferred Alternative is slightly more vulnerable to flood risks considering climate change scenarios, the result is potentially misleading because the assumptions used to analyze the Preferred Alternative did not account for the adaptation measures and design considerations that would be incorporated to reduce flood vulnerability. The Preferred Alternative may still provide an advantage in improving resiliency to the impacts of climate change not only as a result of the rail asset upgrades and resilient infrastructure design considerations incorporated, but also because the Preferred Alternative improves redundancy by including new segments. By understanding these areas of vulnerability at this planning stage, the design and build stages of the Preferred Alternative can incorporate targeted resilience and adaptation measures.
Sea Level Rise Flooding
The percentage of the Representative Route at risk from sea level rise flooding in current conditions for the Existing NEC + Hartford/Springfield Line and the Preferred Alternative is 1.0 and 1.5 percent of the total acreage, respectively (Figure 7.15-4).
The total percentage of the Preferred Alternative's Representative Route at risk of sea level rise flooding is likely to increase to 1.9 percent under mid-century climate conditions and 6.8 percent under end-of-century climate conditions. The percentage of the Existing NEC + Hartford/Springfield Line at risk of sea level rise flooding would increase to 1.3 percent under mid-century climate conditions and 5.7 percent under end-of-century conditions. The Existing NEC + Hartford/Springfield Line has the lower percentage of the Representative Route at risk from sea level flooding under the current, mid-century, and end-of-century climate conditions (see insert in Figure 7.15-4).
Coastal Storm Surge Flooding
Under current climate conditions, the percentage of the Representative Route at risk from coastal storm surge flooding for the Existing NEC + Hartford/Springfield Line and the Preferred Alternative is 7.8 and 8.7 percent, respectively (Figure 7.15-5).
The total percentage of the Preferred Alternative's Representative Route at risk of coastal storm surge flooding is likely to increase to 18.7 percent under mid-century climate conditions and 19.8 percent under end-of-century climate conditions. Meanwhile, the total percentage of the Existing NEC + Hartford/Springfield Line at risk of coastal storm surge flooding would increase to 18.3 percent under mid-century climate conditions and 19.6 percent under end-of-century climate conditions.
Note that in Figure 7.15-4 through Figure 7.15-6 no data is present for King's County, NY, for the Existing NEC + Hartford/Springfield Line. The reason for this absence of data is that within the Representative Route, the Existing NEC does not have any acreage or acreage at risk within Kings County, while the Preferred Alternative does have such acreage at risk for both sea level rise and storm surge flooding. Another point of note - the large percentage of acreage at risk in King's County along the Preferred Alternative is because most, if not all, of the small number of acres (4) located in the county are at risk of flooding.
Riverine Flooding
Under current climate conditions the percentage of the Representative Route at risk of riverine flooding for the Existing NEC + Hartford/Springfield Line and the Preferred Alternative is 14.2 and 13.8 percent, respectively (Figure 7.15-6).
As noted in Section 7.15.4, the FRA conducted an assessment of riverine flooding risk on the Representative Route only for the current climate conditions; however, it is likely that the total percentage of the Representative Route at risk of riverine flooding will also increase under mid-century and end-of-century climate conditions.
Figure 7.15-4 : Current Climate Conditions, Sea Level Rise Flooding: Representative Route - Percentage of Total County Acreage at Risk (Existing NEC + Hartford/Springfield Line and Preferred Alternative)
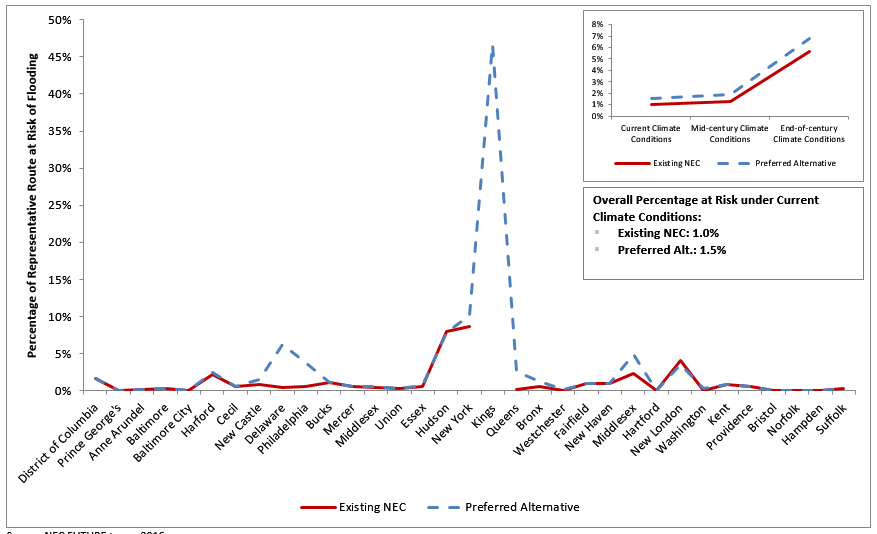
Source: NEC FUTURE team, 2016
Note:
The Existing NEC does not pass through Kings County, NY. For this reason,
there is a gap in the Existing NEC line on the graph above. The Preferred
Alternative does have 4 acres located in Kings County, NY, and in current
climate conditions 2 of those 4 acres are at risk for sea level rise
inundation, accounting for the spike seen in the graph above.
Figure 7.15-5 : Current Climate Conditions, Storm Surge Flooding: Representative Route - Percentage of Total County Acreage at Risk (Existing NEC + Hartford/Springfield Line and Preferred Alternative)
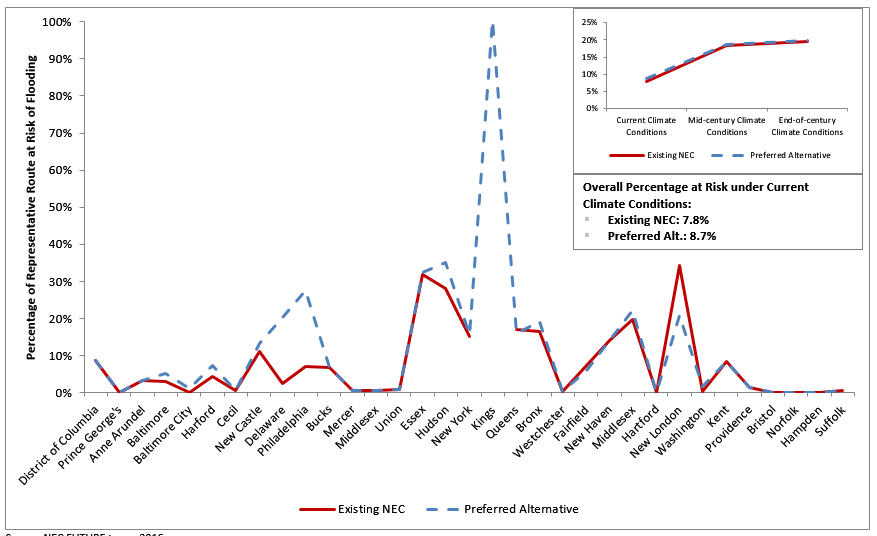
Source: NEC FUTURE team, 2016
Note:
The Existing NEC does not pass through Kings County, NY. For this reason,
there is a gap in the Existing NEC line on the graph above. The Preferred
Alternative does have 4 acres located in Kings County, NY, and in current
climate conditions all 4 acres are at risk for storm surge inundation;
accounting for the spike seen in the graph above.
Figure 7.15-6 : Current Climate Conditions, Riverine Flooding: Representative Route - Percentage of Total County Acreage at Risk (Existing NEC + Hartford/Springfield Line and Preferred Alternative)
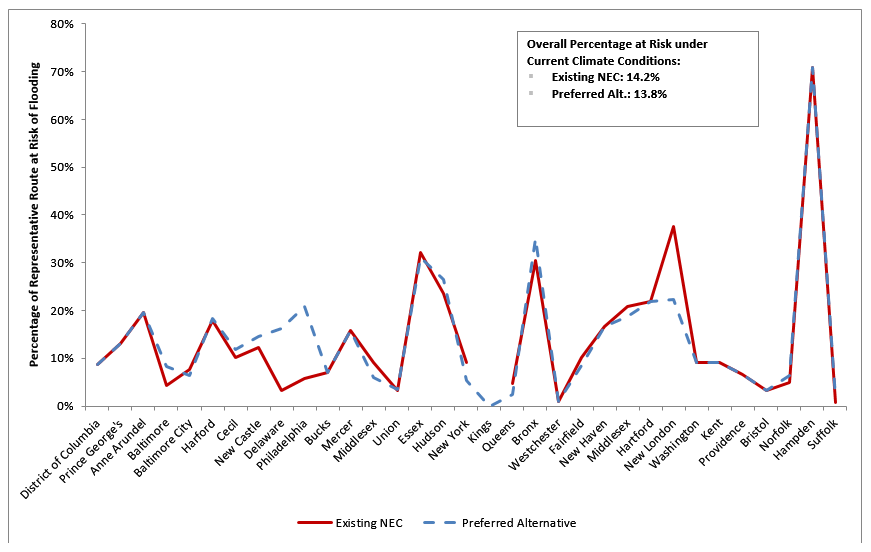
Source: NEC FUTURE team, 2016
Note:
The riverine flooding data looks only at non-tunnel acreage; therefore,
Kings County, NY, is not included in either the Existing NEC or the
Preferred Alternative.
In Section 7.15.4.3, the analysis of inundation risk included the Existing NEC in the Preferred Alternative for the purposes of calculating the percentage of the Representative Route at risk from each flooding hazard. As a result, it was not obvious how the off-corridor segments of the Preferred Alternative would provide resilience and redundancy benefits by providing an alternate route that could assist in maintaining services if coastal or riverine inundation issues (or other hazards) affect assets along the Connecticut and Rhode Island coasts. The analysis presented in this section concentrates on the areas where off-corridor routing is proposed for the Preferred Alternative. The Preferred Alternative representative routes and construction characteristics are the basis for the analysis in the NEC FUTURE Tier 1 EIS. They illustrate necessary improvements to achieve the Preferred Alternative service and performance objectives. As part of the Tier 1 process, the FRA has determined the necessity for new segments in particular geographic sections of the NEC in order to meet the Purpose and Need, and has identified a representative route for each potential new segment. The FRA or another federal agency providing funding for a particular project will evaluate specific locations for new segments as part of the Tier 2 project studies, prior to making any decision regarding new segment locations. Resiliency benefits may change based on the final locations of new segments.
This section focuses on the acreage in the Representative Route at risk from all flooding hazards under current climate conditions along each off-corridor segment of the Preferred Alternative. The analyses highlight areas of vulnerability so adaptation measures can be taken into account as planning for NEC FUTURE progresses. As indicated in Section 7.15.4.3, the risks from each flooding hazard identified in this section are likely to increase under mid-century and end-of-century climate conditions.
Within the Representative Route, additional analysis focuses on at-grade and trench construction types since they are more sensitive to flood risk than other construction types (e.g., tunnel, aerial, embankment, and major bridge). Since these construction types are more sensitive, resilience measures would be taken into account during the design and build of these areas. While at-grade and trench construction types are the focus of the assessment, flooding impacts may still affect tunnels, embankments, and bridge construction types (for example, via scour or erosion).
Elements South of New York City
Elements North of New York City
Table 7.15-1 summarizes the total number of stations along the Preferred Alternative at risk of inundation under each timeframe. Appendix EE.15, contains a detailed county-level listing of the stations at risk of inundation along the Preferred Alternative; while Volume 2, Appendix E.15, contains this information for each Action Alternative.
Riverine flooding accounts for the majority of the total number of stations at risk of inundation. Under current climate conditions along the Preferred Alternative, 38 stations would be at risk from sea level rise flooding and coastal storm surge flooding, while an additional 30 stations would be at risk of inundation when riverine flooding is considered. While the total number of stations at risk would increase under mid-century and end-of-century climate conditions, the risk profile from each flooding hazard is similar to that of the current climate conditions with riverine flooding accounting for a significant portion of the total number of stations at risk.
| Current | Mid-Century | End-of-Century | |
|---|---|---|---|
| Total New Stations At Risk of Inundation | 13 | 15 | 15 |
| Total Existing Stations At Risk of Inundation | 53 | 61 | 63 |
| Total Modified Stations At Risk of Inundation | 2 | 2 | 2 |
| Total Number of Stations At Risk of Inundation | 68 | 78 | 80 |
Source: NEC FUTURE team, 2016
Note:
The numbers in this table represent the total number of stations at
risk from one or more flood hazard.
Considerable portions of the Affected Environment associated with the Existing NEC and the Preferred Alternative are already close to the coast and are at risk from sea level rise flooding and coastal storm surge flooding. Within the Context Area, any shift in the route closer to the coast would likely increase the risk of inundation from these flooding mechanisms. Conversely, shifting away from the coastline could reduce the area at risk.
Considerable portions of the Affected Environment associated with the Existing NEC + Hartford/Springfield Line and the Preferred Alternative are already at risk from riverine flooding under current climate conditions. As the climate changes, the size of these flood hazard areas within the Context Area would likely increase.
A review of the flood hazard areas under current climate conditions identified that when compared to the Existing NEC + Hartford/Springfield Line, the Preferred Alternative route within the Context Area could lead to greater increases in flood risk in the following counties:
The counties listed above are nearly identical with those identified as having increased riverine flooding risk in the Affected Environment of the Preferred Alternative, aside from the addition of Somerset, NJ; New York, Kings, and Queens, NY; and Suffolk, MA; and the elimination of Westchester, NY, and Norfolk, MA.
These findings are applicable to all three time periods (i.e., current climate, mid-century, and end-of-century). The number of acres at risk within the Context Area would increase as the hazard extents increase under each future scenario (e.g., with sea level rise and increases in the frequency and intensity of extreme rainfall events at mid-century and end-of-century).
The effects of climate change also extend to extreme changes in temperatures. Temperatures that are abnormally high or low can also result in effects to rail infrastructure. Exposing rail to prolonged periods of heat or cold temperatures can cause rail to crack, buckle, pull apart, or separate, resulting in service disruption and delays. The extreme temperature-related impacts to rail assets and operations include the following:
Figure 7.15-7: Example of Rail Buckle from Extreme Heat
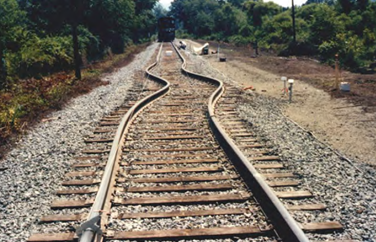
Source: U.S. DOT Volpe Center in Federal
Transit Administration. (2011).
Flooded Bus Barns and Buckled
Rails: Public Transportation and
Climate Change Adaptation.
Retrieved 2015,
from
https://www.transit.dot.gov/sites/fta.dot.gov/files/FTA_0001_-_Flooded_Bus_Barns_and_Buckled_Rails.pdf.
Factors that influence the occurrence of pull-aparts or buckling include the temperature of the track at the time it is installed (i.e., the rail neutral temperature), the age of the track, maintenance of the track (e.g., if there has been adjustments in a prior season to accommodate heat or cold), the use of the track, solar radiation, wind, and the ambient air temperature.
Buckling is a catastrophic event that significantly increases the likelihood of derailment. However, pull-aparts are seen as a lower consequence risk event since they typically are detected through the signaling system or by train engineers, and small breaks can be driven over without causing a derailment.
Information provided by the FRA's Office of Research and Development indicates that there tend to be more buckles in the early summer, often as a result of unreported fixes of winter breaks where more track is added, which lowers the neutral temperature of the track. Slow orders (i.e., requests to operate the trains at a slower speed) are a key response to managing the impacts of extreme heat events. Slow orders minimize the likelihood of track buckling or derailment during an extreme heat event. A slow order may be for the whole day, or may be increased as the day continues.3
Each railroad has its own policy regarding slow orders and the relevant thresholds that trigger them:
Recognizing there is a range of temperatures of interest, the FRA evaluated three temperature projections for the average number of days where the maximum temperatures exceed 80°F, 95°F, and 110°F (Figure 7.15-8) under historical average (1959 - 1999), mid-century, and end-of-century scenarios. State-based projections provide an average of the climate data available for grid references closest to the Preferred Alternative route, rather than an average for the entire state.
All states and Washington, D.C., on average, historically experienced more than 50 days a year where the maximum temperature exceeds 80oF, with Washington, D.C., and Maryland recording more than 100 days per year. The number of days per year above 80°F is projected to increase by 36 - 46 days at mid-century and 58 - 74 days at end-of-century. While the increase in the total number of days per year above 80°F is similar across all states, the projected percentage of days per year above 80°F increases for mid-century and end-of-century are highest for New York (65 percent and 105 percent, respectively), Connecticut (79 percent and 126 percent, respectively), Rhode Island (94 percent and 151 percent, respectively), and Massachusetts (82 percent and 131 percent, respectively).
Figure 7.15-8 : Average Annual Number of Days Equal to or Above 95°F, by Climate Scenario
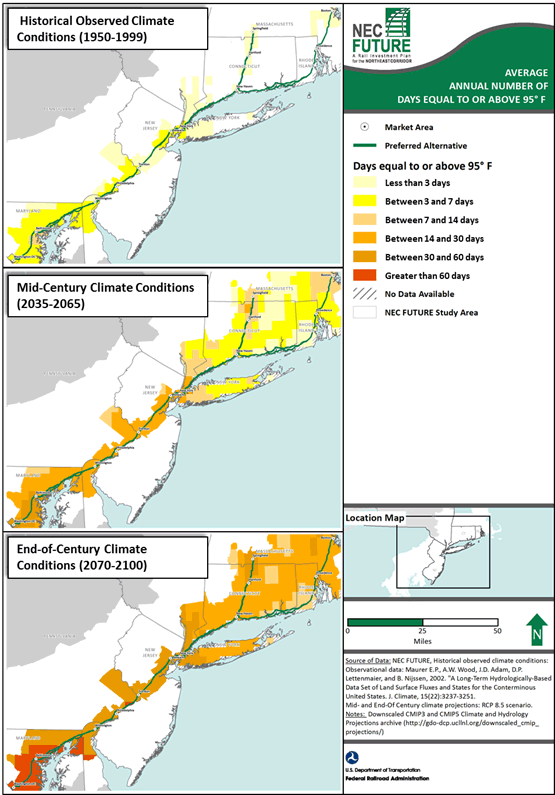
Source: NEC FUTURE team, 2016
The projected increase in the number of days per year above 95°F is most dramatic for the southern-most states (Maryland, Washington, D.C., Delaware, Pennsylvania, and New Jersey). These states historically experienced 3 - 6 days annually above 95°F and are projected to experience a total of 18 - 35 days at mid-century, and 47 - 73 days at the end-of century. Figure 7.15-8 illustrates the projected change in days over 95°F in each state by the mid-century.
Historically (1950 - 1999), on average, the temperature threshold of 110°F has not been exceeded along the Preferred Alternative route. For all states, this is not projected to change at mid-century, with minimal (i.e., <0.5 day) projected at the end-of-century.
In North America, climate change is projected to result in increases in hot days and extended warm spells (i.e., heat waves), reductions in cold days, cold nights and frosts, and more rapid increases in minimum temperature extremes than maximum temperature extremes.5 However, the frequency and duration of extreme cold events in the Northeast may be affected by potential increases in "blocking" events, described by the National Climate Assessment (NCA) as large-scale weather patterns with little or no movement.6 The NCA acknowledges that further research is required since conclusions about trends in "blocking" depend on the method of analysis. Because of the uncertainty of the climate change - related influence on this hazard, the FRA has made no quantitative projections. Table 7.15-2 in Volume 2, Chapter 7.15, provides a qualitative listing of the potential effects of extreme cold events (including effects of snow and ice) on rail assets.
In nearly every flooding scenario in current climate conditions, the Preferred Alternative has a slightly higher percentage of acreage at risk of inundation than the Tier 1 Draft EIS Action Alternatives. The only case where this differs is that the Preferred Alternative and Alternative 1 have the same percentage at risk of sea level rise flooding.
Table 7.15-2 summarizes the three counties located along the Representative Routes of the Existing NEC +Hartford/Springfield Line, the Preferred Alternative, and the Action Alternatives that have, or are proposed to have, rail assets located where the highest total acreage at risk from each flood hazard occur under current climate conditions. Also included in the table is the percentage of the total acreage within the Representative Routes at risk of flooding accounted for by these three counties. It is notable that New London, CT, consistently represents one of the counties at highest risk of all types of flooding under the Existing NEC + Hartford/Springfield Line, the Preferred Alternative, and the Action Alternatives (with the exception of storm surge flooding under the Preferred Alternative and sea level rise flooding under Alternative 3).
| Flooding Hazard | Existing NEC + H/S Line1 | Preferred Alternative | Alt. 1 | Alt. 2 | Alt. 3 |
|---|---|---|---|---|---|
| Sea level rise flooding |
|
|
|
|
|
| Storm surge flooding |
|
|
|
|
|
| Riverine flooding |
|
|
|
|
|
Source: NEC FUTURE team, 2016
1 H/S Line
= Hartford/Springfield Line
Under the Preferred Alternative, analysis indicates there would be a net total decrease in GHG emissions in the year 2040, when compared to the No Action Alternative.
Flood and extreme temperature-related impacts affect the Existing NEC + Hartford/Springfield Line (as a proxy for the No Action Alternative) and will also affect the Preferred Alternative. The risks and associated impacts are likely to increase under mid-century and end-of-century climate conditions. While a significant portion of the Existing NEC is along the coast, the Preferred Alternative provides a mix of inland and coastal routes, particularly in the northern half of the Study Area. Analyses showed that rail assets and infrastructure associated with inland routes are at much lower risk of coastal flooding than coastal routes. Rail assets located in counties along inland routes, however, are still subject to riverine flooding, as is the Existing NEC. The geographic area of those risks is likely to increase as a result of climate change. It is also important to note that this assessment did not consider vulnerability-reducing adaptation measures and design considerations that would be a part of the Preferred Alternative. As such, the risk of flooding to the Preferred Alternative is potentially lower that what is presented in this analysis.
The Preferred Alternative requires investment to improve the resiliency of the Existing NEC + Hartford/Springfield Line infrastructure. The resiliency and redundancy provided by the Preferred Alternative both north and south of New York City provide a benefit compared to the No Action Alternative. Investment in new infrastructure associated with the off-corridor sections of the Preferred Alternative provides an opportunity to locate and design the infrastructure in a way that minimizes its risk to flood and extreme heat related impacts. In some areas, upgrading the Existing NEC + Hartford/Springfield Line to be more resilient may not be enough and providing redundant track outside of the areas of risk supplies alternative routing when some segments are closed because of flooding. This redundancy allows some level-of-service to be maintained. The following section presents potential mitigation and adaptation strategies.
Understanding that the effects of climate change will continue to worsen, it is important to consider ways in which to make improvements to the existing and new rail infrastructure that can better withstand the potential effects on inundation and extreme weather events. This section provides an overview of potential mitigation and adaptation strategies that could be considered during future stages of project development. Chapter 7.13, Air Quality, provides potential mitigation to reduce GHG emissions.
The earlier that adaptation approaches are considered in the infrastructure planning and design process, the lower the relative cost and potential disruption associated with implementing the changes. For example, the marginal cost of building an embankment to a higher elevation when it is first built is significantly cheaper, and less disruptive, than increasing the height of an existing embankment and the assets it supports.
Multiple approaches can be used to adapt rail service and infrastructure to future climate and therefore minimize the risk of flood or extreme temperature-related impacts. Typical categories of response include the following:
The FRA reviewed climate change - related policies and initiatives that have been published by various government agencies in Washington, D.C., and the eight states along the NEC. From these sources, the FRA identified the following common themes:
The FRA has taken action related to each of these themes by integrating consideration of climate change into the Tier 1 EIS process. The climate change analysis has engaged with planning agencies, considered climate change projections, and assessed the vulnerability of rail assets.
Table 7.15-3 provides a listing of potential adaptation actions relevant to each asset class and the risks they face from flood and extreme temperatures. The existence of an inland route may assist in reducing service disruptions should a coastal flooding event affect assets along the coast.
In developing adaptation options specific to the NEC, consideration should be given to regional or state-based adaptation actions to reduce the risk profile of the Preferred Alternative.
| Asset | Risk | Adaptation Actions |
|---|---|---|
| BUILT ASSETS | ||
| Rail tracks (at-grade, embankment, trench, and tunnel construction) |
|
|
| Station platforms |
|
|
| Station buildings |
|
|
| Storage facilities for rail vehicles |
|
|
| Storage facilities for maintenance equipment |
|
|
| Electrical equipment (substations, overhead power / catenary wires), signaling, communications, security lighting, supporting retail / activity centers and emergency equipment (e.g., backup generators, firefighting / water pumps for flood treatment) |
|
|
| Bridge structures (aerial and major bridge construction) |
|
|
| Retaining walls (embankment and tunnel construction) |
|
|
| Vehicles |
|
|
| Noise walls |
|
|
| HUMAN ASSETS (access to / from, health and safety during use / operation) |
||
| Operational staff |
|
|
| Passengers / commuters |
|
|
| SUPPORTING SERVICES | ||
| Electricity supply |
|
|
| Emergency response |
|
|
Source: NEC FUTURE team, 2015
Volume 2, Appendix E.15, provides the limitations of this assessment. Key actions that could be undertaken as part of Tier 2 project analysis and design should include the following:
The above analysis may be guided by the Federal Highway Administration's Virtual Framework for Vulnerability Assessment.
Table 7.15-4 provides an overview of the modules contained in the framework and how they may be applied to Tier 2 analysis. In addition, consideration should be given to the Revised Guidelines for Implementing Executive Order 11988, Floodplain Management. 8
Furthermore, on August 1, 2016, the Council on Environmental Quality issued final guidance on consideration of GHG emissions and the effects of climate change in National Environmental Policy Act documents.9 This guidance states that "when addressing climate change agencies should consider: (1) The potential effects of a proposed action on climate change as indicated by assessing GHG emissions (e.g., to include, where applicable, carbon sequestration); and, (2) The effects of climate change on a proposed action and its environmental impacts." The FRA developed a methodology for the NEC FUTURE Tier 1 EIS, in coordination with federal and state agencies, which considered GHG emissions and the vulnerability of rail assets. This Tier 1 Final EIS identifies areas at risk that should be further evaluated during subsequent Tier 2 project studies. More in-depth analysis of GHG emissions may also be needed for Tier 2 project studies.
| Framework Module | Relevance to Tier 2 Analysis |
|---|---|
| Module 1: Articulate Objectives Includes:
|
Guidance related to this module could assist in setting the scope of Tier 2 analysis. The NEC FUTURE Tier 1 analysis can inform the articulation of objectives. |
| Module 2: Identify Key Climate Stressors Includes selecting climate stressors to analyze, based on the sensitivity of transportation assets |
The Tier 1 assessment has selected climate stressors relating to flooding and extreme temperature as the focus. Tier 2 analyses may consider a broader set of climate stressors (refer to U.S. DOT's Sensitivity Matrix developed as a part of the U.S. DOT Gulf Coast study). |
| Module 3: Select and Characterize Relevant Assets Includes determining the following:
|
Guidance related to this module could be of use in developing the scope for Tier 2 analysis (refer to Guide to Assessing Criticality in Transportation Adaptation Planning developed as a part of the U.S. DOT Gulf Coast Study). |
| Module 4: Assess Vulnerabilities Includes assessing sensitivity, exposure and adaptive capacity of assets and the associated risks |
Guidance related to this module could be of use in developing the scope for Tier 2 analysis (refer to the U.S. DOT Vulnerability Assessment Scoring Tool). |
| Module 5: Integrate Vulnerabilities into Decision-Making Includes identifying, analyzing, and prioritizing adaptation options |
The work undertaken in the Tier 1 EIS is a demonstration
of how vulnerabilities are being considered in the decision-making
process. Guidance related to adaptation planning may be of benefit in Tier 2 analysis. |
| Module 6: Monitor and Revisit Includes developing and implementing a monitoring and evaluation plan, engaging stakeholders, evaluating outcomes, revisiting inputs into the assessment (e.g., climate data, information on assets or operations) |
These elements should be considered in the development of adaptation options and ongoing planning for the NEC FUTURE. |
Sources:
1. NEC FUTURE team, 2016
2. U.S. Department of Transportation - Federal Highway Administration.
(2015, February 2). Gulf Coast Study, Phase 2 Task 4. Retrieved
February 23, 2015, from Federal Highway Administration:
http://www.fhwa.dot.gov/environment/climate_change/adaptation/ongoing_and_current_research/gulf_coast_study/phase2_task4/index.cfm
3. U.S. Department of Transportation - Federal Highway Administration.
(2015, February 2). Virtual Framework for Vulnerability Assessment.
Retrieved February 23, 2015, from Federal Highway Administration:
http://www.fhwa.dot.gov/environment/climate_change/adaptation/adaptation_framework/%
1 Federal Insurance and Mitigation Administration (FIMA) & Federal Emergency Management Agency (FEMA). (2013). The Impact of Climate Change and Population Growth on the National Flood Insurance Program through 2100. http://www.nfrmp.us/frmpw/2013webinarweek/docs/E3%20Coastal%20Climate%20Change/E3_FEMA_MarkCrowell_climate_change3.pdf
2 Climate Change Impacts in the United States. Retrieved August 15, 2014, from http://www.globalchange.gov/browse/reports/global-climate-change-impacts-united-states; and Transportation Research Board. (2008). Special Report 290: Potential Impacts of Climate Change on U.S. Transportation. National Research Council. Committee on Climate Change and U.S. Transportation. Washington, D.C.: Transportation Research Board. Retrieved 2014 from http://onlinepubs.trb.org/onlinepubs/sr/sr290.pdf
3 Al-Nazer, L. F. (2014a, August 15). Heat Event Thresholds for Rail Performance - NEC Future EIS : Phone discussion. (N. F. Team, Interviewer)
4 Email from Leith Al-Nezar (2014b, August 15). Washington, D.C., USA. U.S. DOT
5 Intergovernmental Panel on Climate Change (IPCC). (2013). Summary for Policymakers. In: Climate Change 2013: The Physical Science Basis. Contribution of Working Group I to the Fifth Assessment Report of the Intergovernmental Panel on Climate Change. New York: Cambridge University Press.
6 U.S. Global Change Research Program. (2014). 2014 National Climate Assessment. Retrieved from http://nca2014.globalchange.gov/
7 National Climate Assessment. (Revised 2014). Ch. 26: Decision Support. http://nca2014.globalchange.gov/report/response-strategies/decision-support
8 Federal Emergency Management. (Revised 2015). Agency Guidelines for Implementing Executive Order 11988, Floodplain Management. Retrieved from http://www.fema.gov/media-library-data/1422653213069-9af488f43e1cf4a0a76ae870b2dcede9/DRAFT-FFRMS-Implementating-Guidelines-1-29-2015r2.pdf
9 Council on Environmental Quality, "Final Guidance for Federal Departments and Agencies on Consideration of Greenhouse Gas Emissions and the Effects of Climate Change in National Environmental Policy Act Reviews," 81 Fed. Reg. 51866 (August 5, 2016). Access at http://energy.gov/sites/prod/files/2016/08/f33/nepa_final_ghg_guidance_FR.pdf
The information posted on this website includes hypertext links or pointers to information created and maintained by other public and/or private organizations. The FRA provides these links and pointers solely for information and convenience. When users select a link to an outside website, they are leaving the NEC FUTURE website and are subject to the privacy and security policies of the owners/sponsors of the outside website. The FRA does not control or guarantee the accuracy, relevance, timeliness or completeness of information contained on a linked website, or endorse the organizations sponsoring linked websites, the views they express, or the products/services they offer. The FRA cannot authorize the use of copyrighted materials contained in linked websites and is not responsible for transmissions users receive from linked websites.