The purpose of this chapter is to review and evaluate the findings of this Tier 1 Draft Environmental Impact Statement (Tier 1 Draft EIS) and solicit feedback on the No Action and Action Alternatives. The information presented should be used by stakeholders, the public, and state and federal government agencies to consider and comment on the characteristics, benefits, and costs of the No Action and Action Alternatives. The Federal Railroad Administration (FRA) identified the Action Alternatives through a comprehensive alternatives development and screening process, narrowing the candidates from a list of nearly 100 alternatives to the three Action Alternatives that this Tier 1 Draft EIS evaluates. The Action Alternatives each represent a distinct level of investment for the Northeast Corridor (NEC) (see Chapter 4, Alternatives Considered). The evaluation of Action Alternatives identifies the differences between each Action Alternative and the No Action Alternative.
This chapter presents the impacts and benefits of the No Action and Action Alternatives, but does not recommend a preferred investment program (Preferred Alternative). That decision will be made once the FRA considers comments received from stakeholders and the public on the Tier 1 Draft EIS. The FRA will document its decision on a Preferred Alternative in the Tier 1 Final Environmental Impact Statement.
Each Action Alternative is an end-to-end investment program that achieves a long-term vision for passenger rail on the NEC between Washington, D.C., and Boston, MA. Each Action Alternative represents a vision that would guide future investment as a roadmap for ensuring that individual state and local stakeholder actions remain consistent with a long-term network-wide vision for the NEC.
The Action Alternatives represent the range of possible options to deliver reliable passenger rail service with improved connections to more people and markets. The Action Alternatives allow the FRA to compare the consequences and benefits of distinct visions, but do not determine an exact alignment, specific operator, or services.1
The FRA intends to select an investment program for the NEC based on the analysis presented in this Tier 1 Draft EIS, as well as public and stakeholder input. At this point in the decision-making process, the No Action and Action Alternatives all remain under consideration, and the FRA has not made any decisions regarding a Preferred Alternative. A key step in the FRA's overall decision-making process is to receive and review input from interested parties, including feedback on relative priorities or values placed on the transportation needs of the Study Area.
The FRA is considering a No Action Alternative and three Action Alternatives (Alternatives 1, 2, and 3) in this Tier 1 Draft EIS. The FRA has evaluated each alternative in its entirety for its benefits and effects throughout the Study Area. The benefits and effects of different aspects of the No Action and Action Alternatives will help frame choices about a corridor-wide vision that will define the Preferred Alternative. That vision may include some elements of each of the Action Alternatives to best meet the service needs of specific markets; therefore, it is possible that the Preferred Alternative may involve a re-packaging of elements of the Action Alternatives.2 In this way, the Preferred Alternative will represent a shared vision for the NEC, refined to address local or geographic priorities or to facilitate incremental implementation.
Of the three Action Alternatives, Alternative 3 includes multiple route options for the segment between New York City and Boston. To make sure that there is comparable information for the No Action and Action Alternatives, the FRA decided to present analyses results for Alternative 3 as a range or average of values of the four route options. However, detailed values for each of the Alternative 3 route options, considered as end-to-end investment programs, are also presented separately to facilitate evaluation of the Alternative 3 route options. It is possible that the FRA will select from the route options between New York City and Hartford, CT, and between Hartford and Boston. The FRA is considering only one route option between Washington, D.C., and New York City for Alternative 3.
Given the long-term, conceptual, and programmatic focus of NEC FUTURE, the FRA will build in flexibility to respond to future conditions through a phased, incremental approach to implementation of a Preferred Alternative. This approach will be described in a phasing plan that will be a part of the Service Development Plan; in developing the phasing plan, the FRA will also consider what decisions are imminent, what decisions can be made later, and what considerations for the future should be incorporated now into decision-making. Chapter 10, Phasing Implementation, identifies a Universal First Phase that could apply to any one of the Action Alternatives. The Universal First Phase illustrates the incremental transportation benefits that can be achieved through phasing for each of the Action Alternatives.
As a baseline for comparison, consistent with National Environmental Policy Act requirements, the FRA defined a No Action Alternative that identifies improvements to highway, freight rail, transit, air, and maritime modes that will occur by 2040 regardless of NEC FUTURE. As described in Chapter 4, Alternatives Considered, the No Action Alternative assumes sufficient continued investment in the NEC to maintain operations, but it neither brings the NEC to a state of good repair nor provides additional capacity or services beyond what is available today.3
To understand the overall benefits and effects of each Action Alternative and the regional or local implications, effects data are presented in one of four ways:
As documented in Chapter 4, Alternatives Considered, emerging and new technologies may be applicable to rail service on the NEC and other transportation needs across the Study Area that could influence the rail system performance and therefore are a factor in the evaluation of alternatives. These might include new information systems and services, new train propulsion and guideway systems, fare collection innovations, and safety enhancements.
An advanced guideway system, such as magnetic levitation technology,4 could be used to develop a second NEC spine or portions thereof, similar to the second spine envisioned in Alternative 3. This system would require separate stations, could not support run-through trains from connecting corridors, and would not offer proven integration efficiencies with today's NEC infrastructure and operators. Furthermore, these advanced guideway technologies remain under development. For these reasons, the FRA did not incorporate advanced guideway or similar new technologies in the Action Alternatives.
Such technologies could be studied separately and are not precluded as a future transformative investment in the regional transportation system. Other potential applications of new technology transportation systems could support the NEC passenger rail network by connecting off-corridor markets to the NEC. As other studies provide further insights into the viability of new technologies to meet the market demand in the Study Area, those opportunities will be coordinated with NEC FUTURE.
The FRA chose specific metrics to both evaluate how the No Action and Action Alternatives address the needs for the NEC FUTURE program, and to compare benefits, costs, and other factors among the alternatives.
The evaluation framework is based on the NEC FUTURE Purpose and Need as well as consideration of environmental impacts, cost, and constructability. As such, the evaluation metrics measure, both quantitatively and qualitatively, how well the No Action and Action Alternatives address Study Area needs. Table 9-1 presents the evaluation factors and the specific metrics to evaluate the alternatives. These factors are a refinement of the criteria the FRA used in the early screening of Initial and Preliminary Alternatives (see Appendix B, Tier 1 EIS Alternatives Report and Evaluation of Preliminary Alternatives Report).
Extensive agency, stakeholder, and public dialogue are critical to the FRA's decision-making process.
Factors are defined in two categories for the purposes of evaluating the No Action and Action Alternatives. Needs-based factors represent each of the seven needs identified in the Purpose and Need (Chapter 3). These are supplemented with a set of factors to characterize the costs and benefits of the No Action and Action Alternatives. The FRA used both qualitative and quantitative metrics to evaluate how well the No Action and Action Alternatives address these factors. The relative importance of each factor has not been established. Rather, the evaluation objectively presents findings for the No Action and Action Alternatives. As noted previously, it is expected that public and stakeholder feedback will inform the FRA's consideration of the relative importance of the factors and metrics.
Table 9-1 presents the transition from an earlier set of less detailed metrics used to evaluate Initial and Preliminary Alternatives to show how the current metrics have evolved toward increasingly detailed and quantitative analysis. This evaluation chapter summarizes the analyses presented throughout this Tier 1 Draft EIS. References to additional and more detailed discussions are included where relevant. Of note are Chapter 5, Transportation; Chapter 6, Economic Effects and Growth, and Indirect Effects; and the environmental effects assessments presented in Chapter 7.
| Factors | Early Metrics for Screening | Metrics for Evaluation of Alternatives | ||
|---|---|---|---|---|
| NEC FUTURE NEEDS | ||||
| Aging Infrastructure |
|
|
||
| Capacity |
|
|
||
| Connectivity |
|
|
||
| Performance |
|
|
||
| Resiliency |
|
|
||
| Environmental Sustainability |
|
|
||
| Economic Growth |
|
|
||
| BENEFITS, COSTS, AND OTHER FACTORS | ||||
| Environmental Impacts |
|
|
||
| Capital/O&M Costs |
|
|
||
| Constructability |
|
|
||
Source: NEC FUTURE team, 2015
View full-sized table in new window
The following is a presentation of the evaluation of alternatives by factor. The information is organized by alternative and presented as a total value or assessment. As appropriate, analysis results are summarized for metropolitan areas or key stations or station-pairs. The metropolitan areas and stations are consistent with the analyses presented in Chapter 5, Transportation Effects. Where applicable, data are presented separately for Intercity and Regional services.
Aging and obsolete infrastructure on the existing NEC erodes service quality and increases the cost of and complexity of maintaining the railroad operations. Current investment on the existing NEC falls short of the improvements needed to maintain system reliability or to meet growing demand. Continued underinvestment in the NEC will result in further service disruptions and degradations in service quality. Rail infrastructure also influences passenger rail system safety. Failures associated with aging infrastructure can contribute to train- or station-related incidents involving operations, personnel, and passengers.
To continue current service, the No Action Alternative assumes additional investment in the NEC that exceeds existing funding levels; however, the No Action Alternative addresses only a modest proportion of the significant backlog of improvements. Critical infrastructure projects identified in Chapter 3, Purpose and Need, such as the Baltimore and Potomac Tunnel Replacement, Susquehanna Bridge Replacement, Portal Bridge, Hudson River Tunnels, Norwalk and Saugatuck Bridge Rehabilitation, and Devon Bridge Replacement will not be completed. As a result, the No Action Alternative will continue to rely on aging infrastructure and will fall short of bringing the existing NEC to a state of good repair.
All Action Alternatives would bring the existing NEC to a state of good repair.
All of the Action Alternatives would bring the NEC to a state of good repair by replacing or renewing aging infrastructure on the existing NEC and eliminating the backlog of infrastructure requiring replacement, enabling all future capital upgrades to be planned and implemented according to a regular replacement cycle. All of the previously identified critical infrastructure projects are included in each of the Action Alternatives. (Appendix B, Tier 1 EIS Alternatives Report, provides a complete list of the major backlog or critical infrastructure projects included in the Action Alternatives.) The Action Alternatives also provide numerous equipment and infrastructure upgrades that would improve reliability and reduce delays associated with equipment failures or infrastructure deficiencies.
The existing NEC operates at or close to its capacity at multiple locations during peak travel periods. Adding capacity is essential to accommodating projected future growth in travel and is a key element of each of the Action Alternatives. Adding capacity entails relieving critical chokepoints on the rail network, adding new main line tracks where needed, upgrading stations and building new stations, and increasing the size of the rolling stock fleet and the capacity of rail yards. The portions of the NEC approaching the Major Hub stations at Washington, D.C., New York City, and Boston are among the locations where existing rail traffic and ridership push the limits of available capacity and, therefore, are good examples to illustrate how each of the Action Alternatives would increase and utilize capacity.
Railroad Capacity Utilization
A key metric for calculating the capacity of a section of a rail line is the maximum practical number of trains that can be operated in a single direction of travel during the peak hour (defined as trains per hour or TPH). The theoretical capacity of a line is based on the maximum throughput of trains permitted by the signaling system and assumes uniform train equipment performance and optimum performance of equipment, train engineers and dispatchers. A more useful and appropriate measure of capacity, for purposes of this analysis, is practical capacity,5 which is lower than theoretical capacity, because it holds some capacity in reserve, to allow for the normal variations in operating conditions that occur on a day-to-day basis and to permit the system to recover from minor delays. (Service planning assumptions and methodology are further described in Appendix B, Service Plans and Train Equipment Options Technical Memorandum.)
Railroad capacity is defined for a segment of the rail corridor as opposed to the corridor as a whole, since the configuration of tracks and the mix of equipment and patterns of service vary along the corridor. Operating the NEC at or near practical capacity limits the railroad operator's ability to recover from unanticipated events, often resulting in service delays and reduced reliability. As such, practical capacity should be greater than the total ridership. Where total ridership is greater than practical capacity, the risk of service delays is increased.
For purpose of this analysis, the FRA identified four key segments, or screenlines, to measure capacity and capacity utilization. These screenlines, which are defined as imaginary lines across which rail and passenger traffic can be counted or measured, are located at the following locations:
The utilization of capacity and the availability of residual railroad capacity are both important considerations in the evaluation of the extent to which each Action Alternative is able to fulfill its objectives with respect to the role of rail in serving interregional and regional travel demand within the Study Area.
Alternative 1 makes a major investment in capacity across the Hudson River screenline, with new tunnels (creating two new tracks) parallel to the existing tunnels and expansion of Penn Station New York. This increases the available peak-hour train slots from 24 to 44, an increase of over 80 percent. The East River screenline slots, however, are at 100 percent practical capacity under Alternative 1. Alternative 2, which adds two additional tracks at the East River screenline, would relieve East River chokepoint, providing 10 additional slots and excess capacity beyond what will be required in 2040 across the East River. Alternative 3 provides new tunnels across the Hudson River screenline consistent with Alternative 2, and includes additional slots at all screenlines to provide for future growth beyond the 2040 horizon year.
Alternative 3 provides new tunnels at the Hudson River screenline and includes additional slots at all screenlines to provide for future growth beyond the 2040 horizon.
Table 9-2 presents measures of peak-hour rail service capacity and practical capacity at the four screenline locations approaching the major hubs on the NEC. The table indicates practical capacity and utilization in terms of the number of train slots. Utilization is presented for Intercity and Regional rail trains that operate in the standard peak-hour in the peak direction of travel at the four screenline locations - based on the representative service plans for the No Action and Action Alternatives. The No Action Alternative approximates existing service levels, presenting the standard peak hour for consistency of analysis. As described in Chapter 4, Alternatives Considered, the No Action Alternative represents an NEC in 2040 that continues today's service levels, and while the No Action Alternative does not provide for an increase in capacity at most existing chokepoints, it does include increased capacity into New York City via the East Side Access project. At each screenline, the number of Regional rail trains is significantly higher than the number of Intercity trains, reflecting the dominance of commuter travel in the major market areas during weekday peak periods. Each Action Alternative shows significant capacity growth in both Intercity and Regional rail service, compared with the No Action Alternative.
Alternative 1 includes four Hudson River tunnel tracks (two existing and two new), which would dramatically increase the peak-hour capacity at the Hudson River screenline. Alternative 2 also includes four Hudson River tunnel tracks (two existing and two new). The peak-hour capacity would rise incrementally to 52 TPH, because station facilities in New York City are configured to permit higher-capacity through-running operations continuing under the East River. The available capacity at the screenline would more than double, compared with the No Action Alternative, and would provide room for growth in both Intercity and Regional rail travel across the Hudson River. The number of Regional rail trains double in Alternative 2 as compared with the No Action Alternative. Alternative 3 adds four new tunnel tracks beneath the Hudson River, for a total of six tracks, providing 76 train slots in the peak hour and peak direction of travel. This represents a dramatic increase in available capacity compared with the 24 peak-direction slots in existing tunnels in the No Action Alternative. Both Alternatives 2 and 3 provide levels-of-service that respond to traveler demand and grow the role of rail relative to other trans-Hudson travel modes at the Hudson River screenline. This contrasts with the No Action Alternative, which does not create sufficient train capacity at the Hudson River (or at the other major screenline locations) to keep up with growth in demand.
| Screenline | Existing NEC | No Action Alternative | Alternative 1 | Alternative 2 | Alternative 3 (range) |
|---|---|---|---|---|---|
| Washington, D.C. (north of Union Station) | |||||
| Total Practical Capacity (Slots/Hour) | 12 | 12 | 16 | 20 | 32 |
| Total Intercity (EXP+IC) | 2 | 2 | 6 | 10 | 12 |
| Regional Rail | 4 | 4 | 6 | 10 | 12 |
| Total Trains (EXP+IC+REG) | 6 | 6 | 12 | 20 | 24 |
| Hudson River | |||||
| Total Practical Capacity (Slots/Hour) | 24 | 24 | 44 | 52 | 76 |
| Total Intercity (IC & EXP) | 3 | 3 | 7 | 10 | 16 |
| Regional Rail | 21 | 21 | 30 | 42 | 54 |
| Total Trains (EXP+IC+REG) | 24 | 24 | 37 | 52 | 70 |
| East River (PSNY --> Queens) | |||||
| Total Practical Capacity (Slots/Hour) | 38 | 38 | 48 | 70 | 74 |
| Total Intercity (IC & EXP) | 2 | 2 | 6 | 10 | 8-16 |
| Regional Rail | 36 | 36 | 42 | 50 | 52-25 |
| Total Trains (EXP+IC+REG) | 38 | 38 | 48 | 60 | 60-74 |
| Boston (South of Back Bay Station (NEC)) | |||||
| Total Practical Capacity (Slots/Hour) | 24 | 24 | 24 | 24 | 24-40 |
| Total Intercity (IC & EXP) | 1 | 1 | 5 | 8 | 4-12 |
| Regional Rail | 9 | 9 | 12 | 14 | 20 |
| Total Trains (EXP+IC+REG) | 10 | 10 | 17 | 22 | 24-32 |
Source: NEC FUTURE: Service Plans, 2015
EXP=Express; IC=Intercity-Corridor; REG=Regional rail; Intercity - Corridor service includes Metropolitan, Off-Corridor and Long Distance services
Passenger Capacity Utilization
Passenger-carrying capacity (defined as passengers per hour or PPH) on a section of rail line is calculated by taking train capacity in TPH-measured as either the number of peak-hour trains or the maximum practical number of peak-hour slots - and multiplying by the average practical seating capacity per train, which is a function of the mix of train types and service patterns in the service plan. Seats on the train are used as a surrogate for the number of passengers that can be carried, since Intercity trains require reservations and Regional rail service standards are based on passengers being able to obtain seats on unreserved trains. Passenger capacity utilization is calculated as the ratio of peak-hour ridership to peak-hour seating capacity. A related statistic is residual capacity, which calculates the available capacity that exists in the peak hour at each screenline location, measured in terms of available seats. These are two ways of comparing the volume of traffic with the capacity available at a single point on the NEC. Table 9-3 shows peak-hour passenger-carrying capacity as measured in practical seats and ridership (passengers per hour or PPH) at the four screenlines.
| Screenline | Existing NEC | No Action Alternative | Alternative 1 | Alternative 2 | Alternative 3 (range) |
|---|---|---|---|---|---|
| Washington, D.C. (north of Union Station) | |||||
| Practical Seats (EXP+IC+REG) | 5,200 | 6,400 | 11,800 | 17,400 | 20,900 |
| Total Ridership (pph) | 4,800 | 6,600 | 9,600 | 11,200 | 12,300-12,500 |
| Hudson River | |||||
| Practical Seats (EXP+IC+REG) | 28,700 | 28,900 | 44,800 | 63,000 | 78,900 |
| Total Ridership (pph) | 28,800 | 30,400 | 45,000 | 61,300 | 71,000-71,300 |
| East River (Queens --> PSNY) | |||||
| Practical Seats (EXP+IC+REG) | 38,100 | 38,300 | 45,400 | 56,300 | 67,300-69,200 |
| Total Ridership (pph) | 36,000 | 32,800 | 42,500 | 49,300 | 52,200-52,600 |
| Boston (South of Back Bay Station (NEC)) | |||||
| Practical Seats (EXP+IC+REG) | 9,000 | 10,000 | 16,100 | 20,900 | 20,300-26,600 |
| Total Ridership (pph) | 7,100 | 9,600 | 13,500 | 14,700 | 18,200-18,700 |
Source: NEC FUTURE Service Plans, 2015; NEC FUTURE Intercity Travel Demand Model outputs, April 2015; Regional Travel Demand Model outputs, April 2015
EXP=Express; IC=Intercity-Corridor; REG=Regional rail; Intercity - Corridor service includes Metropolitan, Off-Corridor and Long Distance services
In the No Action Alternative, peak-hour ridership is close to or in excess of available capacity at three of the four screenlines: Washington, D.C., the Hudson River, and Boston. The East River screenline has ample capacity, with the inclusion of the MTA-Long Island Rail Road East Side Access project and four existing East River tunnels. No Action Alternative ridership at the Hudson River screenline exceeds seating capacity in the peak hour by 1,500 passengers, which means that by 2040 there will be more standees on Regional rail trains, and Intercity travelers will be unable to travel on their preferred Intercity trains into and out of New York City.
In Alternative 1, all four screenline locations show a high level of peak utilization. In Alternatives 2 and 3, ridership levels are significantly higher than in the No Action Alternative. In Alternative 2, the volume of Intercity ridership in the standard peak hour would increase by over 150 percent compared with the No Action Alternative, while the level of train service would increase by approximately 230 percent. This results in a level of utilization that has approximately two out of every three train seats filled during peak hours. In Alternative 3, projected 2040 ridership is slightly above 71,000 in the peak hour at the Hudson River screenline, below the practical capacity of seats that would be provided. At all other screenlines, practical capacity of seats is greater than the projected ridership.
Ridership
Overall, there would be an increase in both Intercity and Regional rail travel with any of the Action Alternatives compared to the No Action Alternative. The FRA considered three metrics in its evaluation of ridership:
When compared to the No Action Alternative, Alternative 1 would grow overall passenger rail ridership by 16%, Alternative 2 would see an increase of 21%, and Alternative 3 an increase of 33%.
Table 9-4 summarizes Intercity and Regional passenger rail trips and passenger miles for the No Action and Action Alternatives; Table 9-5 provides details for each of the Alternative 3 route options. Ridership is presented in 1,000s (thousands) of linked trips, or a complete one-way trip from origin to destination, regardless of whether a transfer was required for the trip. These ridership forecasts are constrained by the seats/train capacity assumed for the No Action and Action Alternatives (see discussion in Section 9.4.1.2 on Capacity). As ridership for Regional and Intercity services were estimated using different forecasting tools (as explained in Chapter 5, Transportation) the data presented is considered conservative and does not forecast the future opportunity for additional ridership when improved connectivity between Regional and Intercity services are considered.
| No Action | Alternative 1 | Alternative 2 | Alternative 3 (average) | |
|---|---|---|---|---|
| Annual Passenger Trips (in 1,000s of one-way trips) | ||||
| Intercity Rail | 19,300 | 75% | 92% | 102% |
| Regional Rail | 419,800 | 13% | 18% | 30% |
| Total Trips | 439,100 | 16% | 21% | 33% |
| Annual Passenger Miles (in 1,000s) | ||||
| Intercity Rail | 3,103,000 | 81% | 101% | 112% |
| Regional Rail | 11,264,400 | 11% | 19% | 31% |
| Total Passenger Miles | 14,367,400 | 26% | 37% | 48% |
Source: NEC FUTURE Travel Demand Model outputs, April 2015
| No Action | Central Connecticut/ Providence |
Long Island/ Providence |
Long Island/ Worcester |
Central Connecticut/ Worcester |
|
|---|---|---|---|---|---|
| Annual Passenger Trips (in 1,000s of one-way trips) | |||||
| Intercity Rail | 19,300 | 102% | 101% | 106% | 100% |
| Regional Rail | 419,800 | 30% | 30% | 30% | 30% |
| Total Trips | 439,100 | 33% | 33% | 33% | 33% |
| Annual Passenger Miles (in 1,000s) | |||||
| Intercity Rail | 3,103,000 | 115% | 105% | 116% | 111% |
| Regional Rail | 11,264,400 | 31% | 31% | 31% | 31% |
| Total Passenger Miles | 14,367,400 | 49% | 47% | 49% | 48% |
Source: NEC FUTURE Travel Demand Model outputs, April 2015
Table 9-4 and Table 9-5 summarize the increase in passenger trips and passenger miles for each Action Alternative when compared to the No Action Alternative. Commensurate with the increasing service levels and improved connectivity to existing and new markets, the Action Alternatives have increasing levels of ridership. The increase in passenger trips ranges from 16 percent to 33 percent (including both Intercity and Regional rail trips) over the No Action Alternative. The geographic distribution of these increased ridership levels would vary by Action Alternative.
Similar to the range of increase in passenger trips, passenger miles would also increase as a result of increased passenger trips across the Action Alternatives. When compared to the No Action Alternative, Intercity passenger rail miles for Alternatives 1, 2 and 3 would increase 81 percent, 101 percent, and 112 percent respectively. Regional passenger miles would also increase in each of the Action Alternatives as a result of increased passenger trips.
Forecast passenger trips and passenger miles show that average trip length would remain relatively constant across the Action Alternatives, with the growth in passenger miles slightly outpacing growth in passenger trips, particularly for Intercity travel. For example, Alternative 3 Intercity passenger miles would increase by 112 percent and Intercity passenger trips would increase by 102 percent compared to the No Action Alternative, suggesting increased trip lengths. This result is indicative of the overall improvement in performance (frequency, service type, travel time) for trips of varying length. The FRA's analysis demonstrates how people's choice of travel mode might shift with overall improvement in performance in passenger rail service. However, the dynamic between how proposed passenger rail improvements might change travel patterns and economic development, which would change the distribution of passenger trips and the length of those trips, warrants further investigation in subsequent project-level analyses.
Table 9-5 summarizes ridership for the Alternative 3 route options. With regard to passenger rail trips and passenger miles, the Alternative 3 route options are similar with overall passenger trips increasing by 33 percent and passenger miles increasing by an average 48 percent when compared to the No Action Alternative.
As shown in Table 9-6 and Table 9-7, the New York-New Jersey metropolitan area would have the most intercity ridership in all Action Alternatives. In Alternative 3, the Boston metropolitan area would have the greatest percentage of growth in intercity ridership over the No Action Alternative. The Hartford metropolitan area ridership would grow in all Action Alternatives, with the most growth occurring in Alternative 3. From a geographic perspective, there would be overall greater growth in intercity ridership in the north than in the south of the Study Area for all Action Alternatives.
The forecast number of passenger rail trips is constrained by the service capacity. At this level of detail, the ridership analysis does not measure the passenger loading of each individual train, but rather compares the ridership to the total number of trains/seats available throughout the time period. Similarly, where stations are located in close proximity, specific boardings per station should be considered together. For example, the FRA has grouped together boardings at existing Philadelphia's 30th Street Station and a proposed Market East Station to capture the overall market potential in Philadelphia.6
| Geography | (in 1,000s of one-way trips) | |||
|---|---|---|---|---|
| No Action | Alternative 1 | Alternative 2 | Alternative 3 (average) |
|
| Greater Washington Area | 3,440 | 5,045 | 5,420 | 5,710 |
| Greater Philadelphia Area | 3,035 | 4,645 | 5,045 | 5,130 |
| New York-North Jersey Area | 7,390 | 13,520 | 14,840 | 15,770 |
| Greater Hartford Area | 585 | 1,705 | 1,905 | 2,065 |
| Greater Boston Area | 1,705 | 3,260 | 3,825 | 4,335 |
Source: NEC FUTURE Travel Demand Model outputs, April 2015
| Geography | (in 1,000s of one-way trips) | |||
|---|---|---|---|---|
| Central Connecticut / Providence | Long Island / Providence | Long Island / Worcester | Central Connecticut / Worcester | |
| Greater Washington Area | 5,715 | 5,725 | 5,805 | 5,585 |
| Greater Philadelphia Area | 5,050 | 5,205 | 5,220 | 5,045 |
| New York-North Jersey Area | 15,650 | 15,810 | 16,145 | 15,470 |
| Greater Hartford Area | 2,045 | 2,065 | 2,090 | 2,065 |
| Greater Boston Area | 4,235 | 4,165 | 4,490 | 4,445 |
Source: NEC FUTURE Travel Demand Model outputs, April 2015
Trip Diversion
Using the No Action Alternative as a baseline, the FRA measured the effectiveness of each of the Action Alternatives in achieving their respective service objectives (maintain, grow, transform) by measuring trips diverted from other modes. Table 9-8 summarizes the total forecasted Intercity rail trips and those diverted from auto, air, or intercity bus. Intercity rail trips also include those trips diverted from one rail service to another (for example, from Intercity-Corridor to Intercity-Express). As described in Chapter 4, Alternatives Considered, the FRA assumed a 30 percent discount from current fares on non-express services to calculate expected ridership, revenues, and O&M costs for each of the Action Alternatives. The proposed fare structure of all Action Alternatives would result in some travelers diverting from Intercity-Express to Intercity-Corridor services due to the trip time improvement from the No Action Alternative, greater market coverage, and lower price for the Intercity-Corridor services.
In Alternative 1, 36 percent of the total Intercity rail trips would be diverted from other modes; of those diversions, the majority are auto diversions. Alternatives 2 and 3 perform similarly, with the majority of total diversions coming from auto. Alternative 3 would provide significant residual capacity, available to accommodate future growth in ridership beyond what is estimated in the regional models for 2040.
The effectiveness of the Action Alternatives in diverting trips from auto is also reflected in the annual reduction in VMT (Table 9-9). Increases in both Intercity and Regional rail ridership would result in reduced VMT; the largest reductions would be achieved in Alternative 3. Table 9-10 provides details for each of the Alternative 3 route options.
| Mode | Alternative 1 | Alternative 2 | Alternative 3 (range) |
|---|---|---|---|
| Auto Diversions | 9,500 | 12,700 | 13,500-14,200 |
| Air Diversions | 1,300 | 1,800 | 2,200-2,300 |
| Intercity Bus Diversions | 1,400 | 1,700 | 1,900-2,000 |
| Total Diversions (Auto, Air, Intercity Bus) | 12,200 | 16,200 | 17,600-18,500 |
| Total Intercity Rail Trips | 33,600 | 37,100 | 38,600-39,800 |
| % Trips Diverted from Auto, Air, Intercity Bus | 36% | 44% | 46%-47% |
Source: NEC FUTURE Travel Demand Model outputs, April 2015
| Market/Service Type | Alternative 1 | Alternative 2 | Alternative 3 (average) |
|---|---|---|---|
| Intercity Rail VMT Reduction | (1,300) | (1,700) | (1,900) |
| Regional Rail VMT Reduction | (700) | (900) | (1,200) |
| TOTAL VMT Reduction | (2,000) | (2,600) | (3,100) |
Source: NEC FUTURE Travel Demand Model outputs, April 2015
| Market / Service Type | Central Connecticut / Providence | Long Island / Providence | Long Island / Worcester | Central Connecticut / Worcester |
|---|---|---|---|---|
| Intercity Rail VMT Reduction | (1,900) | (1,800) | (2,000) | (1,900) |
| Regional Rail VMT Reduction | (1,200) | (1,200) | (1,200) | (1,200) |
| TOTAL VMT Reduction | (3,100) | (3,000) | (3,200) | (3,100) |
Source: NEC FUTURE Travel Demand Model outputs, April 2015
Connectivity is measured by change in service frequency for city-pairs for the NEC as well as the connecting corridors. Also of interest is the change in intermodal connectivity, for example, improved access to airports. Chapter 5, Transportation, presents a detailed assessment of improvements at representative stations including: change in type of service, volume of service, and travel times to other stations. As described in Section 9.4.1.7, Economic Growth, an additional metric is the number of places accessible within 30 minutes of train travel time from Hub stations, which indicates areas with improved access to rail service.
Air-Rail Connectivity
More direct passenger rail service to Study Area airports would improve air-rail connectivity and enhance the complementarity of the two modes, providing service redundancy when there are unanticipated events causing service disruptions in either rail or air service. Table 9-11 shows the Intercity and Regional train frequency for each of the existing and new airport stations. In the No Action Alternative, Baltimore/Washington International Thurgood Marshall Airport and Newark Liberty International Airport would continue to be served by Intercity rail service. T.F. Green Airport in Providence, RI, and Philadelphia International Airport would be served only by Regional rail service in the No Action Alternative, as they are today. Alternatives 2 and 3 propose improved Intercity services to these existing airport stations and add new air-rail connections to a new Philadelphia International Airport7 station within the Airport property., and new Intercity service to the existing T.F. Green Airport8 station.
| Airport Station | No Action | Alternative 1 | Alternative 2 | Alternative 3 |
|---|---|---|---|---|
| Baltimore/Washington International Thurgood Marshall | 143 | 252 | 386 | 452 |
| Philadelphia International | 72 | 72 | 308 | 374 |
| Newark Liberty International | 153 | 480 | 708 | 1014 |
| T.F. Green | 10 | 102 | 100 | 100 |
Source: NEC FUTURE team, 2015
Note: The daily number of daily trains includes Intercity - Express, Intercity-Corridor, and Regional train service.
While Alternatives 2 and 3 both would offer service to Philadelphia International Airport, the Alternative 3 Intercity Rail service to Philadelphia International Airport is less frequent as the service splits west of Philadelphia to serve both the new spine (Philadelphia International Airport and Philadelphia Market East stations) as well as the existing NEC (Philadelphia 30th Street station). Intercity trains would also serve T.F. Green Airport9 station in all the Action Alternatives.
In addition to direct passenger rail service to Study Area airports, other airports in the Study Area would benefit from improved connections to connecting corridors. For example, passengers bound for Bradley International Airport at Windsor Locks, CT, can access Intercity and Regional service at New Haven or Hartford to Windsor Locks via the New Haven-Hartford-Springfield Line.
As noted in Chapter 3, Purpose and Need, air-rail connectivity is also measured by the competitiveness of passenger rail to relieve the growing demands on capacity constrained airports in the Study Area. The largest air-to-rail diversions occur in Alternative 3, which also has the most travel-time savings. A travel-time savings of approximately 1 hour 30 minutes between New York City and Boston in Alternative 3 results in the largest number of travelers shifting from air to rail with diversions of 341,800 to 354,200 annual trips (as shown in Table 9-12 and Table 9-13).
| Metro Area to Metro Area | Alternative 1 | Alternative 2 | Alternative 3 (range) | |
|---|---|---|---|---|
| Greater Washington Area | New York-North Jersey Area | 83,000 | 163,500 | 195,300-246,000 |
| Greater Philadelphia Area | Greater Washington Area | 25,300 | 31,500 | 33,300-34,300 |
| New York-North Jersey Area | Greater Boston Area | 215,600 | 274,000 | 341,800-354,200 |
| Greater Boston Area | Greater Philadelphia Area | 41,900 | 47,200 | 44,000-46,000 |
| Greater Washington Area | Greater Boston Area | 79,700 | 94,300 | 123,700-138,800 |
Source: NEC FUTURE team, April 2015
Note: Air-to-rail diversions are a portion of the increased annual rail trips over the No Action Alternative.
| Metro Area to Metro Area | Central CT / Providence | Long Island / Providence | Long Island / Worcester | Central CT / Worcester | |
|---|---|---|---|---|---|
| Greater Washington Area | New York-North Jersey Area | 216,800 | 241,600 | 246,000 | 195,300 |
| Greater Philadelphia Area | Greater Washington Area | 33,300 | 34,300 | 33,300 | 33,600 |
| New York-North Jersey Area | Greater Boston Area | 343,500 | 341,800 | 354,200 | 351,200 |
| Greater Boston Area | Greater Philadelphia Area | 45,500 | 44,100 | 44,000 | 46,100 |
| Greater Washington Area | Greater Boston Area | 130,100 | 123,700 | 133,400 | 138,800 |
Source: NEC FUTURE team, April 2015
Note: Air-to-rail diversions are a portion of the increased annual rail trips over the No Action Alternative.
Intercity and Regional Rail Connectivity
Table 9-14 presents a representative assessment of improvements in connectivity within the Study Area and is representative of typical service volumes between similar station types for each alternative. Increases in daily Intercity service volumes where there is a direct, one-seat connection are common in all Action Alternatives. Increases in volume are typically related to the change in the service plan and investment program. For example, Alternative 1 would double, Alternative 2 would almost triple, and Alternative 3 would quadruple Intercity rail service between Washington, D.C., and New York City as compared to the No Action Alternative.
| Representative Station-Pairs | No Action | Alternative 1 | Alternative 2 | Alternative 3 (average) | Alternative 3 (range) | |
|---|---|---|---|---|---|---|
| Station 1 | Station 2 | |||||
| Washington | Penn Station New York | 36 | 70 | 96 | 150 | 148-151 |
| Odenton | Trenton | 0 | 22 | 46 | 24 | 23-44 |
| New Haven | Philadelphia | 18 | 51 | 85 | 107 | 60-120 |
| Ronkonkoma | Boston South Station | 0 | 0 | 0 | 38 | 0-76 |
| Hartford | Washington, D.C. | 2 | 9 | 62 | 74 | 65-83 |
| Penn Station New York | Boston South Station | 19 | 47 | 88 | 143 | 142-144 |
| Washington | Boston South Station | 17 | 40 | 92 | 102 | 101-105 |
| Hartford | Stamford | 2 | 9 | 100 | 48 | 37-59 |
Source: NEC FUTURE team, 2015
Service to Philadelphia includes 30th Street Station and Philadelphia Market East Station, which are both served in Alternative 3.
Each of the Action Alternatives would introduce Intercity service to new stations within the Study Area. For example, in the No Action Alternative, Odenton, MD, is served only by Regional rail; by contrast, in each of the Action Alternatives, Odenton is to be served by Intercity service. The Action Alternatives propose Intercity service between Odenton and Trenton, NJ, at service volumes ranging between 22 and 46 daily Intercity trains, depending on the Action Alternative. Intercity service is introduced to Ronkonkoma on Long Island, NY (and to Long Island in general) in Alternative 3 route options. Roughly 75 trains a day would connect Ronkonkoma and Boston South Station, specifically in Alternative 3 route options between Long Island and Providence and Long Island and Worcester.
From a Regional rail perspective, the No Action Alternative will continue to serve the same 77 local stations that exist on the NEC today. Alternative 1 adds 10 new local stations, including three each in Maryland and in New York. Similar to the No Action Alternative, five local stations would be upgraded to Hub stations to accommodate Intercity service. Alternative 2 adds 12 new local stations as compared to the No Action Alternative, 10 of which would be located on the existing NEC. Alternative 2 adds three additional local stations, located off-corridor in Connecticut. Alternative 2 would upgrade five stations from Local stations to Hub stations, connecting Regional rail service and Intercity rail services.
Alternatives 3 adds between 13 and 18 new Local stations, 10 of which would be located on the existing NEC. The remaining stations would be located on route options in New York and Massachusetts. Between five and seven stations would be upgraded from Local stations to Hub stations, connecting Regional rail service and Intercity rail services.
As described in Chapter 4, Alternatives Considered, Intercity-Corridor service includes a new service concept - Metropolitan - that offers improved service to markets and key transfer locations, and stops at more stations than current Intercity-Corridor service. As such, Action Alternatives with inland connections to Hartford, CT, Providence, RI, and Worcester, MA, would provide dramatic increases in service for select station-pairs. Intercity service between Hartford and Washington, D.C., for example, would increase from 2 daily trains in the No Action Alternative to 62 trains in Alternative 2, and 65 to 83 trains in Alternative 3. Intercity service between Hartford and Stamford, CT, would increase from 2 daily trains in the No Action Alternative to 100 daily trains in Alternative 2, and 37 to 59 daily trains in Alternative 3.
Connecting Corridors
Connectivity improvements resulting from the Action Alternatives would also be realized for services to connecting corridors, including Intercity-Corridor services south of Washington Union Station to Richmond, VA, and Virginia and North Carolina; Keystone Corridor service from Philadelphia 30th Street Station to Harrisburg and points west; Empire Corridor service from Penn Station New York to Albany and western New York; and New Haven-Hartford-Springfield service from Hartford to Springfield.
The FRA evaluated changes in service volumes for representative stations on each of the above connecting corridors to either Penn Station New York or Washington Union Station. Table 9-15 depicts daily Intercity service volumes, measured as trains per day, for these representative station-pairs. Service volumes would increase on each of the connecting corridors in all Action Alternatives, thereby providing more service and improved connections to New York and Washington, D.C., as well as intermediate destinations. The greatest increase in service would be on the New Haven-Hartford-Springfield Line, where one-seat-ride service would be available from Springfield to both Penn Station New York and Washington Union Station. Daily service from Springfield to Penn Station New York would increase from 2 trips a day in the No Action Alternative to 37 a day in Alternative 3. Daily service to Washington Union Station would increase from 2 trips a day to 9-10 trips a day in Alternatives 2 and 3, respectively.
| Connecting Corridors - Representative Station - Pairs | No Action | Alternative 1 | Alternative 2 | Alternative 3 (average) | |
|---|---|---|---|---|---|
| From | To | ||||
| South of Washington, D.C. | |||||
| Richmond Staples Mill Road | Washington Union Station | 9 | 14 | 14 | 15 |
| Richmond Staples Mill Road | Penn Station New York | 9 | 13 | 14 | 14 |
| Keystone Corridor | |||||
| Harrisburg | Washington Union Station | 0 | 12 | 21 | 20 |
| Harrisburg | Penn Station New York | 9 | 13 | 22 | 21 |
| Empire Corridor | |||||
| Albany-Rensselaer | Washington Union Station | 0 | 21 | 21 | 21 |
| Albany-Rensselaer | Penn Station New York | 12 | 22 | 22 | 22 |
| New Haven-Hartford-Springfield | |||||
| Springfield | Washington Union Station | 2 | 9 | 10 | 10 |
| Springfield | Penn Station New York | 2 | 9 | 27 | 37 |
Source: NEC FUTURE team, 2015
Station-pairs are representative of typical service volumes between similar station types.
The Action Alternatives would also improve connectivity to Washington Union Station and Penn Station New York via the Keystone and Empire Corridors, with increased service frequency and more convenient transfers to existing NEC services. In all Action Alternatives, there would be 21 trains per day between Albany-Rensselaer and Washington Union Station.10 On the Keystone Corridor, service would range from 13 to 22 trains per day between Harrisburg, PA, and Washington Union Station, depending on the Action Alternative. South of Washington, D.C., service to Washington Union Station and Penn Station New York would increase to about 1.5 times the amount of service that exists in the No Action Alternative.
Regional rail operates on all connecting corridors in the Action Alternatives, though the extent of service is less than Intercity service. South of Washington, D.C., Regional rail service operates between Fredericksburg, VA, and Washington, D.C., with additional connections to Intercity and Regional Rail services at Washington Union Station. On the Keystone Corridor, Regional rail service operates between Thorndale, PA, and Philadelphia 30th Street Station, with additional connections to Intercity and Regional rail services at Philadelphia 30th Street Station. Regional rail service operates from New York City north to Poughkeepsie, NY; however, service terminates at Grand Central Terminal in New York City, not Penn Station New York, which is the terminal for Intercity services. The Empire Corridor Intercity service connects to the existing NEC at Penn Station New York.. On the New Haven-Hartford-Springfield Line, Regional rail service is planned as part of the No Action Alternative. This new Regional rail service will operate between New Haven, CT, and Springfield, MA,11 with additional connections to Intercity and Regional rail services at New Haven, CT; and Intercity service connections at Hartford, CT, and Springfield, MA. This service provides an important connection to the proposed NNEIRI service to Springfield where connections would be possible to points north to Vermont and Canada and west to Worcester and Boston.12
Passenger rail performance, as measured by travel time and reliability, would improve in the Action Alternatives when compared to the No Action Alternative. Capacity improvements relieve bottlenecks and improve service performance while also extending the reach of the passenger rail network to new markets (see Section 9.4.1.3, Connectivity). Metrics for performance improvement include average travel times and service reliability.
Reliability and on-time performance improvements for Regional rail service would result in improved travel times, particularly in the peak hour, peak direction. The Action Alternatives would reduce the causes of train delay - such as infrastructure failure, infrastructure maintenance, and rolling stock failure - as assets are brought to a state of good repair and rolling stock is replaced. As new rail infrastructure is constructed as part of the Action Alternatives, network interaction would improve, and chokepoints and schedule conflicts would be eliminated. (See Appendix B for additional details on how delay-related assumptions influence service planning of the Action Alternatives.)
The Action Alternatives would also improve Intercity travel times between representative city-pairs (stations). As shown in Table 9-16, average Intercity-Express travel times from Washington Union Station to Penn Station New York would decrease by nearly 60 minutes on average in Alternative 3. Between Washington, D.C., and Hartford, CT, Intercity regional travel times would decrease by approximately 90 minutes in Alternative 2, and on average nearly 2 hours and 15 minutes in Alternative 3. Table 9-17 shows the average travel times between representative stations for Alternative 3 route options.
| Station 1 | Station 2 | No Action | Alternative 1 | Alternative 2 | Alternative 3 (Average) | ||||
|---|---|---|---|---|---|---|---|---|---|
| Express | Corridor | Express | Corridor | Express | Corridor | Express | Corridor | ||
| Washington (WAS) | Penn Station New York (NYP) | 2:47 | 3:23 | 2:43 | 3:08 | 2:26 | 3:01 | 1:47 | 2:51 |
| Odenton (ODN) | Trenton (TRE) | - | - | - | 2:10 | - | 2:03 | NA | 1:43 |
| New Haven (NHV) | Philadelphia (PHL) | 2:50 | 3:23 | 2:27 | 2:48 | 2:09 | 2:35 | NA | 2:36 |
| New Haven (NHV) | Phil.-Market East (PME) | - | - | - | - | - | - | 1:54 | 2:09 |
| Ronkonkoma (RNK) | Boston South Station (BOS) | - | - | - | - | - | - | 1:31 | 1:43 |
| Hartford (HFD) | Washington (WAS) | - | 6:35 | - | 5:14 | 4:05 | 5:02 | 3:02 | 4:19 |
| Penn Station New York (NYP) | Boston South Station (BOS) | 3:31 | 4:13 | 2:54 | 3:33 | 2:33 | 3:03 | 2:01 | 2:36 |
| Washington (WAS) | Boston South Station (BOS) | 6:33 | 8:02 | 5:45 | 6:55 | 5:07 | 6:07 | 3:57 | 5:35 |
| Hartford (HFD) | Stamford (STM) | - | 2:08 | - | 1:27 | 0:59 | 1:11 | 1:03 | 1:10 |
Source: NEC FUTURE Intercity Travel Demand Model outputs, April 2015
- = No connection for that station-pair and/or service type.
| Station 1 | Station 2 | Central Connecticut / Providence | Long Island / Providence | Long Island / Worcester | Central Connecticut / Worcester | ||||
|---|---|---|---|---|---|---|---|---|---|
| Express | Corridor | Express | Corridor | Express | Corridor | Express | Corridor | ||
| Washington (WAS) | Penn Station New York (NYP) | 1:47 | 2:51 | 1:48 | 2:51 | 1:47 | 2:51 | 1:48 | 2:51 |
| Odenton (ODN) | Trenton (TRE) | - | 1:43 | - | 1:43 | - | 1:43 | - | 1:44 |
| New Haven (NHV) | Philadelphia (PHL) | - | 2:37 | - | 2:36 | - | 2:36 | - | 2:37 |
| New Haven (NHV) | Phil.-Market East (PME) | 2:05 | - | 1:45 | 2:11 | 1:44 | 2:08 | 2:04 | - |
| Ronkonkoma (RNK) | Boston South Station (BOS) | - | - | 1:34 | 1:45 | 1:28 | 1:41 | - | - |
| Hartford (HFD) | Washington (WAS) | 3:12 | 4:13 | 3:14 | 4:27 | 2:58 | 4:21 | 2:46 | 4:15 |
| Penn Station New York (NYP) | Boston South Station (BOS) | 1:57 | 2:33 | 1:57 | 2:42 | 2:07 | 2:37 | 2:03 | 2:32 |
| Washington (WAS) | Boston South Station (BOS) | 3:52 | 5:31 | 3:54 | 5:42 | 4:03 | 5:35 | 4:01 | 5:32 |
| Hartford (HFD) | Stamford (STM) | 1:15 | 1:18 | 0:52 | 1:03 | - | 1:03 | - | 1:17 |
Source: NEC FUTURE Intercity Travel Demand Model outputs, April 2015
- = No connection for that station-pair and/or service type.
The improvement in travel times is a function of the design speeds proposed for the No Action and Action Alternatives. In the No Action Alternative, maximum speeds, consistent with today's railroad, are 150 to 160 mph, for limited stretches of the NEC. The Action Alternatives achieve higher design speeds for greater distances. For Alternatives 1 and 2, the top speed would remain at 160 mph; however, the territory operating at 160 mph would increase, with new segments that are less constrained by track geometry, topography, and the frequency of station stops. Alternative 3 introduces maximum speeds of up to 220 mph on new segments throughout much of the Study Area with the addition of the second spine.
Service reliability is measured by minutes of delay and on-time-performance (ability to meet scheduled arrival and departure times). The FRA designed the Action Alternatives to operate reliably; service is designed to operate within or below practical capacity with sufficient schedule margin (10 percent) to allow for recovery from unanticipated events. Due to capacity constraints, passenger rail service on the NEC today often operates at or above practical capacity, particularly in short windows of time, because there is insufficient capacity to recover from unanticipated events. The FRA expects the Action Alternatives to operate reliably, exceeding current on-time-performance metrics for the No Action Alternative.
Passenger rail travel times influence the attractiveness of passenger rail, particularly for longer-distance trips. The Action Alternatives would provide a range of travel-time savings between key markets.
Intercity-Express service between Washington, D.C., and Hartford, CT, is not possible in the No Action Alternative and Alternative 1. In Alternatives 2 and 3, which would operate through inland routing options to Hartford, CT, Intercity-Express service is 4 hours 5 minutes and 3 hours and 2 minutes, respectively.
Intercity-Corridor between Hartford and Stamford, CT, is just over 2 hours in the No Action Alternative. In Alternative 1, travel times decrease 40 minutes to just under 1 hour 27 minutes. Intercity-Express service is introduced in Alternatives 2 and 3, providing travel times between the two cities in just under 1 hour.
Intercity-Corridor between Hartford, CT, and Washington, D.C., is just over 6 hours 30 minutes in the No Action Alternative. Travel times in Alternative 1 would decrease 1 hour 20 minutes to 5 hours 14 minutes. Intercity-Express service is introduced in Alternatives 2 and 3, and would provide travel times between just over 5 hours in Alternative 2 and an average of just over 3 hours in Alternative 3.
Connecting Corridors
Travel-time improvements on the existing NEC in the Action Alternatives cascade to connecting corridor services as well. Longer-distance trips (e.g., Richmond Staples Mill Road to Penn Station New York or Albany-Rensselaer to Washington Union Station) would have travel-time improvements greater than 60 minutes in the Action Alternatives, with the greatest decreases in travel times occurring between Springfield and Washington Union Station where overall travel times could result in savings of more than 1 hour 30 minutes in Alternatives 2 and 3. Table 9-18 and Table 9-19 depict travel-time savings, compared to the No Action Alternative, for connecting corridors in the Action Alternatives. Travel-time savings on the Keystone Corridor between Harrisburg and Penn Station New York would range from 40 to 52 minutes, depending on the Action Alternative.
| Station 1 | Station 2 | Alternative 1 | Alternative 2 | Alternative 3 (Average) |
|---|---|---|---|---|
| South of Washington, D.C. | ||||
| Richmond Staples Mill Road | Washington Union Station | - 5 | - 2 | - 2 |
| Richmond Staples Mill Road | Penn Station New York | - 66 | - 71 | - 71 |
| Keystone Corridor | ||||
| Harrisburg | Washington Union Station | 0 | - 37 | - 46 |
| Harrisburg | Penn Station New York | - 40 | - 52 | - 48 |
| Empire Corridor | ||||
| Albany-Rensselaer | Washington Union Station | - 72 | - 79 | - 89 |
| Albany-Rensselaer | Penn Station New York | - 15 | - 15 | - 15 |
| New Haven-Hartford-Springfield | ||||
| Springfield | Washington Union Station | - 85 | - 103 | - 103 |
| Springfield | Penn Station New York | - 56 | - 72 | - 76 |
Source: NEC FUTURE Intercity Travel Demand Model outputs, April 2015
| Station 1 | Station 2 | Central Connecticut / Providence | Long Island / Providence | Long Island / Worcester | Central Connecticut / Worcester |
|---|---|---|---|---|---|
| South of Washington, D.C. | |||||
| Richmond Staples Mill Road | Washington Union Station | - 2 | - 2 | - 2 | - 2 |
| Richmond Staples Mill Road | Penn Station New York | - 71 | - 71 | - 71 | - 71 |
| Keystone Corridor | |||||
| Harrisburg | Washington Union Station | - 63 | - 45 | - 38 | - 38 |
| Harrisburg | Penn Station New York | - 48 | - 48 | - 48 | - 48 |
| Empire Corridor | |||||
| Albany-Rensselaer | Washington Union Station | - 89 | - 89 | - 89 | - 89 |
| Albany-Rensselaer | Penn Station New York | - 15 | - 15 | - 15 | - 15 |
| New Haven-Hartford-Springfield | |||||
| Springfield | Washington Union Station | - 103 | - 103 | - 103 | - 103 |
| Springfield | Penn Station New York | - 69 | - 83 | - 83 | - 68 |
Source: NEC FUTURE Intercity Travel Demand Model outputs, April 2015
Resiliency is the ability of a system to recover from disruptive events. A disruptive event could occur from a major operational impediment or from a catastrophic event, such as a natural disaster. The existing NEC has little ability to recover from a disruptive event. Each of the Action Alternatives would make the NEC more resilient by providing options to "get around" problems that may occur through the addition of various new segments along the corridor. These new segments create bypasses to the existing NEC that allow for train movements to continue, thereby creating redundancy of the rail line in specific areas. Specific examples of how the Action Alternatives would provide redundancy are provided in this section. Section 4.7 of the Alternatives Considered chapter contains detailed descriptions of the Representative Routes of the Action Alternatives.
Another factor in considering resiliency is the ability of the infrastructure to withstand increased risks of sea level rise, coastal storm surge flooding, and riverine flooding as described in Chapter 7.15, Climate Change and Adaptation. To identify the comparative level of risk between the existing NEC and select off-corridor segments of the Action Alternatives, this section focuses on the number of acres in the Representative Route at risk from all flooding hazards under current climate conditions. Within the Representative Route, analysis focuses on at-grade and trench construction types, as they are more sensitive to flood risk than others (e.g., tunnel, aerial, embankment and major bridge). Although the assessment focuses on at-grade and trench construction types, flooding impacts may also affect tunnels, embankments, and bridge construction types (for example via scour or erosion). Chapter 7.15, Climate Change and Adaptation, identifies known areas of vulnerability on the existing NEC. Where the Action Alternatives propose improvements to the existing NEC in areas of known vulnerability, construction of the improvements will address the underlying vulnerabilities of the existing NEC where practical.
The FRA focused on current climate conditions to simplify the analysis while still determining the comparative level of risk between the existing NEC and the Action Alternatives. The analysis provides a look at a comparative segment of the existing NEC to the proposed off-corridor route. Table 9-20 to Table 9-22 provide a summary of the acres of the Representative Routes for the existing NEC and Action Alternatives that are at risk of inundation due to sea level rise and coastal storm surges under current climate conditions. Considering the constructions types that are most vulnerable to inundation from flooding further emphasizes the resiliency of the Action Alternatives.
Alternative 1: Old Saybrook-Kenyon (Middlesex County, CT, to Washington County, RI)
Under Alternative 1, a new segment between Old Saybrook, CT, and Kenyon, RI, would be built away from the Long Island Sound, avoiding five existing movable bridges and navigable waterways along the Long Island Sound and portions of the existing NEC adjacent to the Connecticut shore line (Table 9-20).
Considering the construction types that are most vulnerable to inundation from flooding, the Old Saybrook-Kenyon new segment would reduce the number of acres of the Representative Route that are at risk from each flooding hazard compared to the existing NEC along the same route segment.
| Risk of Inundation | Existing NEC | Alternative 1: Old Saybrook-Kenyon (Middlesex County, CT, to Washington County, RI) |
|---|---|---|
| Sea Level Rise Flooding | 5 | 2 |
| Storm Surge Flooding | 126 | 3 |
| Riverine Flooding | 141 | 4 |
Source: NEC FUTURE team, 2015
Alternative 2: New Haven-Hartford-Providence (New Haven County, CT to Providence County, RI)
Under Alternative 2, the introduction of an inland route through Connecticut and Rhode Island would provide an alternate route that could assist in maintaining services if coastal inundation issues (or other hazards) affect assets or services along coastal Connecticut and Rhode Island (Table 9-21).
Considering the construction types that are most vulnerable to inundation from flooding, the New Haven-Hartford-Providence new segment has fewer acres of the Representative Route at risk from each flooding hazard than the comparative segment of the existing NEC.
| Risk of Inundation | Existing NEC | Alternative 2: New Haven-Hartford-Providence |
|---|---|---|
| Sea Level Rise Flooding | 7 | 1 |
| Storm Surge Flooding | 138 | 10 |
| Riverine Flooding | 353 | 139 |
Source: NEC FUTURE team, 2015
Alternative 3: New York County, NY, to Suffolk County, MA
Under Alternative 3, inland route options through either Long Island or Connecticut, and Massachusetts would assist in reducing service disruptions should a coastal flooding event affect assets along coastal Connecticut and Rhode Island (Table 9-22).
Considering the construction types that are most vulnerable to inundation from flooding, all of the Alternative 3 route options have fewer acres of the Representative Route at risk from each flooding hazard than the comparative segment of the existing NEC. Of the Alternative 3 route options, Alternative 3 via Central Connecticut and Worcester (Alternative 3.4) has the fewest number of acres of the Representative Route at risk from riverine flooding, and Alternative 3 via Long Island / Providence (Alternative 3.2) has the most number of acres.
| Risk of Inundation | Existing NEC | Alternative 3.1 (via Central Connecticut and Providence | Alternative 3.2 (via Long Island and Providence) | Alternative 3.3 (via Long Island and Worcester) | Alternative 3.4 (via Central Connecticut and Worcester) |
|---|---|---|---|---|---|
| Sea Level Rise Flooding | 10 | 1 | 1 | 0 | 0 |
| Storm Surge Flooding | 193 | 15 | 5 | 6 | 16 |
| Riverine Flooding | 277 | 97 | 102 | 47 | 42 |
Source: NEC FUTURE team, 2015
Stations at Risk
Table 9-23 summarizes, by Action Alternative, the total number of stations at risk of inundation under each climate condition timeframe. Appendix E, Section E.15, contains a detailed county-level listing of the stations at risk of inundation along each Action Alternative.
| Alternative 1 | Alternative 2 | Alternative 3 | |
|---|---|---|---|
| Current Climate Conditions | |||
| Total New Stations At Risk of Inundation | 7 | 10 | 15-16 |
| Total Existing Stations At Risk of Inundation | 54 | 55 | 55 |
| TOTAL Number of Stations At Risk of Inundation | 61 | 65 | 70-71 |
| Mid-Century Climate Conditions | |||
| Total New Stations At Risk of Inundation | 10 | 12 | 32-33 |
| Total Existing Stations At Risk of Inundation | 61 | 61 | 47 |
| TOTAL Number of Stations At Risk of Inundation | 71 | 73 | 79-80 |
| End-of-Century Climate Conditions | |||
| Total New Stations At Risk of Inundation | 10 | 12 | 15-17 |
| Total Existing Stations At Risk of Inundation | 63 | 63 | 65 |
| TOTAL Number of Stations At Risk of Inundation | 73 | 75 | 80-82 |
Source: NEC FUTURE team, 2015
Note: The numbers in this table represent the total number of stations at risk from one or more flood hazard.
There is a small difference in the number of stations at risk of inundation across the Action Alternatives. Each Action Alternative has a similar profile of the risk from each flooding hazard with riverine flooding accounting for a significant portion of the total number of stations at risk of inundation. For example under Alternative 1, of the 61 stations at risk, 37 stations would be at risk from sea level rise flooding and coastal storm surge flooding. An additional 24 stations would be at risk of inundation when considering riverine flooding for Alternative 1. In Alternatives 2 and 3, the number of stations at risk of inundation increases due to the increase in the number of stations served by the alternatives. While the total number of stations at risk increases under mid-century and end-of-century climate conditions, the risk profile from each flooding hazard is similar to that of the current climate conditions in that riverine flooding accounts for a significant portion of the total number of stations at risk.
Continued reliance on modes of transportation that result in greater energy consumption and encourage sprawl development affects environmental sustainability. Energy use and emissions associated with transportation diminish environmental quality. Expanding the availability of more energy efficient transportation modes, including passenger rail, is needed to support desired improvements in air quality and growth patterns.
Air Quality
Chapter 7.13, Air Quality, describes the existing and future level of contaminants in the air. The Clean Air Act (CAA), as amended, is the basis for most federal air pollution control programs. The U.S. Environmental Protection Agency (EPA), under the CAA, regulates air quality nationally. Under the authority of the CAA, the EPA established a set of National Ambient Air Quality Standards (NAAQS) for various "criteria" air pollutants. Under the CAA, a project cannot do the following:
Construction of the Action Alternatives would result in temporary emissions of criteria pollutants associated with construction equipment and activities. Local levels of criteria pollutants could also increase near station locations and parking facilities caused by vehicles queuing at these locations. The FRA did not conduct a quantitative analysis of the impacts to air quality from construction as a detailed construction schedule, along with estimates of construction equipment and activities are not developed as part of the NEC FUTURE.
Operation of each of the Action Alternatives, post construction, would have a beneficial effect on emissions of criteria pollutants and greenhouse gases (GHG) from roadway vehicles since they would decrease VMT and associated vehicle emissions. Changes in emissions of criteria pollutants and GHGs are expected to decrease under the Action Alternatives, because of the potential mode shift from auto and aircraft travel to passenger rail. However, the Action Alternatives would increase emissions of criteria pollutants and GHGs from power plants because of the increased electrical requirements of the trains under the Action Alternatives. Nonetheless, the net result is a decrease in emissions of criteria pollutants and GHGs under the Action Alternatives.
Energy
Chapter 7.14, Energy, describes existing and future energy use. Overall, all of the Action Alternatives would reduce total energy use; Alternative 3 would reduce total energy use the most and Alternative 1 would reduce total energy use the least. Of the Alternative 3 options, the option via Long Island and Worcester would result in the greatest reduction in total energy use and the option via Central Connecticut and Worcester would result in the smallest reduction in total energy use.
Changes in energy use of diesel trains are much smaller in scale than those from roadways and electric trains, with Alternatives 1 and 2 showing decreases in energy use of diesel trains. All Alternatives 3 route options would have no change or a slight increase in energy use of diesel trains.
All the Action Alternatives would reduce roadway energy use. The decreases in roadway energy use are attributed to decreases in VMT under the Action Alternatives, as compared to the No Action Alternative, caused by passengers choosing rail over other modes. Increases in electric train energy are attributed to the increases in electric train services associated with the Action Alternatives. Changes in energy use associated with diesel trains are also attributed to changes in levels of service in the Action Alternatives.
Investment in the NEC FUTURE passenger rail infrastructure would likely cause a shift in demand from aircraft and bus trips to rail. As such, the shift in travel mode choice would likely result in a reduction in energy use from aircraft and buses under all Action Alternatives; however, it was not within the scope of this analysis to make quantitative predictions regarding the level of decrease in energy use for aircraft and buses.
Development Growth Patterns
The FRA reviewed the existing goals and objectives of planning documents developed by the states and metropolitan planning organizations within the Study Area to identify compatibility of NEC FUTURE with these plans. Approximately 62 percent of the planning documents included goals and objectives related to transit-oriented development. (Appendix E, Section E.2, contains a complete list of all future planning documents reviewed within the Study Area.)
As described in Section 9.4.1.7, Economic Growth, the development around station-access points is among the most visible market change. It is also the most local in terms of geographic scale. The scale and character of the development is influenced by the nature of the rail service provided, as well as the ability of the surrounding area to plan for and provide the other necessary factors to support development around stations consistent with transit-oriented development - connecting infrastructure, available parcels of sufficient size to accommodate the new developments, and appropriate zoning are all examples of these necessary and complementary elements of station-area development.
In general, the areas around existing stations along the NEC are developed or are characterized by a mix of developed and undeveloped land. In areas that are heavily developed, induced growth could take place in urban infill locations (i.e., vacant land within existing built environments). Induced growth in urban infill locations would likely increase the density of the existing developed environment. Across the Action Alternatives, the Greater New York-North Jersey, Greater Philadelphia, and Greater Baltimore area see the greatest gains in station-area connections. While all stations would support greater development intensity, the Major Hub and Hub stations in these developed areas, which provide Intercity services, would likely support greater development intensity than Local stations where only Regional rail service is provided.
Economic growth depends on connectivity and access to labor markets, as described Chapter 3, Purpose and Need. Connectivity and access create economies of scale or agglomeration effects for individual metropolitan areas along the NEC. Economic growth is reflected in employment effects from construction of the rail infrastructure and operation of the NEC; monetized travel-time savings and emission savings associated with mode shift; and improved access to the labor market.
Employment Effects
The construction and operation of the No Action and Action Alternatives would influence economic activity throughout the Study Area. Building the requisite infrastructure and facilities would expand payrolls for the duration of the construction process. Similarly, operating, and maintaining the rail service would expand payrolls in each year the project is operated. The earnings of the newly-hired employees would translate into a proportional increase in consumer demand as these workers purchase goods and services in the region. Table 9-24 shows the anticipated total employment impacts from construction and operation of the No Action and Action Alternatives.
| Employment (in Job-Years) | No Action Alternative | Alternative 1 | Alternative 2 | Alternative 3 (range) |
|---|---|---|---|---|
| Construction Impacts - Total Employment | 297,800 | 773,670 | 1,561,100 | 3,166,500-3,739,900 |
| Full O&M Impacts - Total Employment | 3,100 | 11,500 | 21,600 | 28,000-31,100 |
| TOTAL Employment | 300,900 | 785,170 | 1,582,700 | 3,194,500-3,771,000 |
Source: NEC FUTURE team, 2015
Construction Impacts - Total Employment assumes rolling stock is manufactured in the U.S., but outside of the Study Area.
Travel Market Effects
Investing in the NEC FUTURE program would provide positive transportation market effects (Table 9-25 and Table 9-26). The benefits to users and non-users would include reduced travel time, travel cost, reduced likelihood of accidents, and emission reduction savings due to improved mobility, reduced VMT, and the subsequent reduction in congestion in the Study Area.
| Alternative 1 | Alternative 2 | Alternative 3 (average) | |
|---|---|---|---|
| Total Intercity Travel-Time Savings | $1,973 | $1,941 | $2,106 |
| Total Emissions Savings | $22 | $20 | $6 |
Source: NEC FUTURE team, 2015
| Central Connecticut / Providence | Long Island / Providence | Long Island / Worcester | Central Connecticut / Worcester | |
|---|---|---|---|---|
| Total Intercity Travel-Time Savings | $2,202 | $2,062 | $2,186 | $1,974 |
| Total Emissions Savings | $3 | - $1 | $2 | $21 |
Source: NEC FUTURE team, 2015
Access to Labor Markets
Improved rail service also creates the potential for labor markets to become more interlinked as additional places fall within a 30-minute travel shed (Table 9-27). While there would be a general expansion of places reachable by rail, there would not be a major change in market connections under Alternatives 1 and 2, with the exception that Hartford and New Haven, CT, would become just 30 minutes apart under Alternative 2. Under Alternative 3, markets would begin to expand; these gains would all be in the northern part of the corridor. Boston would connect to Providence, RI, and Worcester, MA, in 30 minutes. Travelers from Hartford may reach Worcester in 30 minutes as well. (See Chapter 6, Economic Effects and Growth, and Indirect Effects, for employment effects and access to labor markets.)
| Hub Station | No Action Alternative | Net of No Action Alternative | ||
|---|---|---|---|---|
| Alternative 1 | Alternative 2 | Alternative 3 (range) | ||
| Washington Union | 1,570,000 | 60,000 | 440,000 | 430,000 |
| Baltimore | 1,640,000 | 60,000 | 1,030,000 | 1,030,000 |
| Wilmington Station | 1,210,000 | 0 | 320,000 | 430,000 |
| Philadelphia | 1,030,000 | 0 | 730,000 | 230,000 |
| Trenton | 1,760,000 | 0 | 1,440,000 | 2,940,000 |
| Newark Penn Station | 4,940,000 | 0 | 400,000 | 680,000-1,420,000 |
| Penn Station New York | 3,360,000 | 840,000 | 1,410,000 | 1,240,000-2,460,000 |
| Nassau Hub | - | - | - | 8,150,000* |
| New Haven | 410,000 | 30,000 | 410,000 | 30,000-900,000 |
| Hartford | 300,000 | 0 | 240,000 | 320,000-570,000 |
| Boston South Station | 510,000 | 0 | 330,000 | 330,000-410,000 |
Source: NEC FUTURE team, 2015
Note: Philadelphia includes Philadelphia 30th Street Station and Philadelphia Market East. Baltimore includes Baltimore Penn Station and Baltimore Downtown. Counts shown exclude Regional Rail service. Job counts are representative of those within a 10-mile radius of stations accessible in a 30-minute travel time, exclusive of jobs surrounding the origin station. Estimates are based on 2010 employment data and were adjusted where station buffers overlap. For the Action Alternatives, counts shown are the change from No Action Alternative.
Net of No Action Alternative is the difference between the Action Alternative and the No Action Alternative.
*Only Alternatives 3.2 and 3.3 include Nassau Hub. See Table 9-28.
- = Not applicable within that alternative
| Hub Station | Net of No Action Alternative | |||
|---|---|---|---|---|
| Alternative 3 | ||||
| Central Connecticut/ Providence (3.1) | Long Island/ Providence (3.2) | Long Island/ Worcester (3.3) | Central Connecticut/ Worcester (3.4) | |
| Washington Union | 430,000 | 430,000 | 430,000 | 430,000 |
| Baltimore | 1,030,000 | 1,030,000 | 1,030,000 | 1,030,000 |
| Wilmington Station | 430,000 | 430,000 | 430,000 | 430,000 |
| Philadelphia | 730,000 | 730,000 | 730,000 | 730,000 |
| Trenton | 2,940,000 | 2,940,000 | 2,940,000 | 2,940,000 |
| Newark Penn Station | 680,000 | 1,420,000 | 1,420,000 | 680,000 |
| Penn Station New York | 1,240,000 | 2,460,000 | 2,460,000 | 1,240,000 |
| Nassau Hub | - | 8,150,000 | 8,150,000 | - |
| New Haven | 30,000 | 900,000 | 900,000 | 190,000 |
| Hartford | 560,000 | 570,000 | 330,000 | 320,000 |
| Boston South Station | 330,000 | 330,000 | 410,000 | 410,000 |
Source: NEC FUTURE team, 2015
Note: Philadelphia includes Philadelphia 30th Street Station and Philadelphia Market East. Baltimore includes Baltimore Penn Station and Baltimore Downtown. Counts shown exclude Regional Rail service. Job counts are representative of those within a 10-mile radius of stations accessible in a 30-minute travel time, exclusive of jobs surrounding the origin station. Estimates are based on 2010 employment data and were adjusted where station buffers overlap. For the Action Alternatives, counts shown are the change from No Action Alternative.
Net of No Action Alternative is the difference between the Action Alternative and the No Action Alternative.
- = Not applicable within that route option
Station-Area Development Effects
Development around station-access points is among the most visible market change. It is also the most local in terms of geographic scale. The scale and character of the development is influenced by the nature of the rail service provided, as well as the ability of the surrounding area to plan for and provide the other necessary factors to support development around stations - connecting infrastructure, available parcels of sufficient size to accommodate the new developments, appropriate zoning are all examples of these necessary, and complementary elements of station-area development.
Figure 9-1 summarizes the differences in the number of Local, Hub, and Major Hub stations by alternative and location. As stations move along the spectrum from Local station to Major Hub, they increase the number of modal options and rail services clustered at their locations: the greater the number of connections, the greater the potential for station-area development. Across the Action Alternatives, the Greater New York-North Jersey, Greater Philadelphia, and Greater Baltimore markets have the greatest gains in stations. Moreover, each gains one or more Hub stations. While all stations would support greater development intensity, Major Hub and Hub stations, which provide Intercity services, would likely support greater development intensity than Local stations where only Regional rail service is provided.
In addition to those metrics that evaluate how well the No Action and Action Alternatives meet the identified NEC FUTURE needs, there are other factors for costs and benefits that the FRA will consider in deciding on the preferred investment program for the Study Area. The environmental impacts, capital and operating costs, constructability, and phasing are all additional considerations used to evaluate the No Action and Action Alternatives.
Chapter 7 of this Tier 1 Draft EIS presents the effects-assessments for environmental resources. Each of these assessments is relevant to evaluating the Action Alternatives. Table 9-29 (and summary tables throughout Chapter 7) summarizes the metrics considered. Table 9-30 summarizes these environmental metrics for the Alternative 3 route options. In addition to environmental resources, effects on the multimodal transportation network (Chapter 5), economic growth (Chapter 6), and construction activities (Chapter 8), are also illustrative of the range of effects for the Action Alternatives; metrics related to these resource areas are summarized in later sections of this chapter. While all environmental factors are important, some have greater potential to influence the identification of a Preferred Alternative as they are tied to Executive Orders, environmental laws, regulations and regulatory requirements. Some of these laws require avoidance of impacts or selection of an alternative that has the least environmental impact. At a Tier 1 level of assessment, site specific constructability or feasibility factors are unknown, so the focus is on key resources associated with these laws and regulations.
Figure 9-1 : Number of Stations of Each Category in the NEC FUTURE Station Typology
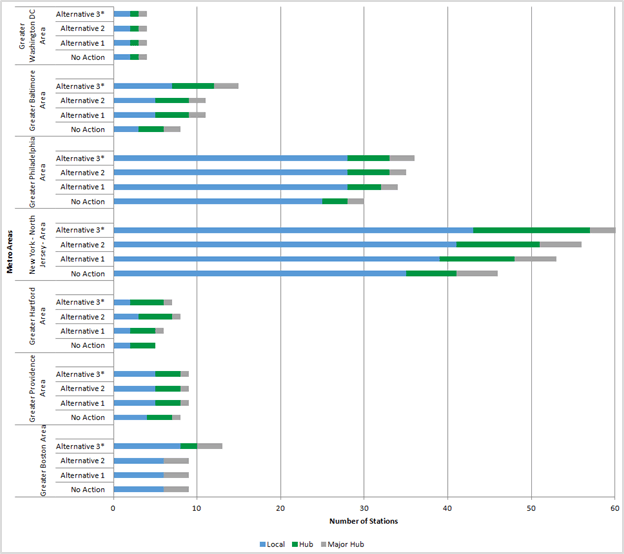
Source: NEC FUTURE team, 2015
Click to view larger version of Figure 9-1
| Resource | Measurement | Existing NEC | Alternative 1 | Alternative 2 | Alternative 3 (range) |
|---|---|---|---|---|---|
| Population | |||||
|
4.4 million | 4.5 million | 4.9 million | 5.9-6.5 million | |
| Environmental Justice 1 | |||||
|
59% census tracts | 59% census tracts | 57% census tracts | 54-56% census tracts | |
|
54% | 54% | 52% | 48-52% | |
|
17% | 17% | 16% | 16% | |
| Land Cover 2 | |||||
|
18% | 19% | 21% | 16-19% | |
| Water Resources | |||||
|
13% | 13% | 13% | 12-13% | |
|
40% | 43% | 35% | 29-35% | |
| Cultural Resources and Section 4(f)/6(f) | |||||
|
95 | 97 | 111 | 116-130 | |
|
20 | 21 | 23 | 23-27 | |
|
2 | 2 | 3 | 3-4 | |
|
30 | 142 | 171 | 136-150 | |
Source: NEC FUTURE, 2015
Note: Environmental Consequences calculated based on the Representative Routes of the Action Alternatives unless noted.
1. = Environmental Justice figures as represented correspond to a 1-mile Affected Environment.
2. = Potential land cover conversion figures exclude tunnel and major bridge construction types
| Resource | Measurement | Central Connecticut / Providence (3.1) | Long Island / Providence (3.2) | Long Island / Worcester (3.3) | Central Connecticut / Worcester (3.4) |
|---|---|---|---|---|---|
| Population | |||||
|
5.9 million | 6.2 million | 6.5 million | 6.2 million | |
| Environmental Justice 1 | |||||
|
54% | 56% | 56% | 54% | |
|
49% | 52% | 51% | 48% | |
|
16% | 16% | 16% | 16% | |
| Land Cover 2 | |||||
|
19% | 18% | 16% | 16% | |
| Water Resources | |||||
|
13% | 12% | 13% | 13% | |
|
29% | 31% | 35% | 33% | |
| Section 4(f)/6(f) | |||||
|
118 | 130 | 128 | 116 | |
|
25 | 27 | 25 | 23 | |
|
3 | 3 | 4 | 4 | |
|
147 | 150 | 139 | 136 | |
Source: NEC FUTURE, 2015
Note: Environmental Consequences calculated based on the Representative Routes of the Action Alternatives unless noted.
1 = Environmental Justice figures as represented correspond to a 1-mile Affected Environment.
2 = Potential land cover conversion figures exclude tunnel and major bridge construction types.
Understanding the number of people that could be affected by an alternative is important. As shown in Table 9-29, the FRA identified the population associated with census tracts intersected by the Affected Environment for each Action Alternative. Adverse effects on populations could include land acquisitions, displacements, and public health-related issues (i.e., exposure to hazardous materials, degradation of air quality and water quality). Conversely, benefits to these populations may also occur. Each Action Alternative has the potential to provide transportation and economic benefits through improvement mobility, accessibility, and connectivity. When compared to population affected by the existing NEC, Alternative 3 affects the highest population due to the additional markets served.
Executive Order 12898 requires federal agencies to consider the effects of their actions on minority and low-income populations and to determine if those effects are likely to result in disproportionately high and adverse effects on those populations (Environmental Justice [EJ] populations). For this Tier 1 level of assessment, the FRA identified the percentages of minority and low-income populations along each Action Alternative and potential environmental effects in those areas; however, as part of the Tier 1 assessment, the FRA is unable to make a determination on whether or not effects on those populations would be disproportionate. The areas with the greatest potential environmental effects within EJ census tracts are:
Conversion of undeveloped land cover to developed land cover in the Study Area can result in the fragmentation of wetlands and ecologically sensitive habitats; dredge and fill of wetlands; encroachment of floodplains; conversion of recreational resources; and prime farmland and timberlands. The percentage of undeveloped land cover in the Representative Route that would be converted ranges from 16 to 21 percent among the Action Alternatives, and therefore is not a key differentiator among the Action Alternatives. These conversions and subsequent effects on other resources occur mostly where Action Alternatives propose off-corridor segments or improvements outside of the existing NEC right-of-way.
Section 404 of the Clean Water Act protects hydrologic resources. Impacts to hydrologic resources can require approvals and permitting from federal, state, and local agencies. Unavoidable impacts to these resources often require mitigation, which can be difficult to achieve. Some hydrologic resources have special designations that require avoidance of impacts that can stop a project or require consideration of alternative routing. Key sensitive hydrologic resources/areas affected by the Action Alternatives include:
The impacts vary for the different route options of Alternative 3; the Long Island route option has nearly three times more impacts to the number of acres of wetlands compared to the Central Connecticut route option and would traverse 20 percent more route miles of coastal zone. In that route option, Suffolk County, NY, and associated Long Island Sound, have the potential for high ecological resource impact, particularly saltwater, Ecologically Sensitive Habitat, Essential Fish Habitat, and federally listed Threatened and Endangered species. Between Hartford, CT, and Boston, the Providence, RI, route option would affect 10 percent fewer acres of special flood hazard areas compared to the Worcester route option, however, there are approximately 35 percent more wetlands and nearly four times as many route miles of coastal zone that would be traversed.
Section 4(f) of the U.S. Department of Transportation Act protects publicly owned parks, recreational areas, wildlife and waterfowl refuges, and historic properties. Because this evaluation is not an action that will commit U.S. DOT resources to a project, the FRA will not make a Section 4(f) determination as part of this Tier 1 Draft EIS process. However, it has identified numerous parklands and historic properties located within the Representative Routes of all the Action Alternatives. (See Chapter 7.4, Parklands and Wild and Scenic Rivers, and Chapter 7.9, Cultural Resources and Historic Properties for a complete account of parklands and historic properties affected by the Action Alternatives.)
Of the Action Alternatives, Alternative 3 has the potential to affect the greatest number of parks (up to 130 parks), and has the potential to affect the most acres of parkland (up to 905 acres). Considering the potential environmental consequences of the alternatives, Alternative 2 is the only Action Alternative to cross the John Heinz National Wildlife Refuge in Delaware and Philadelphia, PA. Alternative 3 diverts from the existing NEC and would cross 70 acres of the Pelham Bay Park in Bronx, NY, and 60 acres of the Patuxent Research Refuge in Anne Arundel, MD. There is one wild and scenic river - White Clay Creek in New Castle, Delaware - that all of the Action Alternatives cross. Resources purchased with or that has used grants administered under the Land and Water Conservation Fund Act, also referred to as Section 6(f), also protect recreational and ecologically sensitive habitats. Each Action Alternative includes potential affects to Section 6(f) resources.
Section 106 of the National Historic Preservation Act (NHPA) provides for protection of historic properties. National Historic Landmarks (NHL) have the highest federal designation of historic significance. As a result, they require the most stringent consultation under Section 106 of the NHPA to resolve adverse effects, including shifting the location of the alternatives away from resources that could be affected. The NHL resources affected include the following:
Relative costs were developed to understand the differences in the level of investment for the No Action Alternative and the Action Alternatives. The cost of the No Action Alternative projects that are either funded or projects with approved funding plans, or funded or unfunded mandates, were included in the Action Alternatives. The No Action Alternative may have additional costs not accounted for, which would result from emergency or unplanned repairs, as the corridor would remain at heightened risk of service disruption and unpredictable failures. (For complete details of the costs and how the capital and O&M costs were developed, see Appendix D, Estimate Capital Cost Technical Memorandum, and Estimate Operating and Maintenance Costs Technical Memorandum.)
| Category | DESCRIPTION | Cost |
|---|---|---|
| 1 | Funded Projects | $8,350 |
| 2 | Funded and Unfunded Mandates | $980 |
| 3 | Unfunded Projects Necessary to Keep the Railroad Operating | $10,530 |
| TOTAL | $19,900 | |
Source: NEC FUTURE team, 2015
| Category | Alternative 1 (range) | Alternative 2 (range) | Alternative 3 (range) |
|---|---|---|---|
| Infrastructure | $52-54 | $116-$121 | $252-$293 |
| Vehicles | $3 | $5 | $6 |
| Subtotal | $54-$57 | $122-$127 | $257-$299 |
| No Action Alternative Projects | $9 | $9 | $9 |
| TOTAL | $64-$66 | $131-$136 | $267-$308 |
Source: NEC FUTURE team, 2015
Note: Infrastructure and Vehicles costs include new segments, new tracks, curve modifications, constructability access, stations, yards, junctions, professional services, environmental mitigation, right-of-way acquisition, vehicle costs, and contingencies consistent with Appendix B.6, Capital Cost Technical Memorandum. Cost does not include property acquisition costs for yards or stations.
| Category | Central Connecticut / via Providence | Long Island / via Providence | Long Island / via Worcester | Central Connecticut / via Worcester |
|---|---|---|---|---|
| Infrastructure | $267-$279 | $252-$262 | $265-$276 | $281-$293 |
| Vehicles | $6 | $6 | $6 | $6 |
| Subtotal | $273-$285 | $257-$268 | $271-$281 | $286-$299 |
| No Action Alternative Projects | $9 | $9 | $9 | $9 |
| TOTAL | $283-$294 | $267-$277 | $280-$291 | $296-$308 |
Source: NEC FUTURE team, 2015
Note: Infrastructure and Vehicles costs include new segments, new tracks, curve modifications, constructability access, stations, yards, junctions, professional services, environmental mitigation, right-of-way acquisition, vehicle costs, and contingencies consistent with Appendix B.6, Capital Cost Technical Memorandum. Cost does not include property acquisition costs for yards or stations
| No Action Alternative* | Alternative 1 | Alternative 2 | Alternative 3 (average) | |
|---|---|---|---|---|
| Revenue | $1,900 | $2,175 | $2,485 | $2,730 |
| Cost | $905 | $1,325 | $1,840 | $2,240 |
| Operating Profit | $995 | $845 | $645 | $490 |
Source: NEC FUTURE, 2015
Note: Numbers may not add due to rounding.
*Since the No Action Alternative continues current service levels and remains capacity constrained, fares per passenger are higher under this alternative. In addition, the No Action Alternative may also incur additional operating costs due to the higher risk of unplanned service disruptions.
| Central Connecticut / via Providence | Long Island / via Providence | Long Island / via Worcester | Central Connecticut / via Worcester | |
|---|---|---|---|---|
| Revenue | $2,785 | $2,720 | $2,760 | $2,650 |
| Cost | $2,320 | $2,230 | $2,230 | $2,185 |
| Operating Profit | $465 | $490 | $530 | $470 |
Source: NEC FUTURE, 2015
Note: Numbers may not add due to rounding.
The Action Alternatives involve construction of significant new rail infrastructure - tunnels, bridges, embankments, new stations and ancillary roads and support facilities - across the NEC over an extended period. Chapter 8, Construction Effects, describes the potential construction types and sequencing that would likely be required for constructing any of the Action Alternatives. Table 9-36 describes the percentage of construction types by route distance for the existing NEC and each Action Alternative.
| Construction Type | Existing NEC | Alternative 1 | Alternative 2 | Alternative 3 (average) |
|---|---|---|---|---|
| Tunnel | 2% | 6% | 11% | 18% |
| Trench | 1% | 2% | 4% | 6% |
| At Grade | 56% | 50% | 44% | 37% |
| Embankment | 36% | 35% | 33% | 30% |
| Aerial | 3% | 5% | 7% | 8% |
| Major bridge | 2% | 2% | 1% | 1% |
Source: NEC FUTURE, 2015
As this table shows, the percentage of route miles of tunnel construction increases the greatest amount in the Action Alternatives compared to the existing NEC. The amount of tunnel in Alternative 3 is much greater than the No Action Alternative. All of the Action Alternatives would include approximately 2.5 miles of new tunnels in Baltimore, and approximately 3 miles of new tunnels crossing the Hudson River from New Jersey to New York. In Alternative 3, tunnels would account for approximately 18 percent of the construction types, of which one route option would include approximately 22 miles of tunnel across the Long Island Sound, and another route option would include approximately 55 miles of tunnel from New York City to Hartford via Central Connecticut.
Table 9-37 summarizes the factors and metrics discussed in this chapter to evaluate the similarities and differences between the No Action and Action Alternatives. Service frequency, capacity, and annual passenger trips increase as the service objectives for each Action Alternative increase, demonstrating the range of possibilities for the role of rail in the Study Area. Table 9-37 illustrates the overall potential for improved mobility and economic growth. Metrics that capture changes in service frequency and travel times demonstrate how each Action Alternative would change travel from a local perspective. Both the end-to-end and local (sub-region or city-pair) perspectives are important in considering the benefits and costs of the No Action and Action Alternatives.
| Project Needs Addressed | Metrics for Evaluating | No Action | Alternative 1 | Alternative 2 | Alternative 3 (average) |
|---|---|---|---|---|---|
| Aging Infrastructure |
|
NO | YES | YES | YES |
| Capacity |
|
Washington: 6 Hudson River:24 Boston: 11 |
Washington: 12 Hudson River: 37 Boston: 17 |
Washington: 20 Hudson River: 52 Boston: 22 |
Washington: 24 Hudson River: 70 Boston: 24-32 |
|
- | 2X the No Action | 3X the No Action | 5X the No Action | |
|
WAS: 6,610 Hudson: 30,374 Boston: 9,562 |
WAS: 9,615 Hudson: 44,993 Boston: 13,528 |
WAS: 11,173 Hudson: 61,280 Boston: 14,682 |
WAS: 12,403 Hudson: 71,111 Boston: 18,480 |
|
|
439,100 | 508,200 | 532,500 | 584,500 | |
|
19,300 | 33,700 | 37,100 | 39,000 | |
|
419,800 | 474,500 | 495,400 | 545,500 | |
|
13,957,565 | 17,640,308 | 19,142,079 | 20,710,292 | |
|
3,103,000 | 5,610,200 | 6,232,400 | 6,565,500 | |
|
11,264,400 | 12,547,100 | 13,455,800 | 14,713,900 | |
|
N/A | - 2,000 | - 2,600 | - 3,100 | |
|
- | 36% | 44% | 46% | |
| Connectivity |
|
BWI: 141 PHL: 72 EWR: 152 T.F. Green: 25 |
BWI: 252 PHL: 72 EWR: 240 T.F. Green: 81 |
BWI: 386 PHL: 308 EWR: 364 T.F. Green: 74 |
BWI: 450 PHL: 374 EWR: 414 T.F. Green: 101 |
|
- | WAS-NJ/NY: 83 NJ/NY-BOS: 216 PHL-BOS: 42 |
WAS-NJ/NY: 164 NJ/NY-BOS: 274 PHL-BOS: 47 |
WAS-NJ/NY: 225 NJ/NY-BOS: 248 PHL-BOS: 45 |
|
|
WAS-NYC: 36 NYC-BOS: 19 |
WAS-NYC: 70 NYC-BOS: 47 |
WAS-NYC: 96 NYC-BOS: 88 |
WAS-NYC: 150 NYC-BOS: 143 |
|
|
|
|
|
|
|
|
|||||
|
Odenton: 0 PHL Airport: 0 Secaucus: 0 Providence: 38 |
Odenton: 44 PHL Airport: 0 Secaucus: 0 Providence: 98 |
Odenton: 92 PHL Airport: 92 Secaucus: 108 Providence: 198 |
Odenton: 112 PHL Airport: 86 Secaucus: 174 Providence: 167 |
|
|
Odenton: 59 PHL Airport: 72 Secaucus: 367 Providence: 74 |
Odenton: 108 PHL Airport: 72 Secaucus: 522 Providence: 84 |
Odenton: 164 PHL Airport: 216 Secaucus: 722 Providence: 104 |
Odenton: 188 PHL Airport: 288 Secaucus: 970 Providence: 140 |
|
|
Odenton: 59 PHL Airport: 72 Secaucus: 367 Providence: 74 |
Odenton: 152 PHL Airport: 72 Secaucus: 522 Providence: 182 |
Odenton: 256 PHL Airport: 308 Secaucus: 830 Providence: 302 |
Odenton: 300 PHL Airport: 374 Secaucus: 1144 Providence: 307 |
|
| Performance |
|
- | WAS-NYC: 15 NYC-BOS: 40 |
WAS-NYC: 22 NYC-BOS: 70 |
WAS-NYC: 32 NYC-BOS: 87 |
|
ODN-TRE:- WAS-HFD: 6:35 PHL-NHV: 3:23 |
ODN-TRE: 2:10 WAS-HFD: 5:14 PHL-NHV: 2:48 |
ODN-TRE: 2:03 WAS-HFD: 5:02 PHL-NHV: 2:35 |
ODN-TRE: 1:43 WAS-HFD: 4:19 PHL-NHV:2:36 |
|
|
WAS-NYC: 160 NYC-BOS: 150 |
WAS-NYC: 160 NYC-BOS: 160 |
WAS-NYC: 160 NYC-BOS: 160 |
WAS-NYC: 220 NYC-BOS: 220 |
|
| Resiliency |
|
WAS-NYC: 1 NYC-BOS: 1 |
WAS-NYC: 1 NYC-BOS: 1 |
WAS-NYC: 1 NYC-BOS: 2 |
WAS-NYC: 2 NYC-BOS: 2 |
|
|||||
|
- | SLR13:5/2 SSF14: 126/3 RF15:141/4 |
- | - | |
|
- | - | SLR:7/1 SSF: 138/10 RF:353/139 |
- | |
|
SLR:10/0 - 1 SSF: 193/5 - 16 RF:277/42 - 97 |
||||
|
|||||
|
- | 7 | 10 | 15-16 | |
|
- | 54 | 55 | 55 | |
| Environmental Sustainability |
|
||||
|
- | - 274,650 | - 327,180 | - 252,461 | |
|
- | - 2,480 | - 3,375 | - 3636 | |
|
- | - 30 | - 45 | - 44 | |
|
- | - 75 | - 80 | 8 | |
|
- | - 30 | - 35 | - 34 | |
|
- | - 10 | - 10 | - 5 | |
|
- | 170 | 340 | 516 | |
|
- 3,813,815 | - 4,899,110 | - 4,526,791 | ||
|
- | - 4,815,105 | - 6,516,805 | - 7,108,620 | |
|
- | - 1 | - 128,585 | 3 | |
|
- | 1,001,290 | 1,746,280 | 2,581,826 | |
| Economic Growth |
|
300,900 | 785,170 | 1,582,700 | 3,483,000 |
|
297,800 | 773,670 | 1,561,100 | 3,453,200 | |
|
3,100 | 11,500 | 21,600 | 29,600 | |
|
|||||
|
- | $1,973 | $1,941 | $2,106 | |
|
- | $22 | $20 | $6 | |
|
5 stations | 24 stations | 27 stations | 42-47 stations | |
|
- | WAS: 60 NYP: 840 BOS: 0 |
WAS: 440 NYP: 1,410 BOS: 330 |
WAS: 430 NYP: 1,850 BOS: 370 |
|
| Environmental Impacts |
|
||||
|
4.4 million | 4.5 million | 4.9 million | 5.9-6.5 million | |
|
59% census tracts | 59% census tracts | 57% census tracts | 54-56% census tracts | |
|
18% of the Representative Route | 19% of the Representative Route | 21% of the Representative Route | 16-19% of the Representative Route | |
|
20 | 21 | 23 | 23-27 | |
|
95 | 97 | 111 | 116-130 | |
|
30 resources | 142 resources | 171 resources | 136-150 resources | |
| Cost |
|
$19.9 | $63.6-$66.2 | $131.0-$136.1 | $266.8-$308.0 |
|
$995 | $845 | $645 | $490 |
Source: NEC FUTURE team, 2014
All Action Alternatives would bring the NEC to a state of good repair, eliminating the backlog of infrastructure requiring replacement, and enabling future capital upgrades to be planned and implemented according to a regular replacement cycle.
Demand for Intercity and Regional Rail service exceeds practical capacity under the No Action Alternative across the NEC. The greatest unmet demand is at the Hudson River. Alternative 1 provides sufficient capacity to accommodate demand at all places along the corridor except at the Hudson River. Alternative 2 provides sufficient capacity to accommodate demand at the Hudson River and provides excess demand at other locations along the corridor to accommodate additional off-corridor trips or future growth post 2040. Alternative 3 creates excess capacity at all locations along the corridor to accommodate additional off-corridor trips and future growth post 2040.
Regional rail service in Alternative 2 continues to operate at approximately 100 percent utilization of available capacity. Alternative 2 increases the number of peak seats at the screenline by 120 percent compared with the No Action Alternative.
Alternative 3 has the greatest increase in capacity utilization over the No Action Alternative, especially in the largest metropolitan areas. For New York City, Alternative 3 provides five times more peak-hour Intercity trains than does the No Action Alternative. This is primarily due to the new rail infrastructure that creates a second spine between Washington, D.C., and Boston. All Action Alternatives would increase total rail trips consistent with the vision of each Action Alternative. However, the effects the Action Alternatives would have on Intercity travel are fairly consistent, especially between Alternative 2 and Alternative 3. Compared to the No Action Alternative, Intercity passenger-miles traveled would increase 148 percent in Alternative 2 compared to the No Action Alternative, and an average of 152 percent across the Alternative 3 route options compared to the No Action Alternative. However, in Alternative 1, Intercity-Express passenger miles would decrease compared to the No Action Alternative due to improved Intercity-Corridor services (e.g., Metropolitan service).
In comparing Action Alternatives against the No Action Alternative, Alternative 1 improves connectivity at airport stations the least, adding the fewest number of daily passenger trains. Alternative 3 adds the most number of daily passenger trains to these airport stations. At Baltimore/Washington International Thurgood Marshall Airport, Alternative 3 would provide 309 more trains per day than the No Action Alternative, a 219 percent increase.
Alternative 2 provides more daily Regional rail service than Alternative 3, which provides more daily Intercity rail service. This connectivity data indicates that Alternative 2 does more to improve Regional rail connectivity than Alternative 3, whereas Alternative 3 improves Intercity rail connectivity more than Alternative 2.
The introduction of Intercity service, mostly Metropolitan, at select rail stations greatly improves connectivity to interregional markets in all Action Alternatives. Intercity service would be possible from Odenton, MD, and Secaucus, NJ.
Passenger rail performance, as measured by travel time and reliability, would improve in the Action Alternatives when compared to the No Action Alternative. Operating speeds on the existing NEC today are slower than what they would be in all Action Alternatives. South of New York City, the top operating speed is 125 to 135 mph. North of New York City, the top operating speed is 125 except for a length of track between New London, CT, and Providence, RI, with a top operating speed of 150 mph.
The Action Alternatives would achieve higher design speeds for greater distances as compared to the No Action Alternative. Only Alternative 3 would provide top Intercity-Express operating speeds of 220 mph between only Philadelphia, PA, and Hartford, CT. Alternative 1 and Alternative 2 would have top Intercity-Express operating speeds of 160 mph. In Alternative 1, top operating speeds of 160 mph would be possible only between Philadelphia and New York City. In Alternative 2, top operating speeds of 160 mph would be expanded from Alternative 1, and possible between Washington, D.C., and New York City; and between New Haven, CT, and Boston via Hartford, CT.
Travel-time savings are greatest over longer-distance city-pairs and where new rail infrastructure would be built between the pairs. As such, the Alternative 3 route options, which would have new rail infrastructure sufficient to build a second spine between Washington, D.C., and Boston, would provide the most Intercity-Express travel-time savings. As the travel-time data show, between Washington, D.C., and Boston, Alternative 3 would have travel-time savings over 156 minutes compared to the No Action Alternative, over 60 minutes compared to Alternative 2, and almost 120 minutes compared to Alternative 1. Those city-pairs not connected by new rail infrastructure or those city-pairs that would be served only by Intercity-Corridor service would have much smaller savings in travel time. Intercity-Corridor travel-time savings between Philadelphia and New Haven would be 49 minutes in Alternative 2 and 47 minutes in Alternative 3.
The Action Alternatives provide some degree of resiliency by adding various new segments along the corridor. The addition of a second spine in Alternative 3 would provide the most redundant infrastructure for all Action Alternatives. The Action Alternatives would reduce the risk of flooding, consistent with the amount of new infrastructure built in each Action Alternative. All of the Action Alternatives would provide resilient infrastructure: most of the new portions of the Representative Route for each alternative would be located within inland portions of the Study Area, or would be construction types that are more resilient to inundation.
Of the Alternative 3 route options, Alternative 3 via Central Connecticut and Worcester (Alternative 3.4) has the fewest number of acres of the Representative Route at risk from riverine flooding, and Alternative 3 via Long Island / Providence (Alternative 3.2) has the most number of acres. Total route miles vulnerable to inundation in Alternative 3 decrease between 33 percent and 44 percent, depending on the route option, which is the most of any Action Alternative.
All Action Alternatives would reduce net emissions of criteria pollutants and GHGs. The Action Alternatives would increase emissions of criteria pollutants and GHGs from power plants because of the increased electrical requirements of the trains under the Action Alternatives. However, the net reduction in emissions from roadways would offset the increase in emissions of GHGs and criteria pollutants.
Overall, the Action Alternatives each would reduce energy use, with Alternative 3 decreasing energy use the most and Alternative 1 decreasing total energy use the least. Of the Alternative 3 options, the option via Long Island and Worcester would decrease total energy use the most and the option via Central Connecticut and Worcester would decrease total energy use the least.
Consistent with the goals and objectives of state and metropolitan planning organizations within the Study Area related to transit-oriented development, the Action Alternatives have the potential to support development around stations. Alternative 3 has the greatest potential for growth and development around stations.
Construction and rail operation employment effects are derivative of the investment. As such, Alternative 3, which has the most rail capital investment, has the greatest employment growth in construction and rail operations.
Diversions to Intercity rail provide positive transportation market effects in all Action Alternatives. Alternative 1 and Alternative 2 would provide Intercity travel-time savings benefits, at approximately $1,973 million and $1,941 million, respectively. Alternative 3 would provide the most travel-time savings benefits, primarily due to diverting potential travelers from auto and intercity bus modes to Intercity rail, resulting in travel-time savings of approximately $2,106 million. (See Chapter 6, Economic Effects and Growth, and Indirect Effects, for additional details of monetized value for changes in travel time.)
The Action Alternatives would reduce emissions, and produce emission savings, indicating that each Action Alternative would reduce emissions costs in the region and provide environmental benefits. Among all Action Alternatives, Alternative 1 would have the largest reduction of emission impacts, approximately $22 million. The reduced total emissions savings between Alternatives 2 and 3 compared to Alternative 1 is due to the increasing emissions costs over the majority of the corridor being offset largely by the emissions savings in New York and New Jersey, which have the largest emissions benefits across all alternatives. (See Chapter 6, Economic Effects and Growth, and Indirect Effects, for additional details of monetized value for changes in emissions.)
The Action Alternatives would expand the number of places reachable by rail within 30 minutes of train travel time compared to the No Action Alternative. In focusing on specific markets, it was found Alternatives 1 and 2 would provide significant gains to Hartford and New Haven, CT, which would become just 30 minutes apart for rail passengers under Alternative 2. Alternative 3 route options through Long Island would create access to about 55 percent more jobs around Penn Station New York than route options through Central Connecticut.
Of the Action Alternatives, Alternative 1 carries the lowest capital cost and greatest net revenue. Alternative 3 has the greatest capital cost, and lowest net revenue. This indicates there are diminishing returns in net revenue on the rail investment: as the capital costs increase, O&M net revenue decreases.
1 As considered in this Tier 1 Draft EIS, the Action Alternatives do not provide the level of detail necessary to select a specific track alignment or define specific railroad operator timetables.
2 Refer to Chapter 1, Introduction, for a summary on how the FRA will select a vision for the NEC.
3 While no significant capacity is added to the NEC via the projects included in the No Action Alternative, the No Action Alternative does include the MTA's East Side Access project, which will add capacity into New York City. Similarly, railroad operators might add service in the off-peak periods where capacity constraints allow.
4 Magnetic levitation is an advanced transportation technology in which magnetic forces lift, propel, and guide a vehicle over a specially designed guideway. For more information on magnetic levitation technology, see Federal Railroad Administration, Magnetic Levitation Transportation Technology Deployment Program. 49 CFR Part 268. [FRA Docket No. FRA-98-4545; Notice No.3]. RIN 2130-AB29]. .
5 Abril, M, Barber, F, Ingolotti, L, Salido, M A, Tormos, P, Lova, A, (2008). An Assessment of Railway Capacity. Transportation Research Part E: Logistics and Transportation Review, Volume 44, Issue 5, pp 774-806.
6 Service has been allocated to new and existing stations within the same metropolitan area to test the market potential. The specific distribution of trains to each station within a "group" is for evaluation purposes only and not intended to determine specific schedules.
7 Philadelphia International Airport is served today by Regional rail service located off the existing NEC.
8The Philadelphia International Airport Station identified in the Action Alternatives would be built as part of NEC FUTURE.
9 T.F. Green Airport is served by Regional rail service today; Intercity Rail service is included in the Action Alternative service plans.
10 Daily frequencies are calculated by summing up all trains, which serve station-pairs, which can include multiple routings.
11 Regional Rail service on the New Haven-Hartford-Springfield Line is part of the No Action Alternative. There is currently no Regional Rail service on this connecting corridor.
12 The Massachusetts Department of Transportation and the Vermont Agency of Transportation, in collaboration with the Connecticut Department of Transportation and the FRA are conducting the Northern New England Intercity Rail Initiative (NNEIRI), a study to examine the opportunities and impacts of more-frequent and higher-speed intercity passenger rail service on two major rail corridors known as the Inland Route and the Boston-to-Montreal Route. The Inland Route corridor runs between Boston South Station and western Massachusetts via Worcester and Springfield, MA, and southerly from Springfield, MA, to New Haven, CT, for connections to the Amtrak Northeast Corridor. The Boston to Montreal corridor is the same as the Inland Route corridor between Boston and Springfield Union Station. From Springfield, the rail corridor runs northerly through Holyoke, Northampton, and Greenfield. In Vermont, the rail corridor runs on the east side of the state to White River Junction before heading northwesterly to Montpelier and Essex Junction before heading north through St. Albans and to the Canadian border at Alburg. The rail corridor then runs to Montreal Central Station in Quebec.
13 = Sea Level Rise (SLR)
14 = Storm Surge Flooding (SSF)
15 = Riverine Flooding (RF)
The information posted on this website includes hypertext links or pointers to information created and maintained by other public and/or private organizations. The FRA provides these links and pointers solely for information and convenience. When users select a link to an outside website, they are leaving the NEC FUTURE website and are subject to the privacy and security policies of the owners/sponsors of the outside website. The FRA does not control or guarantee the accuracy, relevance, timeliness or completeness of information contained on a linked website, or endorse the organizations sponsoring linked websites, the views they express, or the products/services they offer. The FRA cannot authorize the use of copyrighted materials contained in linked websites and is not responsible for transmissions users receive from linked websites.